Citrifolin A: A New Alkylresorcinol Glucoside Isolated from the Leaves of Eugenia citrifolia
Abstract
An unprecedented alkylresorcinol glucoside, named citrifolin A, was isolated from the leaves of Eugenia citrifolia Poir. (Myrtaceae). Its structure was elucidated by nuclear magnetic resonance (NMR) spectroscopy in combination with high-resolution mass spectrometry (HRMS), and its absolute configuration was established by electronic circular dichroism (ECD) spectroscopy supported by density functional theory (DFT) calculations. The antioxidant potential of citrifolin A was evaluated using 2,2-diphenyl-1-picrylhydrazyl (DPPH) and 2,2’-azinobis (3-ethylbenzothiazoline-6-sulfonic acid) (ABTS) free-radical scavenging assays, in which the compound exhibited low activity.
Keywords:
Amazon rainforest; Myrtaceae; antioxidant assays; NMR; HRMS; ECD
Introduction
Eugenia is the largest genus in the Myrtaceae family and comprises more than 500 species, distributed mainly in the South American region.1 Among these 500, 387 species occur in Brazil, of which 92 are recorded in the Amazon rainforest.2 Many Eugenia species have been used in traditional medicine for prevention and treatment of several diseases, such as rheumatism, hypertension, cancer and diabetes.3-5 These species demonstrate great economic and pharmaceutical potential, especially as a promising source of natural antioxidants, such as flavonoids and alkylresorcinols.5-12 For alkylresorcinols, a broad range of biological activities have been reported, including the inhibition of the GPDH (glycerol-3-phosphate dehydrogenase) enzyme.13 It is known that a high fiber human diet, whose alkylresorcinols are natural components, should be associated with the prevention of excessive triglycerides accumulation in adipocytes. These compounds also participate in the oxidation of LDL (low-density lipoproteins) and inhibit the growth of cancer cells in the human colon and the proteasome.13-15
Considering the recognized ethnopharmacological relevance and chemical diversity reported for several species of this genus, yet the limited scientific exploration of specific taxa, Eugenia citrifolia Poir., a species native to the Amazon rainforest and occurring predominantly in the Northern and Central-West regions of Brazil,2 remains chemically and biologically unexplored. In the context of expanding the chemical knowledge of Eugenia species,16,17 an unprecedented alkylresorcinol glucoside was successfully isolated from the leaves of E. citrifolia, thereby contributing new molecular evidence to the metabolite repertoire of the genus. Thus, investigating the antioxidant capacity of this new metabolite represents an appropriate way to probe the biological potential of the phenolic compounds present in E. citrifolia.
Experimental
Materials and reagents
The solvents hexane, ethyl acetate, ethanol, and methanol (Tedia® brand, High Purity Solvents) were used in the extraction procedures to obtain the extracts. Deuterated methanol, used in nuclear magnetic resonance (NMR) analyses, was purchased from Cambridge Isotope Laboratories Inc. (Andover, MA, USA). Methanol used in semi-preparative high-performance liquid chromatography (HPLC) analyses was purchased from Sigma-Aldrich (St. Louis, MO, USA) along with demineralized water. The reagents 6-hydroxy-2,5,7,8-tetramethylchroman-2-carboxylic acid (Trolox), 2,2-diphenyl-1-picrylhydrazyl (DPPH•), and 2,2’-azino-bis(3-ethylbenzothiazoline-6-sulfonic acid) diammonium salt (ABTS•+), as well as methanol used in the antioxidant assays, were obtained from Sigma-Aldrich (St. Louis, MO, USA).
Plant material
The leaves from a flowering Eugenia citrifolia Poir. (syn. Eugenia adenocalyx DC.) plant were collected in the Adolpho Ducke Forest Reserve (2º55’42.41’’S, 59º58’37.34’’W), Manaus, AM, Brazil (SisGen No. A0092B9). This plant material was identified by Prof Dr Maria Anália D. Souza for which a voucher specimen (No. 273.001) was deposited at the Herbarium of the National Institute of Amazonian Research (INPA).
Extraction and isolation
500.0 g of dried and powdered Eugenia citrifolia leaves were exhaustively extracted by cold maceration with 4 L of hexane, followed by 4 L of ethyl acetate, and 4 L of ethanol, respectively. The solvents were removed under reduced pressure using rotary evaporation at 40 °C. A 5.0 g portion of the ethanol extract were subjected to vacuum liquid chromatography (VLC) on a silica gel column and eluted with 1 L each of hexane, ethyl acetate, and methanol (MeOH), respectively. The MeOH fraction was further fractionated on a C18 silica gel column, eluting with a gradient of methanol:water (20:80 to 100:0), yielding six major fractions (approximately 50 mL each). The chromatographic profile of fraction 5 was obtained by analytical high-performance liquid chromatography with diode-array detection and mass spectrometry (HPLC DAD MS) using a C18 column under a methanol:water gradient (35-70% over 35 min; 200 600 nm; 100-1000 m/z), with a 1.0 mg mL-1 solution, an injection volume of 10 μL, and a flow rate of 1.0 mL min-1. Based on the analytical profile, 90 mg of fraction 5 were dissolved in 200 μL of dimethyl sulfoxide (DMSO) and fractionated by semi-preparative high-performance liquid chromatography with ultraviolet detection (HPLC-UV) using a C18 column under isocratic elution (methanol:water 35:65 over 35 min; detection at 234 and 304 nm), with a flow rate of 4.7 mL min-1 and an injection volume of 200 μL. This process yielded nine subfractions, from which subfraction B (6.7 mg) was subsequently identified as citrifolin A.
Instrumentation
1D and 2D NMR experiments for citrifolin A were acquired in deuterated methanol (CD3OD) at 298 K on a Bruker AVANCE IIIHD spectrometer operating at 11.75 T (500.13 MHz for 1H and 125.0 MHz for 13C) equipped with a 5 mm multinuclear probe (BBFO Plus SmartProbe™). All 1H and 13C NMR chemical shifts (d) are presented in parts per million (ppm) relative to the tetramethylsilane (TMS) signal at 0.00 ppm as an internal reference, and the coupling constants (J) are given in hertz. Mass spectrometry data for citrifolin A (1) were obtained using a Thermo Scientific LCQ Fleet mass spectrometer and a Bruker MicrOTOF QII mass spectrometer, both equipped with an electrospray ion source (ESI). ESI analytical conditions: spray voltage, 4.5 kV; sheath gas, 20 arbitrary unit (arb); auxiliary gas, 5 arb; sweep gas, 0 arb; capillary temp, 200 ºC; capillary voltage, 40 V; tube lens, 115 V; collision energy, 30 eV. All NMR spectra were processed and analyzed using TopSpin 3.6.5 software (Bruker, DE), whereas mass spectrometric data were processed using Xcalibur 2.0.7 software (Thermo Scientific, USA) and DataAnalysis 4.1 (Bruker, DE). Semi-preparative high-performance liquid chromatography (HPLC) analysis was performed on a Shimadzu UFLC system equipped with a Luna C18(2) column (250 mm × 10 mm, 5 μm) and a UV detector set at 234 and 304 nm. Column chromatography were performed on silica gel (Merck, 70-200 and 40-63 μm). The UV-Vis analysis of citrifolin A was carried out on a Shimadzu UV 2401PC spectrophotometer, at a wavelength of 190 700 nm. Quartz cells with a path length of 1 cm and methanol were used to solubilize the sample. The electronic circular dichroism (ECD) spectrum for citrifolin A was obtained using the JASCO J-815 spectrophotometer equipped with a temperature control unit. The analysis was performed at 25 °C using a quartz cuvette with an optical path of 0.20 cm and nitrogen as a purge gas in a flow of 10.0 L min-1. The sample concentration used in the experiment was 0.50 mg mL-1 in MeOH. The baseline of the spectrum was corrected by subtracting the ECD spectrum obtained for the solvent used (MeOH, spectroscopic grade).
Computational methods
The structures were initially drawn and subjected to a MMFF94 conformational search using Avogadro software18 for the two stereoisomers of citrifolin A, with the absolute R and S configurations at the C-2’ stereogenic center. Subsequently, all resulting structures were optimized using a density functional theory (DFT) approach at the B3LYP/6-31G(d) level of theory with implicit solvation in methanol using the SMD (solvation model based on density), including frequency calculations to confirm their nature as true minima using Gaussian 09 software.19 Gibbs free energies were extracted from each optimized geometry, and Boltzmann weights were calculated using the Boltzmann distribution equation at 298.15 K. A cutoff of 0.01% was used to select the conformers.
A total of 11 conformers were selected for each diastereoisomer (2’R and 2’S) (Figures S1 and S2; Tables S1 and S2, Supplementary Information (SI) section). For these structures, single-point time-dependent density functional theory (TD-DFT) calculations were performed at the CAM-B3LYP/6-311++G(2d,p) level to simulate the electronic circular dichroism (ECD) spectra. The individual spectra obtained for each stereoisomer were then combined using their respective Boltzmann weights, producing a Boltzmann-averaged spectrum for both stereoisomers. The resulting theoretical spectra obtained for the two stereoisomers were compared with experimental ECD spectra (scaled by 1.357) obtained according to the methodology reported by Nughoro and Morita.20 In all simulations, solvation effect of methanol were included using the SMD model.21
DPPH radical scavenging capacity
The antioxidant activity for citrifolin A was determined using the free radical DPPH• in accordance with the previously described methodology by Molyneux22 with slight modifications by Ramos et al.16 The sample solution was solubilized in methanol at 1.0 mg mL-1, and quercetin was used as a positive control (0.80 to 50.0 µg mL-1). 20.0 µL of the sample or standard were added to a 96-well microplate and serially diluted to obtain five concentrations. After this, 180.0 µL of the DPPH• solution (60.0 µM) were added. The microplate was incubated for 30 min at 25 °C in a dark environment, and the sample reading was then performed using a microplate reader (Elx800, Biotek) at a wavelength of 515 nm. The 50% scavenging capacity (SC50) value was defined as the amount of sample needed to inhibit 50% of the DPPH• radical formation. It was calculated based on the calibration curve interpolation at 50% inhibition of the DPPH• radical. All assays were performed in triplicate.
ABTS radical cation scavenging capacity
The ABTS+• scavenging capacity test consisted of measuring the discoloration of the ABTS solution using the presence of antioxidant compounds, according to the previously method described by Re et al.23 with some modifications by Ramos et al.16 Aliquot of 30.0 μL of the sample were added to 300.0 μL of the ABTS solution (absorbance of 0.70 at 750 nm). After the six-minute reaction time, the absorbance was measured using a microplate reader (Elx800, Biotek) at 750.0 nm. The test was carried out in triplicate using the Trolox standard (100 to 2,000 µM) and the results were expressed in mmol of Trolox equivalent antioxidant capacity (TEAC) per gram of sample. All assays were performed in triplicate.
Spectral data of undescribed compound
(2’R)-3-O-Methyl-5-(2’-hydroxypentyl)-resorcinol-4-O-β-glucopyranoside (citrifolin A, 1)
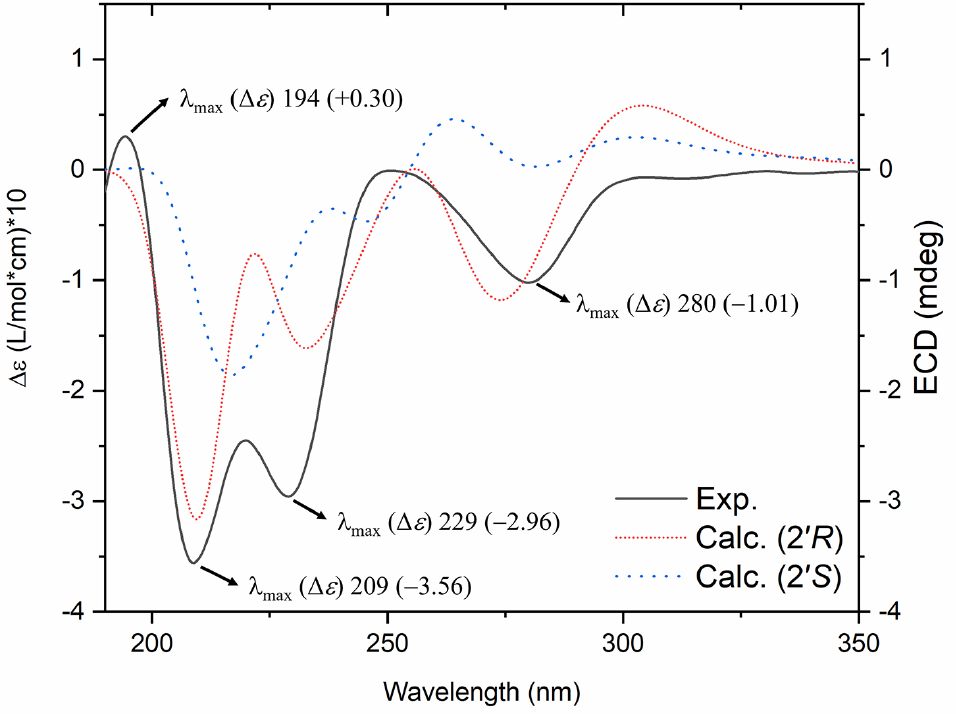
Colorless amorphous solid; UV (MeOH, 25 ºC) λmax / nm (log ε) 209 (2.11) and 281 (0.52); ECD (c 0.50, MeOH, 25 ºC) λmax / nm (Dε) 194 (+0.30), 209 (-3.56), 229 (-2.93), and 280 (-1.01); HRESIMS (-) m/z, 387.1680 [M - H]-, (calcd. for C18H27O9-, 387.1661, Dm/ztheoretical = +4.91 ppm); ESIMS/MS (-) m/z, 255 [(M - H)-162]-.
Results and Discussion
Structural determination of citrifolin A (1)
Citrifolin A was obtained as a colorless amorphous solid. It showed an [M - H]- ion at m/z 387.1680 (C18H27O9, Dm/z theoretical = +4.91 ppm), corresponding to the molecular formula C18H28O9 (Figure S3, SI section). The 13C NMR and distortionless enhancement by polarization transfer-135 (DEPT-135) spectra of citrifolin A exhibited signals characteristic of a glucopyranoside unit and a trioxygenated tetrasubstituted aromatic system, as shown in Table 1 and Figures S4 and S5 (SI section).10 Analyses of the 1H NMR and 1H-1H correlated spectroscopy (COSY) spectra of citrifolin A allowed us to identify the presence of a tetrasubstituted aromatic system by the meta coupled H-2 (d 6.35, d, J 2.8 Hz) and H-6 (d 6.24, d, J 2.8 Hz) (Figures S6-S12, SI section). The position of the aromatic system’s substituents was attributed by using HMBC correlations, where the main correlations observed for citrifolin A were between H-2 and C-1 (d 155.1), C-3 (d 153.8), C-4 (d 138.5), and C-6 (d 110.3), and H-6 with C-1, C-2 (d 99.9), and C-4 (Figures S13-14, SI section). Besides these, a correlation between H-2’ (d 3.97, m) and C-5 (d 135.6) was observed, which revealed the presence of an alkyl chain attached at C-5 (Figure S15, SI section). A detailed analysis of the 1H NMR and heteronuclear single quantum coherence (HSQC) experiments demonstrated the presence of one methyl group at C-5’ (dC 14.5, dH 0.88, t, J 7.2 Hz) and six diastereotopic hydrogens-Ha-1’ (d 2.57, dd, J 6.5 Hz, 13.4 Hz) and Hb-1’ (d 3.06, dd, J 6.5 Hz, 13.4 Hz); Ha-3’ (d 1.38, m) and Hb-3’ (d 1.49, m); and Ha-4’ (d 1.34, m) and Hb-4’ (d 1.50, m) - across three methylene carbons C-1’ (d 40.4), C-3’ (d 40.1), and C-4’ (d 20.0), respectively (Figure S16, SI section). This evidence suggests the presence of a stereocenter at C-2’ (dC 72.1, dH 3.97, t) (Figures S17-S20, SI section). In addition, the MS/MS spectrum of citrifolin A showed a fragment ion at m/z 225 (-162 Da), suggesting the presence of at least one glucosyl unit (Figure S21, SI section).24 The position of the glucose unit was attributed via the heteronuclear multiple bond correlation (HMBC) correlation between H-1’’ (d 4.79, d, J 7.5 Hz) and C-4 (d 138.5), as the chemical shift of this position showed ortho and para effects directing from the oxygen positions at C-3 and C-5. Furthermore, the position of the side chain was determined using the correlation of Ha-1’ and Hb-1’ with C-2’ (d 72.1), C-3’, and C-5, as well as Ha-3’ and Hb-3’ with C-1’, C-2’, and C-5’ (Figure 1). In addition, a methoxy group (dH 3.79, dC 56.3) was determined at C-3 (Figures S13-S16, SI section). Based on this evidence, it is possible to propose a glucosylated alkylresorcinol, which presented an alkyl β-hydroxylated unit containing five carbon atoms.10,25,26
Nuclear magnetic resonance (NMR) spectroscopic data (1H 500 MHz, 13C 125 MHz) for citrifolin A in CD3OD

Comparison between the theoretical and experimental ECD spectra allowed the determination of the absolute configuration at the C-2’ stereocenter of citrofolin A as R (Figure 2). The experimental ECD spectrum exhibits three distinct negative Cotton effects at 209, 229, and 280 nm. The theoretical ECD spectrum obtained for the diastereoisomer (2’R) reproduced a pattern very similar to that of the experimental ECD spectrum, exhibiting negative Cotton effects with similar intensities at 209, 232, and 274 nm. On the other hand, the calculated spectrum for the diastereoisomer (2’S) shows negative Cotton effects at 217 and 245 nm and a positive Cotton effect at 263 nm, deviating from the pattern presented in the experimental ECD.

Comparison between theoretical ECD spectra of the modeled stereoisomers and experimental ECD obtained for citrifolin A.
It is worth noting that for the 2’R stereoisomer, the most stable conformation presented a Boltzmann weight of 97%, while for the 2’S stereoisomer, the most stable conformation presented a Boltzmann weight of 76%. Based on this information, the Natural Transition Orbitals (NTO) transitions related to the observed negative/positive cotton effect bands in the theoretical ECD spectra of the most stable conformations for the 2’R and 2’S stereoisomers were calculated (Figures S23 and S24, SI section).
The assignment of specific molecular orbital transitions correlated to a Cotton effect band is often hindered by the complexity of canonical orbital descriptions, which involve several occupied and virtual orbitals simultaneously. In such cases, the canonical orbital picture may obscure the actual nature of a such band, since it requires disentangling multiple contributions (e.g., HOMO→LUMO, HOMO-1→LUMO+1, etc.) being HOMO: highest occupied molecular orbital and LUMO: lowest unoccupied molecular orbital, that occur with different weights. NTOs provide a more intuitive and compact representation of these excited states. Instead of describing an excitation as a combination of several orbital pairs, NTO analysis reduces it to the most significant “hole-particle” transition, obtained through unitary transformations of the occupied and virtual orbitals.27 This simplification offers a localized and chemically meaningful picture of the transition density matrix, making it easier to identify which electronic rearrangements are responsible for a given Cotton effect.
Antioxidant analysis
The DPPH and ABTS radical-scavenging assays showed that citrifolin A has low antioxidant activity, with a DPPH SC50 = 318.0 ± 1.0 µg mL-1 and an ABTS value of 724.6 ± 3.8 µmol TEAC g-1. Quercetin (positive control) displayed an SC50 = 16.5 ± 0.1 µg mL-1 under the same conditions. This limited antioxidant capacity is consistent with the presence of only one phenolic hydrogen atom in its structure.
Conclusions
Citrifolin A, an unprecedented alkylresorcinol, was isolated from the EtOH crude extract of Eugenia citrifolia leaves, representing the first chemical study of this species. Its structure was elucidated by NMR and HRMS spectroscopy, combined with ECD spectroscopy and theoretical calculations. The antioxidant activity of citrifolin A was evaluated using DPPH and ABTS assays, which revealed low antioxidant activity.
Supplementary Information
Supplementary Information
Acknowledgments
The authors are grateful to CNPq (CT-Amazônia, grant No. 408172/2013-4 and 421935/2023-5), FINEP, FAPEAM (grant No. 062.00917/2015) and CAPES (Pró-Amazônia, grant No. 3256/2013) for their financial support. The authors are also grateful to UFPR and UFAM for allowing them to use their Analytical Centers where most of their work was done, and especially thankful to NMRLab, LABCEM and LAEQ at UFAM, as well as the Pharmacy Laboratory and Department of Biochemistry and Molecular Biology at UFPR.
Data Availability Statement
The datasets generated and/or analyzed during the current study are fully available within the article and its Supplementary Information file.
References
-
1 Mazine, F.; Souza, V.; Bot. J. Linn. Soc. 2008, 158, 775. [Crossref]
» Crossref -
2 Lista de Espécies da Flora do Brasil Jardim Botânico do Rio de Janeiro. [Link] accessed in December 2025
» Link -
3 de Araújo, F.; Neri-Numa, I.; Farias, D.; da Cunha, G.; Pastore, G.; Food Res. Int. 2019, 121, 57. [Crossref]
» Crossref -
4 Oliveira, E. S. C.; Acho, L. D. R.; da Silva, B. J. P.; Morales Gamba, R. D.; Pontes, F. L. D.; do Rosário, A. S.; Bezerra, J. A.; Campos, F. R.; Barcellos, J. F. M.; Lima, E. S.; Machado, M. B.; J. Ethnopharmacol. 2022, 293, 115276. [Crossref]
» Crossref -
5 Aranha, E. S. P.; de Azevedo, S. G.; dos Reis, G. G.; Lima, E. S.; Machado, M. B.; de Vasconcellos, M. C.; Ind. Crops Prod. 2019, 141, 111736. [Crossref]
» Crossref -
6 Sardi, J.; Freires, I.; Lazarini, J.; Infante, J.; Alencar, S.; Rosalen, P.; Microb. Pathog. 2017, 105, 280. [Crossref]
» Crossref -
7 Neves, K. O. G.; Ramos, A. S.; Bruginski, E. R. D.; Souza, A. D. L.; Nunomura, R. C. S.; Campos, F. R.; Silva, F. M. A.; Machado, M. B.; Phytochem. Lett. 2021, 43, 65. [Crossref]
» Crossref -
8 Teixeira, L. L.; Bertoldi, F. C.; Lajolo, F. M.; Hassimotto, N. M. A.; J. Agric. Food Chem. 2015, 63, 5417. [Crossref]
» Crossref -
9 Oliveira, E. S. C.; Pontes, F. L. D.; Acho, L. D. R.; da Silva, B. J. P.; do Rosário, A. S.; Chaves, F. C. M.; Campos, F. R.; Bezerra, J. A.; Lima, E. S.; Machado, M. B.; Phytochem. Anal. 2024, 35, 552. [Crossref]
» Crossref -
10 Wubshet, S. G.; Brighente, I. M. C.; Moaddel, R.; Staerk, D.; J. Nat. Prod. 2015, 78, 2657. [Crossref]
» Crossref -
11 Kamal-Eldin, A.; Pouru, A.; Eliasson, C.; Åman, P.; J. Sci. Food Agric. 2001, 81, 353. [Crossref]
» Crossref -
12 Omar, R.; Li, L.; Yuan, T.; Seeram, N. P.; J. Nat. Prod. 2012, 75, 1505. [Crossref]
» Crossref -
13 Rejman, J.; Kozubek, A.; J. Agric. Food Chem. 2004, 52, 246. [Crossref]
» Crossref -
14 Andersson, U.; Dey, E.; Holm, C.; Degerman, E.; Mol. Nutr. Food Res. 2011, 55, S290. [Crossref]
» Crossref -
15 Zhu, Y.; Soroka, D.; Sang, S. J.; Agric. Food Chem. 2012, 60, 8624. [Crossref]
» Crossref -
16 Ramos, A. S.; Mar, J. M.; da Silva, L. S.; Acho, L. D. R.; Silva, B. J. P.; Lima, E. S.; Campelo, P. H.; Sanches, E. A.; de Araujo Bezerra, J.; Chaves, F. C. M.; Campos, F. R.; Machado, M. B.; Food Res. Int. 2019, 123, 674. [Crossref]
» Crossref -
17 Neves, K. O. G.; Silva, S. O.; Cruz, M. S.; Mar, J. M.; Bezerra, J. A.; Sanches, E. A.; Cassani, N. M.; Antoniucci, G. A.; Jardim, A. C.; Chaves, F. C. M.; Acho, L. D. R.; Lima, E. S.; Machado, M. B.; Santos, A. D. C.; Molecules 2025, 30, 713. [Crossref]
» Crossref -
18 Hanwell, M. D.; Curtis, D. E.; Lonie, D. C.; Vandermeersch, T.; Zurek, E.; Hutchison, G. R.; J. Cheminform. 2012, 4, 17. [Crossref]
» Crossref - 19 Frisch, M. J.; Trucks, G. W.; Schlegel, H. B.; Scuseria, G. E.; Robb, M. A.; Cheeseman, J. R.; Scalmani, G.; Barone, V.; Petersson, G. A.; Nakatsuji, H.; Li, X.; Caricato, M.; Marenich, A. V.; Bloino, J.; Janesko, B. G.; Gomperts, R.; Mennucci, B.; Hratchian, H. P.; Ortiz, J. V.; Izmaylov, A. F.; Sonnenberg, J. L.; Williams-Young, D.; Ding, F.; Lipparini, F.; Egidi, F.; Goings, J.; Peng, B.; Petrone, A.; Henderson, T.; Ranasinghe, D.; Zakrzewski, V. G.; Gao, J.; Rega, N.; Zheng, G.; Liang, W.; Hada, M.; Ehara, M.; Toyota, K.; Fukuda, R.; Hasegawa, J.; Ishida, M.; Nakajima, T.; Honda, Y.; Kitao, O.; Nakai, H.; Vreven, T.; Throssell, K.; Montgomery Jr., J. A.; Peralta, J. E.; Ogliaro, F.; Bearpark, M. J.; Heyd, J. J.; Brothers, E. N.; Kudin, K. N.; Staroverov, V. N.; Keith, T. A.; Kobayashi, R.; Normand, J.; Raghavachari, K.; Rendell, A. P.; Burant, J. C.; Iyengar, S. S.; Tomasi, J.; Cossi, M.; Millam, J. M.; Klene, M.; Adamo, C.; Cammi, R.; Ochterski, J. W.; Martin, R. L.; Morokuma, K.; Farkas, O.; Foresman, J. B.; Fox, D. J.; Gaussian 09W, Gaussian, Inc., Wallingford CT, 2016.
-
20 Nugroho, A. E.; Morita, H.; J. Nat. Med. 2014, 68, 1. [Crossref]
» Crossref -
21 Marenich, A. V.; Cramer, C. J.; Truhlar, D. G.; J. Phys. Chem. B 2009, 113, 6378. [Crossref]
» Crossref -
22 Molyneux, P.; Songklanakarin J. Sci. Technol. 2004, 26, 211. [Link] accessed in December 2025
» Link -
23 Re, R.; Pellegrini, N.; Proteggente, A.; Pannala, A.; Yang, M.; Rice-Evans, C.; Free Radicals Biol. Med. 1999, 26, 1231. [Crossref]
» Crossref -
24 Santos, C. L. G.; Angolini, C. F. F.; Neves, K. O. G.; Costa, E. V.; de Souza, A. D. L.; Pinheiro, M. L. B.; Koolen, H. H. F.; da Silva, F. M. A.; Rapid Commun. Mass Spectrom. 2020, 34, e8683. [Crossref]
» Crossref -
25 Barrero, A. F.; Herrador, M. M.; Arteaga, P.; Rodríguez-García, I.; García-Moreno, M.; J. Nat. Prod. 1997, 60, 65. [Crossref]
» Crossref -
26 Martins, T. P.; Rouger, C.; Glasser, N. R.; Freitas, S.; de Fraissinette, N. B.; Balskus, E. P.; Tasdemir, D.; Leão, P. N.; Nat. Prod. Rep. 2019, 36, 1437. [Crossref]
» Crossref -
27 Martin, R. L.; J. Chem. Phys. 2003, 118, 4775. [Crossref]
» Crossref
Edited by
-
Editor handled this article:
Hector Henrique F. Koolen (Associate)