The Control of the Adsorption of Doxorubicin on Gold Surfaces Tracked by Surface-Enhanced Raman Scattering Spectroscopy
Abstract
Doxorubicin (DOX) is a drug used in the treatment of several neoplasms, but known for strong side effects, including dysfunctions in heart, bone marrow and liver. These effects have been overcome through its use in drug delivery systems, as gold nanoparticles (AuNP). Seeking to understand such complex interactions, surface-enhanced Raman scattering (SERS) spectroscopy was used to study the control of the adsorption of DOX on Au surfaces provided by chemical modifications with chloride ions and 2-mercaptoethanol (ME). The optimal adsorption kinetics was determined by UV-Vis-NIR spectroscopy to preclude aggregation processes and to maximize the localized surface plasmon resonance (LSPR) with the excitation lines for SERS analysis. The vibrational assignment of Raman and SERS spectra were done with the support of Density Functional Theory (DFT) calculation, allowing the proposition of adsorption geometries of the drug on the metallic surfaces.
Keywords:
plasmonic; quantum calculation; cancer; adsorption control; nanodevice
Introduction
Cancer is the ordinary denomination given to the set of diseases characterized by the fast disordered growth of cells, demanding a lot of energy, nutrients and oxygen, resulting in highly vascularized tissues,1,2 which lead to the formation of very aggressive tumors. There is a search for new chemical3 and biochemical4,5 strategies to improve efficiency of existent drugs, as for instance the use of nanodevices to the delivery of antineoplastic drugs to minimize side effects.6 The antineoplastic agents doxorubicin (DOX) is widely used, since it has a potent action against many different types of cancer, such as osteosarcoma,7 hepatocellular carcinoma8 and myeloma.9 However, the potential of DOX as an effective antineoplastic drug comes with high affectation of heath tissues, resulting in high cytotoxic, neurotoxic and cardiotoxic effects.10,11 Such may lead to chronic irreversible cardiotoxicity,12 among others, resulting in potentially lethal heart failure and stroke. Seeking to overcome such unwilling effects, DOX was applied with various methods of encapsulation,9,13-15 such as liposomes,16-19 polymeric micelles20-23 and exosomes,24-26 as well as drug delivery system to improve the specificity for tumors.27,28
Functionalized metallic nanoparticles have been used to deliver drugs, since they exhibit unique surface chemistry and biological features,29 as coadsorption of tissue recognizer, increasing the bioavailability in the target tissue and reducing unwanted side effects.30 Particularly, gold nanoparticles (AuNP) present relevant optical properties, besides low toxicity to health tissues.31 AuNP have electronic transitions, named localized surface plasmon resonance (LSPR), which generates a huge increase in the intensity of the electric field near the particle.32 This feature is the base of surface-enhanced Raman scattering (SERS), a crucial effect to understand the rich surface chemistry of AuNP through the study of adsorbed molecules.33 SERS spectral patterns allow that gold nanodevices for drug delivery could be built with understanding and control of interactions in the drug adsorption.31 SERS spectroscopy is based on the giant signal enhancement by electromagnetic mechanism, due to the resonance of LSPR transition with laser excitation.34 In addition, the named chemical effect lead to the vibrational signature of the surface complex formed in the adsorption,35 which is an outstanding way to study interactions from molecular adsorbates and metallic surfaces.
The surface chemistry of AuNP allows passive delivery routes,14 due to the neoangiogenesis. with the enhancement of bioavailability of therapeutic drugs in the tumor,36 even active route, based on the adsorption of conjugated ligands, acting as tissue recognizer.30,37 Even though several studies involving SERS characterization of DOX on Au surfaces are published,38,39 the analyses of chemical interactions of DOX in the metallic surface are rare. The background involving this problem is the influence of resonance Raman (RR) effects in spectral profiles, when recorded with visible exciting radiation, due to its proximity with electronic transitions of DOX. Such SERS profiles preclude the analysis of changes in the intensity or wavenumbers due to the chemical effect and the correlation with adsorption geometry,40 since it is dominated by features coupled with electronic transitions.41
In the present work, the adsorption of the antineoplastic drug DOX on AuNP surfaces were characterized by means of Raman and SERS spectroscopies using different exciting radiations and surface modifiers. The characterization of adsorption geometries of DOX adsorbed on AuNP was carried out in the presence and absence of chloride ions (Cl-) and 2-mercaptoethanol (ME) through SERS spectroscopy. Density Functional Theory (DFT) calculations were used to enable the conclusive assignment of the vibrational modes of this molecule, allowing to characterize different anchorage sites. Such an approach was only possible by comparing different spectral patterns through the record of SERS spectra in the presence and absence of RR conditions. Adsorption kinetics on AuNP surfaces, with the control over aggregation processes, were gathered with distinct surface modifiers and investigated by UV-Vis-NIR spectroscopy.
Experimental
Materials and equipment
Doxorubicin hydrochloride (DOX, 98.9%), tetrachloroauric(III) acid trihydrate (HAuCl4, 99.995%), sodium borohydride (NaBH4, ≥ 99%) trisodium citrate dihydrate (≥ 99%), 2-mercaptoethanol (ME, ≥ 99.0%), potassium chloride (KCl, 99.0-100.5%) and chloridric acid (HCl, ≥ 37.0%) were purchased from Sigma-Aldrich and all of them were used with no further purification. All glassware, including glass coverslips, was cleaned by bathing in aqua regia, followed by copious washing with deionized water. All solutions were used freshly prepared, with Milli-Q water (18.2 MΩ cm resistivity at 25 °C).
UV-Vis-NIR spectra were recorded with an Ocean Optics USB 2000+XR1-ES spectrometer (Dunedin, FL 34698, USA) equipped with a radiation source. All spectra were collected in quartz cuvettes, with an optical pathlength of 0.5 cm. Raman and SERS spectra were recorded in two spectrometers: a Bruker FT-Raman RFS 100 spectrometer (Ettlingen, Germany), equipped with a Ge detector cooled with liquid nitrogen and Nd:YAG laser with wavelength at 1064 nm; spectra were gathered using aluminum sample holders for solid DOX, with 300 mW laser power and quartz cuvette as support for suspensions in SERS spectra, with 1000 mW laser power; Raman and SERS spectra were also recorded in a dispersive Senterra-Bruker spectrometer (Ettlingen, Germany), equipped with a coupled charge device (CCD) detector, coupled to an Olympus optical microscope model BX51 (Tokyo, Japan) and exciting laser lines with wavelength at 632.8 nm, from a He/Ne laser from Coherent and at 785 nm from a diode system. The Raman spectrum of DOX in solid state, by using 785 nm excitation was recorded with 25 mW. When 632.8 nm exciting radiation was used, the resonance Raman spectrum of DOX was recorded with 20 mW, while SERS spectra were recorded focusing directly on dried film or on the surface of aqueous suspension with 5 mW laser power. The dried film deposited by drop casting over previously cleaned glass coverslips was used to obtain SERS spectra through the record of 100 spectra by using Raman mapping tool and the present result is an average of all them as described in Figures S1 and S2 (Supplementary Information (SI) section), after baseline correction. SERS spectra were obtained from the mixture of DOX solution and AuNP suspension 1:9 (v/v), with final concentration at 1.0 × 10⁻⁵ mol L-1, while RR spectrum was collected from 1.0 × 10⁻³ mol L-1 aqueous solution, that is below 2.1 × 10⁻³ mol L-1 aqueous solubility of DOX.
Size distribution of AuNP in colloidal aqueous samples were obtained from dynamic light scattering (DLS) measurements based on correlation spectroscopy, recorded in a Malvern DLS Zeta-Sizer Nano-ZS90 spectrometer (Malvern, United Kingdom). Freshly prepared AuNP size distributions based on intensities were gathered using disposable polyethylene cuvettes previously washed in a 10% aqua regia bath.
Synthesis of AuNP
Gold colloidal aqueous suspensions were carried out by the method described by Creighton et al.,42 which consists in the reduction of tetrachloroauric(III) acid aqueous solution (2.5 × 10⁻³ mol L-1, 10 mL) by the slow dropwise addition of sodium borohydride aqueous solution (1.0 × 10⁻³ mol L-1, 30 mL) in ice bath. The appearance of a wine-red color indicated the formation of AuNP, being this color a strong characteristic of the LSPR transition for subwavelength sized nanoparticles. Following, 300 µL of 1% m trisodium citrate were added dropwise,43 and the colloidal suspension was stored under refrigeration.
Computational details
DOX properties were obtained by means of computational methods, using quantum mechanical models of DOX and Au-DOX complexes. Static properties were obtained by DFT calculations using Becke-3-parameter-Lee-Young-Parr hybrid functional, B3LYP,44 and split-valence double-zeta Pople’s basis sets with the addition of polarizing and diffuse functions, 6-31+G(d,p),45 chosen to represent non-metallic atoms. Metallic clusters were modeled by using the Los Alamos LANL2DZ46 basis set, used to optimize structures of dimers with two Au atoms (Au2), DOX-Au2 complexes, clusters with six Au atoms (Au6) and the DOX-Au6 complex, seeking to avail thermodynamic properties, wave function analysis and topological parameters. Time-dependent density functional theory (TD-DFT) were also utilized to avail theoretical UV-Vis spectra, oscillators strengths and natural transition orbitals linked to the fundamental transitions of DOX. Cartesian coordinates for the equilibrium structure of DOX and DOX-Au6 complexes are shown in Tables S2 and S3 (SI section). All quantum mechanical calculations were performed by using the Linux version of Gaussian 09 package (revision D.01),47 considering standard convergence criteria previously configured in the software.
Results and Discussion
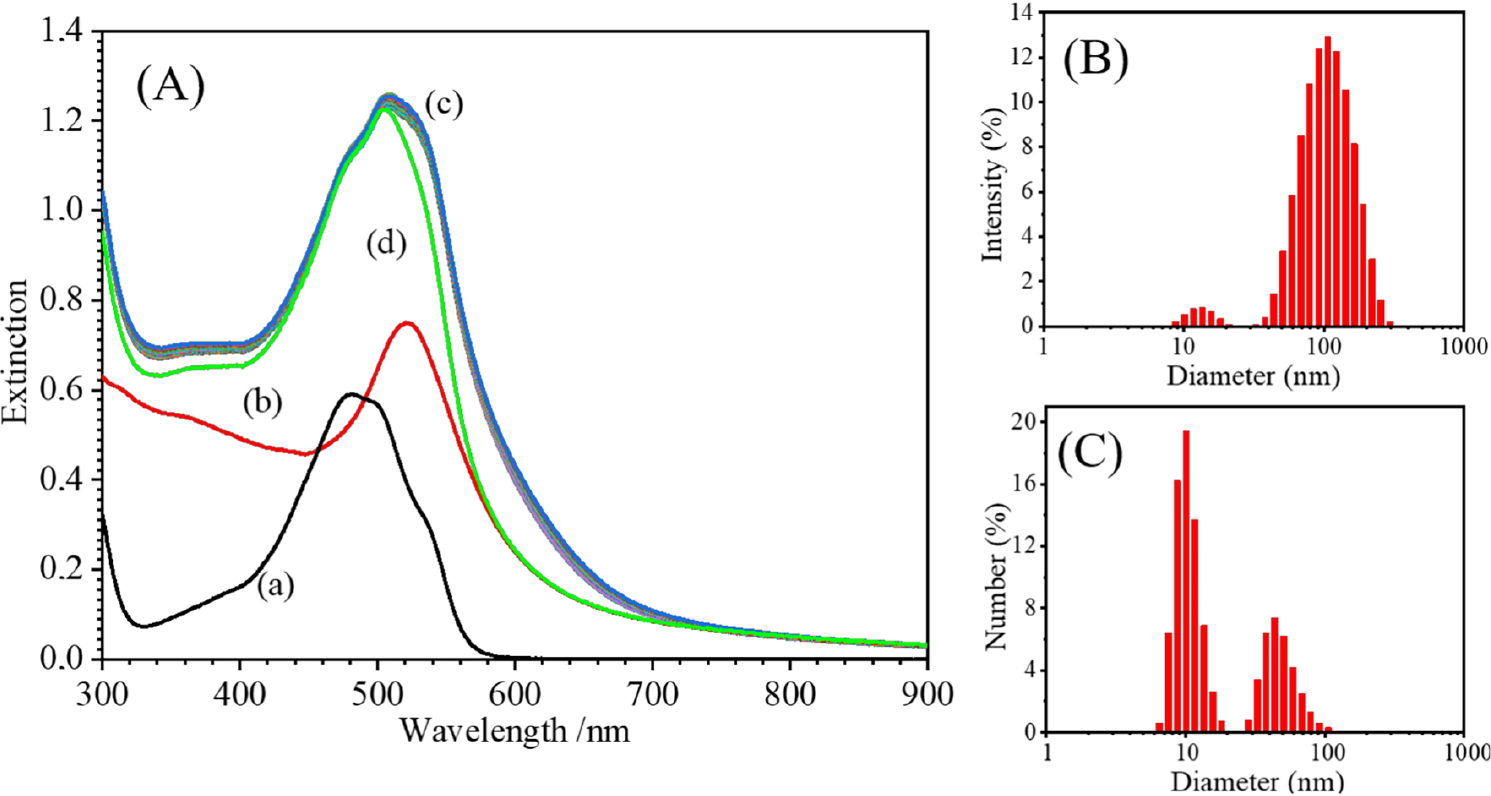
Figure 1A shows the UV-Vis-NIR extinction spectra of an aqueous solution of DOX, an aqueous suspension of AuNP and the corresponding sum of both spectra. In addition, a set of ten spectra recorded for the period of one hour, are presented to follow the aggregation kinetics of AuNP during the adsorption of DOX. The DOX solution has a clear orange reddish color, correlated with its absorption spectrum with maximum at ca. 480 nm, which is assigned to the fundamental transitions from higher occupied molecular orbital (HOMO) to lower unoccupied molecular orbital (LUMO), assigned to the strong π→π* transition.48,49 Both HOMO and LUMO orbitals are centered almost entirely over the anthraquinone portion, evidencing the relevance of this electronic chromophore group in the signal. Theoretical calculations of HOMO and LUMO orbitals and the corresponding simulated electronic spectra are in agreement with such results and can be found in Figure S3 (SI section). The comparison of the kinetic curves (Figure 1Ac) with the summation (Figure 1Ad), shows a significant broadening occurring from 520 to 700 nm wavelength region, indicating that, without previous use of surface modifier, interactions between DOX and as-synthesized AuNP can be observed. However, no significant changes occurred in the LSPR pattern during one hour of kinetics, indicating that equilibrium conditions and stabilization are promptly verified. The measurement of zeta potential of AuNP surfaces before and after the addition of DOX were done and the values at ca. -33.6 and 3.3 mV, respectively, indicate the adsorption takes place on Au surfaces. The size distributions of AuNP suspension without surface modification, against scattered light intensity is showed in Figure 1B, and against number of particles in Figure 1C. Such results indicate the formation of a bimodal distribution, with large number of smaller particles with medium diameter at 10 nm and presenting low scattering intensities, followed by a larger distribution, centered at 60 nm, corresponding to greater AuNP whit high scattering intensities, even though they have smaller number of particles.

(A) UV-Vis-NIR spectra of (a) DOX 1.0 × 10⁻⁴ mol L-1 aqueous solution; (b) AuNP aqueous suspension; (c) adsorption kinetic of DOX 1.0 × 10⁻⁴ mol L-1 on AuNP (ten overlapped spectra taken during 1 h); (d) sum of “a” and “b” spectra. Size distributions of unmodified AuNP against (B) scattered light intensity and (C) number of particles.
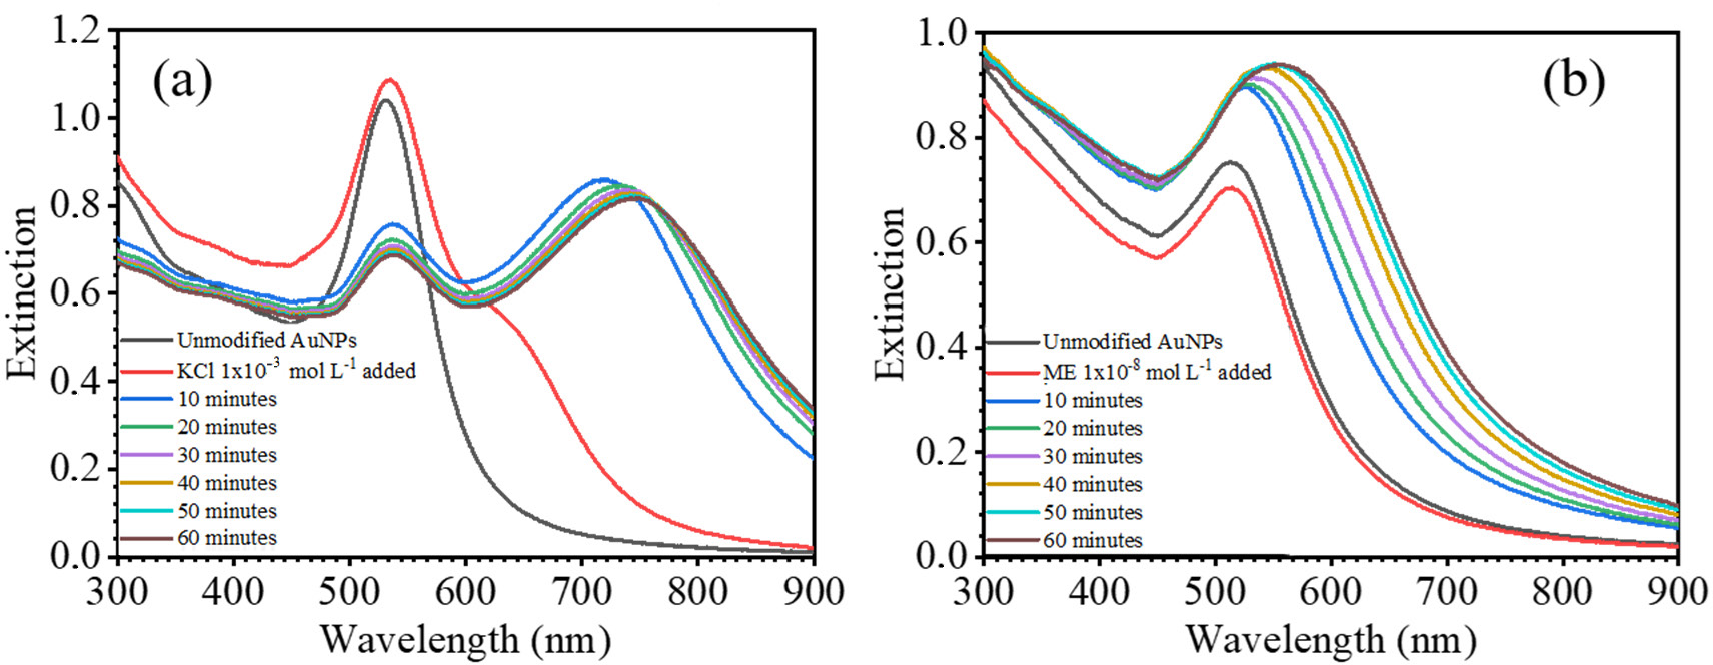
Figure 2 shows the extinction spectra of AuNP obtained before and after the addition of surface modifiers, KCl (9:1 v/v, respectively, final concentration 1.0 × 10⁻³ mol L-1) and ME (9:1 v/v, respectively, final concentration 1.0 × 10⁻⁸ mol L-1). The spectra show, in both cases, chosen concentrations conducted to obtain an optimal adsorption kinetics, leading to the formation of plasmon-coupled AuNP clusters, mediated by surface modifiers. The presence of greater metallic clusters, with LSPR transitions in near infrared region, which can be considered potential hot spots, favors the record of SERS spectra through the use of near infrared laser lines, such as 785 and 1064 nm. The addition of KCl (Figure 2a) led to the quick formation of a broad extinction band centered at ca. 750 nm in ten min, but relatively stable over the period of one hour. The presence of these clusters is related to the consumption of the small particles, which contributes to the decrease of extinction signal at ca. 530 nm. On the other hand, the addition of ME (Figure 2b) induced the formation of smaller metallic clusters, since LSPR band has the maximum around 550 600 nm, blue-shifted in comparison with KCl modification, but with an adsorption kinetic far from the equilibrium conditions, after one hour. A constant shift to high wavelengths can be observed, with the broadening of the LSPR band. The control of aggregation conditions of AuNP suspension through such surface modifications allowed the record of SERS spectra, in the best resonance with LSPR transitions, with red and near infrared exciting radiations, as presented below.
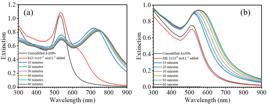
UV-Vis-NIR spectra from aggregation kinetics of AuNP, after addition of (a) KCl aqueous solution at 1.0 × 10⁻³ mol L-1 final concentration; (b) ME ethanolic solution at 1.0 × 10⁻⁸ mol L-1 final concentration.
Figure 3 shows the molecular structure of DOX and in this scheme, the sugar moiety (SM), anthraquinone portion (AP), and side chain (SC) were highlighted for the correct description of vibration modes. It is also presented optimized geometries of both the isolated molecule and in the presence of a six gold atoms cluster (Au6), obtained by DFT calculations. Both optimized conformations were obtained with DOX as hydrochloride species. This structure is suited to best preserve the molecular environment by maintaining the electrostatic nature of the interaction between the chloride anion and the methyl-ammonium cation in the SM. The electrostatic potential charge surface is also shown, highlighting negative charges in red in the carbonyl moieties, from side chain and ring II and chloride contra-ion, which are potential adsorption sites for interacting with locally-induced positive charges in metallic surfaces. Here, it can be emphasized that the preservation of chloride ion in this theoretical structure is important, since the use of KCl as surface modifier may induces the adsorption of DOX through ion-pair interactions. It is in agreement with the preservation of the protonation of amine group, which only lost the proton in basic pH, since the pKa value of amine group is ca. 8.2.50 The presence of the chloride anion also conserved the singlet state spin multiplicity and charge neutrality desirable to run ground-state restricted-DFT calculations. The existence of substituents in AP, as well as the presence of side chains and SM implies the possibility of coexistence of multiple conformers when in solutions. However, the lowest energy conformers are ones characterized by two internal hydrogen bonds between the oxygen atoms in ring II and the hydrogen atoms on the phenolic substituents in ring III, in a quasi-aromatic structure known to drain electron density from the AP, resulting in a less π-localized state, although stabilizing the new 5-ring species by resonance.49,51
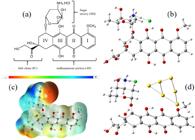
(a) Molecular structure of DOX, indicating the anthraquinone portion (AP), I, II, III and IV rings, side chain (SC) and sugar moiety (SM); (b) optimized DOX geometry and (c) its electrostatic potential surface at B3LYP/6-31+G(d,p) level of theory; (d) optimized geometry of DOX interacting with Au6 cluster at B3LYP/6-31+G(d,p)/LanL2DZ level of theory.
Since this topology directly affects the electronic environment of the main chromophore group, optimized DOX geometries were obtained and are shown in Figure 3b by considering these relative positions, although no other constraints were made for the geometry (Table S2, SI section). Potential electronic surface (PES) shows, in Figure 3c, that despite the centralization of electronic density over the hydrochloride on the SM, the AP holds electronic density over almost the entirety of the structure. The negatively charged structure is the same observed for the electronic chromophore group pointed out by the singlet states HOMO-LUMO transition (Figure S3 inset, SI section). To evaluate the position best suited to study the interaction between the drug and the metallic surface, seven possible doxorubicin hydrochloride (DOXH-Cl) adsorption sites were probed by the geometry optimization and thermodynamic calculation of a DOXH-Cl-Au2 dimer complex (Figure S7, SI section). The calculation was repeat involving Au2 with both neutral DOX and protonated species DOXH in the absence of chloride ion (Figure S8, SI section). The best position for adsorption over DOXH-Cl (Figure S9, SI section), a dihedral plane between the AP and the SM, comprised not only AP electronic but also a chloride anion interaction, preserving the AP structure but bending the sugar over the dimer. However, these calculations also suggested that the adsorption site is not thermodynamically (∆G > 0) although thermally favorable (∆H > 0) (Table S1, SI section). Calculations involving neutral DOX and DOXH-Au2, although thermodinamically favorable, (Figures S8 and S9, SI section) are not probably present on AuNP surfaces here used. Neutral species is only formed in solution at basic pH51 and the presence of chloride adsorbed on the metallic surface is very probable due to its high affinity for gold surface, since the solution was prepared from DOX hydrochloride species and the presence of KCl exacerbated chloride adsorption.
The adsorption of a cluster composed of six gold atoms arranged on a triangular aspect, Au6, was studied by the optimization and frequencies calculation of DOX with this cluster positioned at the site probed early (Figure 3d). This cluster was chosen to preserve the singlet multiplicity state for Au0, to simulate border effects on the atoms of the edge of the cluster and the homogeneous electronic distribution on its center. Such a small cluster may better represent defects, edges and gold atoms with lower coordination number, which are chemically favorable to adsorption.31 In this case, board effect is desired, since can be more representative of the experimental conditions. The resulting structure seems to preserve the AP conformation as well as the position of hydrogens on ring III. Differences, however, are spotted in the orientation of the oxygen atoms on SC, oriented through the position of the cluster, and on the conformation of the SM, as the nature of the interaction is probably guided by the electrostatic potential between this portion of the molecule and the chloride anion interacting with Au6. From optimized geometries the vibrational frequencies were calculated and used for the assignment of Raman and SERS spectra. It is noteworthy that ME was not included in the theoretical model, in coadsorption with DOX once that even though possess high affinity by gold surface, may have several possibilities of interaction, via hydrogen bond, with DOX. Such set of possibilities difficult the calculation convergence and preclude the simple correlation with the diversity of possible conformers on gold surfaces.
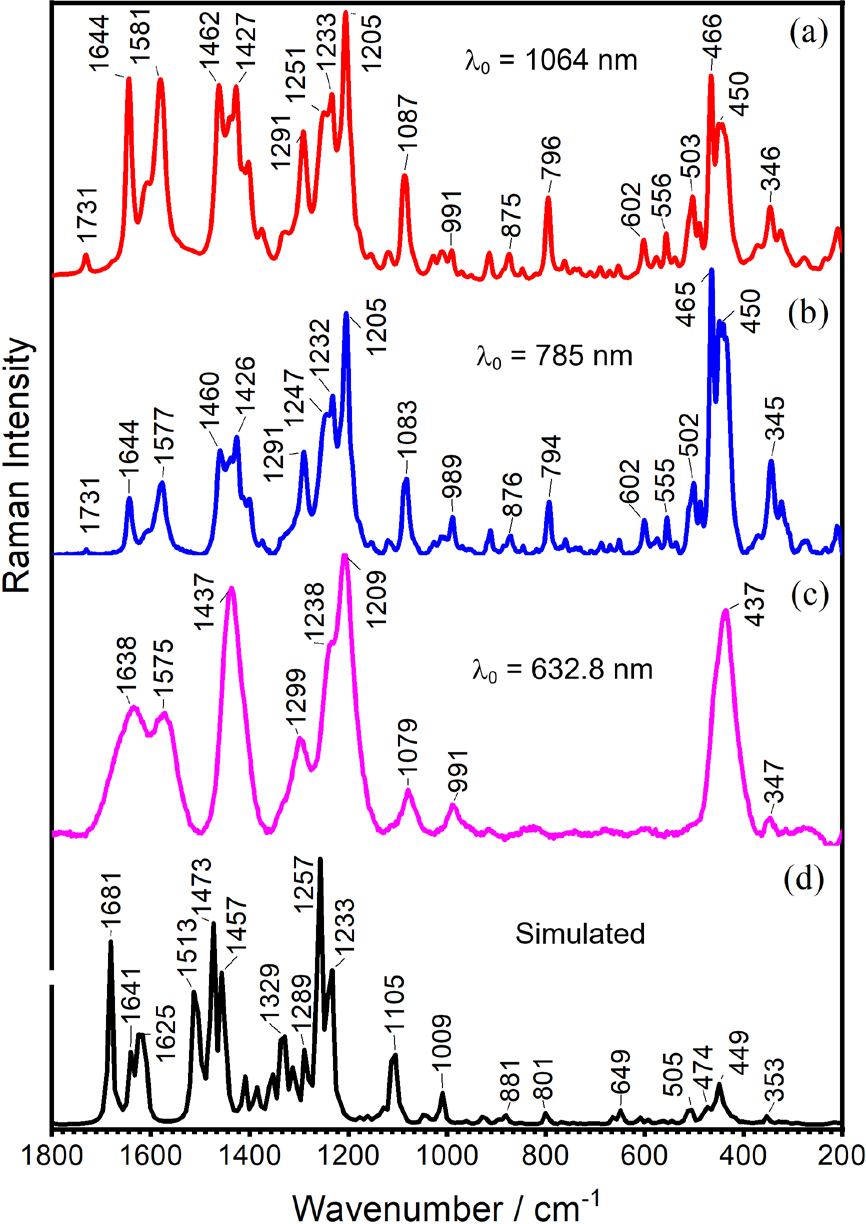
Figure 4 shows the Raman spectra of DOX in solid state by using excitation lines at 1064 nm (Figure 4a) and 785 nm (Figure 4b), as well as from 1 × 10⁻³ mol L-1 aqueous solution by using 632.8 nm (Figure 4c). For comparison, the theoretical Raman spectra obtained with the B3LYP/6 31+g(d,p) method is presented (Figure 4d). The Raman spectrum of DOX in solid state by using 632.8 nm exciting radiation could not be obtained, since a strong emission background did not allow its record. This phenomenon is due to the influence of RR effect that is observed by the proximity of electronic transition with the laser line (Figure 1a). However, the Raman spectrum of DOX in aqueous solution 1.0 × 10⁻³ mol L-1 have been recorded with this 632.8 nm laser line, since in this concentration the enhancement due to RR effect was greater than the influence of fluorescence signal (Figure 4c). This spectrum shows broad bands at 1638, 1575, 1437, 1238, 1209 and 437 cm-1, often with the presence of shoulders, which are assigned to normal modes in which vibrations from AP is always present. Such a proposition allows to correlate enhanced features with vibrational modes that are coupled to the electronic transitions. Even though the excitation line is not in the interval of electronic band in visible region, the enhancement of Raman bands, assigned to vibrational modes from the chromophore moiety, allow to consider RR effect is present.40,41 This spectral pattern shows broad and convoluted features, which can be associated with the solvation of DOX, since the formation of hydrogen bonds of water with available oxygen atoms can lead to a large number of local environments.
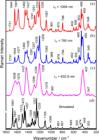
Raman spectra of DOX in solid state, by using (a) 1064 nm and (b) 785 nm laser lines; (c) RR spectrum of DOX in 1.0 × 10⁻³ mol L-1 aqueous solution, excited in 632.8 nm; (d) simulated Raman spectrum of DOX.
Raman spectral patterns are very different when near infrared laser lines are used. Searching for a justification to this behavior, it is noteworthy the band at 796 cm-1, which has significant intensity in the Raman spectrum obtained with 1064 nm laser line, loses relative intensity as the wavelength of laser lines decreases, almost disappearing with 632.8 nm laser line. This can be assumed as indicative that such a feature is not enhanced by RR effect. For this reason, this vibrational mode can be considered not coupled with the chromophore electronic transition and this band can be used as a good internal reference for monitoring the enhancement of features under influence of the RR effect. In this way, the relative intensities of bands from 1800 to 1000 cm-1, as well as from 500 to 400 cm-1 decrease, in relation to 796 cm-1, with increasing wavelength of exciting radiation. It is indicative that the RR effect is the responsible for the enhancement of such bands, assigned to normal modes involving AP vibrations, which is, as discussed before, the main chromophore site in the electronic transition observed at ca. 500 nm (Figure 1a). When the Raman spectrum is carried with 785 nm exciting radiation, an intermediate spectral pattern among 632.8 and 1064 nm was observed. By using 1064 nm excitation, important changes in relative intensities are observed, indicating only with such a laser line the RR effect can be disregarded. These results indicate that such a laser line is the most suitable for the study of adsorption conformation on metallic surfaces via SERS spectroscopy.
Most pronounced bands in Raman spectrum of DOX, when 1064 nm was used, are observed at 1644, 1581, 1462, 1427, 1291, 1251, 1233, 1205, 1087 and 796 cm-1, which are ascribed to vibrations involving the AP, as summarized in Table 1. Even though with this excitation, the RR effect can be disregarded, AP vibrations are still very important in the composition of molecular polarizability. The band observed at 1251, 1233 and 1205 cm-1, are assigned to vibrational modes combining CC stretching from AP, the latter being the most intense band observed in this Raman spectrum. Bands at 1644, 1581 and 1462 cm-1, also strongly pronounced, are assigned to modes combining C=C and C=O stretching of AP. The also intense band at 1427 cm-1 is ascribed to a mode involving several vibrational coordinates, been the most important CH3 bending from methoxy and C=C stretching from AP. The band at 1291 cm-1 can be assigned to a mode involving C=C stretching combined with CH, OH and NH bending. The band at ca. 1087 cm-1 is ascribed to the CC stretching from AP, combined with strong CO stretching from methoxy and SC. The feature at 796 cm-1 is assigned to a vibrational mode composed mainly by out-of-plane bending of AP and CC stretching from SM. A strong feature can also be observed at ca. 466 cm-1, with a halved intensity band at ca. 450 cm-1. The first is mainly ascribed to CC stretching from AP, while the latter is from out-of-plane bending from AP.
Tentative assignment of Raman and SERS bands present in the spectra of DOX and corresponding calculated frequencies
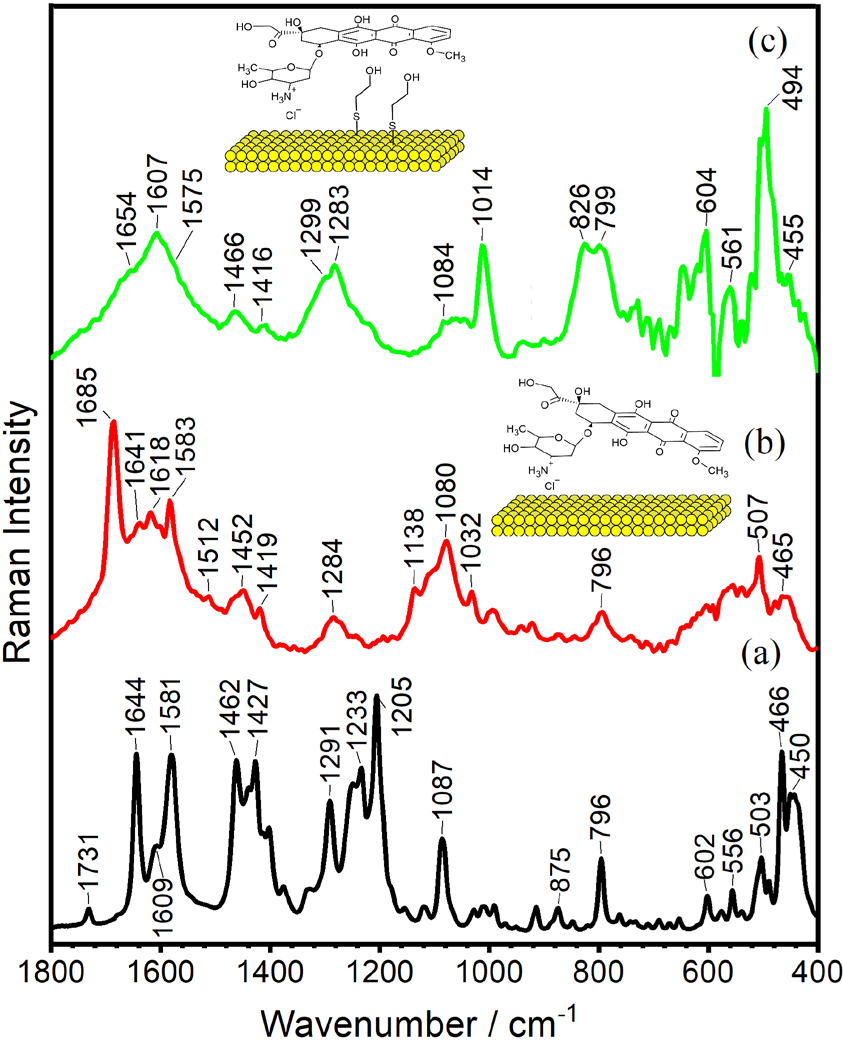
SERS spectra of DOX were obtained out of resonance condition, by using 1064 nm excitation, with AuNP modified with KCl and ME, as presented in Figure 5, which also present the Raman spectrum of DOX in solid state for comparison. The pH of AuNP suspension is ca. 6.0, while the pKa value of amine group from DOX is ca. 8.2.50,52 This indicates in SERS experiments the protonated amine is the predominant species in solution and it is possible that the ammonium cation is involved in the adsorption through ionic pair with chloride anion, which is in bridge with the metallic surface. The enhanced bands at 1583, 1419 and 1138 cm-1, assigned to NH bending and CN stretching of ammonium group, reinforce this assumption. However, enhanced bands at 1452, 1419, 1138 and 1080 cm-1, which are also assignment to modes involving methoxy moiety, allow inferring this group is near to gold surface. The calculated structure from DOX and Au6 cluster indicated this molecule may adsorbs through two molecular sites (Figures 3d and S10, SI section), and both ammonium and methoxy groups have particular affinity by the gold surface. More intense SERS bands at 1685, 1641, 1618, 1080 and 507 cm-1, assigned to AP vibrations allow proposing the molecular plane of AP can be tilted to the metallic surface, with such vibrational modes having a perpendicular component, with such enhancement been due to the surface selection rules.53 In the presence of ME surface modifier, SERS spectral pattern changes considerably, indicating other adsorption geometry, probably involving hydrogen bonds, is present. In comparison with the later result, the presence of bands at 1575, 1419, 1299 and 1014 cm-1, assigned to modes composed by NH bending and CN stretching, as well as 1466, 1416, 1084 and 1014 cm-1, involving methoxy group in the assigned modes, allow inferring both ammonium and methoxy are again anchor sites in the adsorption interactions. However, the significant changes in relative intensities of these features, as well as the presence of enhanced bands at 826 and 799 cm-1, assigned to modes involving out-of-plane vibrations from AP, indicate this moiety is tending to a parallel geometry on the gold surface. In this case, out-of-plane modes are intensified by surface selection rules,53 since they have perpendicular component in relation to the metallic surface. It is noteworthy that such assumptions are from a submonolayer model for the coverage of DOX on gold surfaces, since the stability of colloidal suspension, after the addition of DOX was always present.
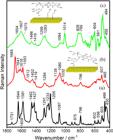
(a) Raman spectra of DOX in solid state; SERS spectra of DOX 1.0 × 10⁻⁵ mol L-1 on AuNP surface, in aqueous suspensions (b) modified with KCl 1.0 × 10⁻³ mol L-1 and (c) modified with ME 1.0 × 10⁻⁸ mol L-1. All Raman and SERS spectra exciting with λ0 = 1064 nm. Insert: schematic representations of adsorption geometries of DOX on AuNP surfaces, for each SERS pattern.
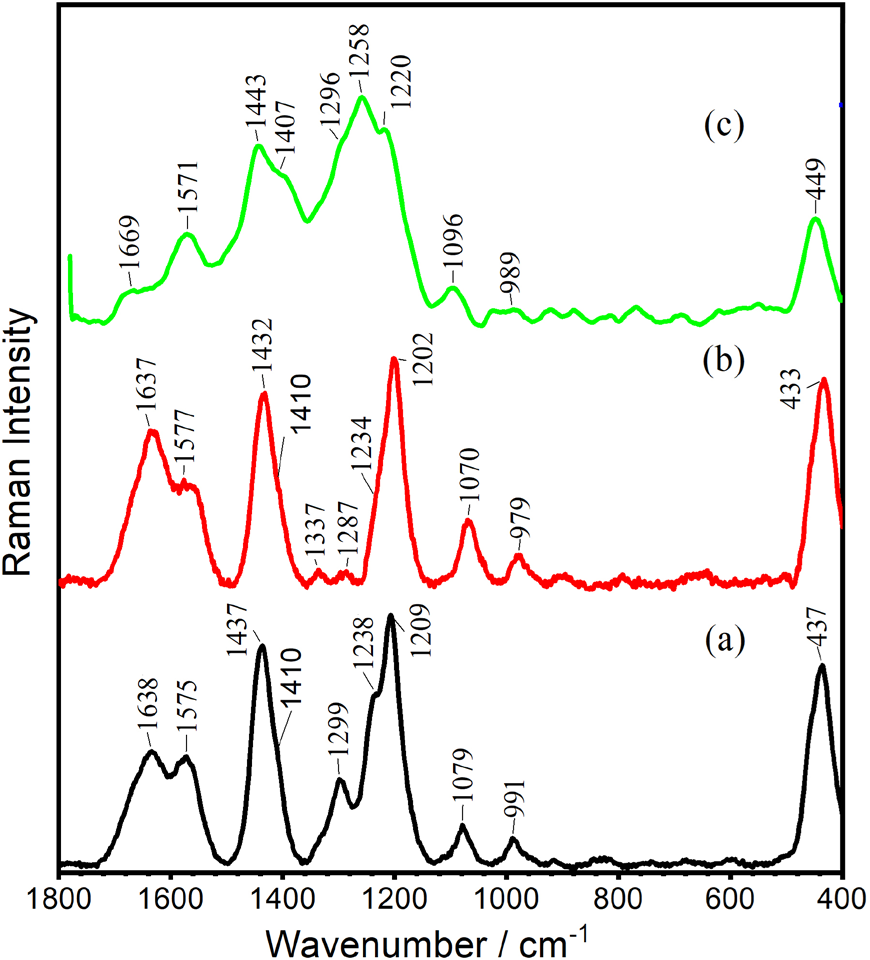
Figure 6 presents the spectra recorded by using 632.8 nm exciting radiation. Figure 6a shows RR spectrum of DOX in solution and its surface-enhanced resonance Raman scattering (SERRS) spectrum, in suspension, is presented in Figure 6b. Such spectral patterns are very similar, with some shifts and changes in relative intensities, indicating RR effect precludes the completed correlation among SERRS spectral pattern and adsorption geometry. Even though RR effect prevails over adsorption influences, all intensified features were shifted, indicating that surface interactions occurred in the adsorption process. The enhancement of the band at 1637 cm-1, assigned to a mode from AP vibrations, indicates such moiety is involved in the adsorption interactions, as concluded previously.
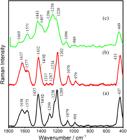
(a) RR spectra of DOX in 1.0 × 10⁻³ mol L-1 aqueous solution; SERRS spectra of DOX 1.0 × 10⁻⁵ mol L-1 on AuNP surface, modified with KCl 1.0 × 10⁻³ mol L-1 (b) in suspension and (c) as dried film (average spectrum, see Figure S1). All Raman and SERRS spectra excited with λ0 = 632.8 nm.
Figure 6c shows the average SERRS spectra of DOX when the suspension containing AuNP modified with KCl was dried to form a film. In this way, the occlusion process impose the adsorption and generate particular local electrical field by plasmonic coupling, as well make changes in charge transfer mechanisms, favor fluorescence quenching. Such processes allow the record of the SERRS spectrum of DOX with a peculiar spectral pattern. All enhanced band can be ascribed to modes with strong contribution of AP and the majority of them is composed with both methoxy group, as 1443, 1407, 1220, 1096 and 989 cm-1, and ammonium site, as 1571, 1407, 1296, 1258, 1220 and 986 cm-1. In this way, again is possible to infer that adsorption mechanisms of DOX on gold surface, modified with chloride anions, involve interactions through both methoxy and ammonium moieties.
The lability in the DOX adsorption on plasmonic surface is known in the literature, bring different spectral patterns.54 The use of different exciting radiations, in particular in near infrared, to escape of RR effect for understanding adsorption process is also an important strategy.40 However, the use of surface modifiers to intensify chemical affinity of DOX with the gold surface is a relevant approach to control chemical affinity and to the building of nanodevices for drug delivery systems. Several works29,39,55 bring out strategies to functionalize DOX to change the affinity for different kinds of nanostructures. However, functionalization usually involves chemical reactions, which raises the complexity of the processes, as well as may modify important chemical properties of the drug. In this way, the present work showed that it is possible to think about strategies to functionalize the metallic surface by tailoring specific interactions of the drug, mediated by low-cost surface modifiers, tracking this by SERS and SERRS spectroscopies.
In comparison with previous SERS results for DOX in the literature, Table S2 (SI section) shows that vibrational SERS assignment was preferentially done with silver surfaces,56,57 been AuNP used generally as nanodevices.
Conclusions
In this work, Raman, SERRS and SERS spectroscopies, with the aid of DFT calculations have been allowed to infer the adsorption geometries of DOX over AuNP surfaces with the mediation of ME and Cl- surface modifiers. It was shown by UV-Vis-NIR spectroscopy that aqueous suspensions with modified AuNP presented optimal adsorption kinetics of DOX and surface modifiers, contributing to obtain of SERS spectra with different exciting radiations in resonance with electronic transitions of metallic clusters. Such a control of plasmonic properties of SERS substrates allowed the record of SERS spectra from red to near infrared laser lines. Raman spectrum obtaining with 632.8 nm exciting radiation was dominated by RR effect, with AP vibrations particularly enhanced, which was also present in SERRS spectra recorded with the same radiation. Raman and SERS spectra recorded with near infrared exciting radiations, with wavelength at 785 and 1064 nm show progressive loss of influence of spectral pattern influenced by RR effect. In this way, it was possible to observe the enhancement of bands assigned to modes which were composed by ammonium and methoxy vibrations. Such enhancements were characterized as indicative of adsorption sites and it was present in the spectral patterns from gold surfaces modified with both Cl- and ME. The comparison of both allowed to suggest that in the presence of Cl- coverage, DOX adsorbs through ion pair mechanism, with ammonium moiety interacting with Cl- in bridge with metallic surface, while in the presence of ME, anthaquinone plane is tending to parallel position in relation to gold surface. These results allow to state that simple chemical modifications can give rise to different types of interactions, making the system based on AuNPs and DOX suitable for a variety of applications.
Supplementary Information
Supplementary data are available free of charge at http://jbcs.sbq.org.br as PDF file.
Data Availability Statement
The authors declare the underlying research data that support this manuscript are all available in the text, but any additional data may be obtained from the corresponding authors upon reasonable request.
Acknowledgments
The authors would like to thank CNPq and FAPEMIG (APQ 00887 23), Brazilian Funding Agencies, for the financial support. Such a study was financed in part by Coordenação de Aperfeiçoamento de Pessoal de Nível Superior - Brasil (CAPES), Finance Code 001. The authors also thank CNPq and CAPES for scholar fellowships.
References
-
1 Siegel, R. L.; Kratzer, T. B.; Giaquinto, A. N.; Sung, H.; Jemal, A.; Ca-Cancer J. Clin. 2025, 75, 10. [Crossref]
» Crossref -
2 Shipp, M. A.; N. Engl. J. Med. 1993, 329, 987. [Crossref]
» Crossref -
3 Murad, A. M.; Santiago, F. F.; Petroianu, A.; Rocha, P. R. S.; Rodrigues, M. A. G.; Rausch, M.; Cancer 1993, 72, 37. [Crossref]
» Crossref -
4 Singh, R.; Ha, S. E.; Yu, T. Y.; Ro, S.; Int. J. Mol. Sci. 2025, 26, 415. [Crossref]
» Crossref -
5 Lusby, R.; Demirdizen, E.; Inayatullah, M.; Kundu, P.; Maiques, O.; Zhang, Z.; Terp, M. G.; Sanz-Moreno, V.; Tiwari, V. K.; Mol. Cancer 2025, 24, 2. [Crossref]
» Crossref -
6 Shi, J.; Kantoff, P. W.; Wooster, R.; Farokhzad, O. C.; Nat. Rev. Cancer 2017, 17, 20. [Crossref]
» Crossref -
7 Isakoff, M. S.; Bielack, S. S.; Meltzer, P.; Gorlick, R.; J. Clin. Oncol. 2015, 33, 3029. [Crossref]
» Crossref -
8 Forner, A.; Reig, M.; Bruix, J.; Lancet 2018, 391, 1301. [Crossref]
» Crossref -
9 Shirazi-Fard, S.; Mohammadpour, F.; Zolghadr, A. R.; Klein, A.; J. Phys. Chem. B 2021, 125, 5549. [Crossref]
» Crossref -
10 Shahrokni, A.; Wu, A. J.; Carter, J.; Lichtman, S. M.; Clin. Geriatr. Med. 2016, 32, 63. [Crossref]
» Crossref -
11 Luu, A. Z.; Chowdhury, B.; Al-Omran, M.; Teoh, H.; Hess, D. A.; Verma, S.; JACC Basic Transl. Sci. 2018, 3, 861. [Crossref]
» Crossref -
12 Ibrahim Fouad, G.; Rizk, M. Z.; J. Mol. Histol. 2024, 55, 1023. [Crossref]
» Crossref -
13 Zhang, R.; Zhu, J.; Sun, D.; Li, J.; Yao, L.; Meng, S.; Li, Y.; Dang, Y.; Wang, K.; Micromachines 2022, 13, 940. [Crossref]
» Crossref -
14 Cho, K.; Wang, X.; Nie, S.; Chen, Z.; Shin, D. M.; Clin. Cancer Res. 2008, 14, 1310. [Crossref]
» Crossref -
15 Bobo, D.; Robinson, K. J.; Islam, J.; Thurecht, K. J.; Corrie, S. R.; Pharm. Res. 2016, 33, 2373. [Crossref]
» Crossref -
16 Chen, J.; Hu, S.; Sun, M.; Shi, J.; Zhang, H.; Yu, H.; Yang, Z.; Eur. J. Pharm. Sci. 2024, 193, 106688. [Crossref]
» Crossref -
17 Zhang, L.; Shi, J.; Zhu, M. H.; Huang, Y.; Lu, Q.; Sun, P.; Chen, H. Z.; Lai, X.; Fang, C.; Biomaterials 2025, 313, 122801. [Crossref]
» Crossref -
18 Allen, T. M.; Cullis, P. R.; Adv. Drug Delivery Rev. 2013, 65, 36. [Crossref]
» Crossref -
19 Zhang, Q.; Ma, R. F.; Ren, T. J.; Ren, X. Y.; Xu, Z. R.; J. Colloids Interface Sci. 2025, 679, 335. [Crossref]
» Crossref -
20 Kamaly, N.; Yameen, B.; Wu, J.; Farokhzad, O. C.; Chem. Rev. 2016, 116, 2602. [Crossref]
» Crossref -
21 Beach, M. A.; Nayanathara, U.; Gao, Y.; Zhang, C.; Xiong, Y.; Wang, Y.; Such, G. K.; Chem. Rev. 2024, 124, 5505. [Crossref]
» Crossref -
22 Farhoudi, L.; Hosseinikhah, S. M.; Kazemi-Beydokhti, A.; Arabi, L.; Alavizadeh, S. H.; Moosavian, S. A.; Jaafari, M. R.; Cancer Nanotechnol. 2024, 15, 37. [Crossref]
» Crossref -
23 Ulbrich, K.; Holá, K.; Šubr, V.; Bakandritsos, A.; Tuček, J.; Zbořil, R.; Chem. Rev. 2016, 116, 5338. [Crossref]
» Crossref -
24 Kalluri, R.; LeBleu, V. S.; Science 2020, 367, 6478. [Crossref]
» Crossref -
25 Lu, Q.; Kou, D.; Lou, S.; Ashrafizadeh, M.; Aref, A. R.; Canadas, I.; Tian, Y.; Niu, X.; Wang, Y.; Torabian, P.; Wang, L.; Sethi, G.; Tergaonkar, V.; Tay, F.; Yuan, Z.; Han, P.; J. Hematol. Oncol. 2024, 17, 16. [Crossref]
» Crossref -
26 Steć, A.; Targońska, M.; Jaikishan, S.; Chen, R.; Mucha, P.; Czyrski, G. S.; Jasiecki, J.; Płoska, A.; Heinz, A.; Wiedmer, S. K.; Kalinowski, L.; Waleron, K.; Wielgomas, B.; Dziomba, S.; Drug Delivery 2025, 32, 2439272. [Crossref]
» Crossref -
27 Zeynalzadeh, E.; Khodadadi, E.; Khodadadi, E.; Ahmadian, Z.; Kazeminava, F.; Rasoulzadehzali, M.; Samadi Kafil, H.; Heliyon 2024, 10, 35562. [Crossref]
» Crossref -
28 Ge, D.; Ma, S.; Sun, T.; Li, Y.; Wei, J.; Wang, C.; Chen, X.; Liao, Y.; Biomaterials 2025, 315, 122955. [Crossref]
» Crossref -
29 Yin, B.; Ho, W. K. H.; Xia, X.; Chan, C. K. W.; Zhang, Q.; Ng, Y. M.; Lam, C. Y. K.; Cheung, J. C. W.; Wang, J.; Yang, M.; Wong, S. H. D.; Small 2023, 19, 2206762. [Crossref]
» Crossref -
30 Teixeira, R. A. R.; Lataliza, A. A. B.; Raposo, N. R. B.; Costa, L. A. S.; Sant’Ana, A. C.; Colloids Surf., B 2018, 170, 712. [Crossref]
» Crossref -
31 Lima, F. R. A.; Campos, L. C.; Macedo, G. C.; D’Ávila, H.; Sant’Ana, A. C.; Spectrochim. Acta, Part A 2021, 255, 119660. [Crossref]
» Crossref -
32 Yi, J.; You, E. M.; Hu, R.; Wu, D. Y.; Liu, G. K.; Yang, Z. L.; Zhang, H.; Gu, Y.; Wang, Y. H.; Wang, X.; Ma, H.; Yang, Y.; Liu, J. Y.; Fan, F. R.; Zhan, C.; Tian, J. H.; Qiao, Y.; Wang, H.; Luo, S. H.; Meng, Z. D.; Mao, B. W.; Li, J. F.; Ren, B.; Aizpurua, J.; Apkarian, V. A.; Bartlett, P. N.; Baumberg, J.; Bell, S. E. J.; Brolo, A. G.; Brus, L. E.; Choo, J.; Cui, L.; Deckert, V.; Domke, K. F.; Dong, Z. C.; Duan, S.; Faulds, K.; Frontiera, R.; Halas, N.; Haynes, C.; Itoh, T.; Kneipp, J.; Kneipp, K.; Le Ru, E. C.; Li, Z. P.; Ling, X. Y.; Lipkowski, J.; Liz-Marzán, L. M.; Nam, J. M.; Nie, S.; Nordlander, P.; Ozaki, Y.; Panneerselvam, R.; Popp, J.; Russell, A. E.; Schlücker, S.; Tian, Y.; Tong, L.; Xu, H.; Xu, Y.; Yang, L.; Yao, J.; Zhang, J.; Zhang, Y.; Zhang, Y.; Zhao, B.; Zenobi, R.; Schatz, G. C.; Graham, D.; Tian, Z. Q.; Chem. Soc. Rev. 2025, 54, 1453. [Crossref]
» Crossref -
33 Ding, S. Y.; You, E. M.; Tian, Z. Q.; Moskovits, M.; Chem. Soc. Rev. 2017, 46, 4042. [Crossref]
» Crossref -
34 Le Ru, E. C.; Blackie, E.; Meyer, M.; Etchegoint, P. G.; J. Phys. Chem. C 2007, 111, 13794. [Crossref]
» Crossref -
35 Etchegoin, P. G.; Galloway, C.; Le Ru, E. C.; Phys. Chem. Chem. Phys. 2006, 8, 2624. [Crossref]
» Crossref -
36 Aloss, K.; Hamar, P.; Biochim. Biophys. Acta, Rev. Cancer 2024, 1879, 189109. [Crossref]
» Crossref -
37 Kruse, B.; Dash, B. S.; Kostka, K.; Wolff, N.; Prymak, O.; Loza, K.; Gumbiowski, N.; Heggen, M.; Oliveira, C. L. P.; Chen, J. P.; Epple, M.; ACS Appl. Bio Mater. 2024, 7, 6890. [Crossref]
» Crossref -
38 Panikar, S. S.; Banu, N.; Escobar, E. R.; García, G. R.; Cervantes-Martínez, J.; Villegas, T. C.; Salas, P.; De la Rosa, E.; Talanta 2020, 218, 121138. [Crossref]
» Crossref -
39 Lee, K. Y. J.; Wang, Y.; Nie, S.; RSC Adv. 2015, 5, 65651. [Crossref]
» Crossref -
40 Filgueiras, A. L.; Lima, F. R. A.; Carvalho, D. F.; Meirelles, M. A.; Paschoal, D.; dos Santos, H. F.; Sanchez-Cortes, S.; Sant’Ana, A. C.; Vib. Spectrosc. 2016, 86, 75. [Crossref]
» Crossref -
41 Clark, R. J. H.; Dines, T. V.; Angew. Chem., Int. Ed. 1986, 25, 131. [Crossref]
» Crossref -
42 Creighton, J. A.; Blatchford, C. G.; Albrecht, M. G.; J. Chem. Soc., Faraday Trans. 2 1979, 75, 790. [Crossref]
» Crossref -
43 Filgueiras, A. L.; Dutra, T. M. F.; Paschoal, D.; Dos Santos, H. F.; Sant’Ana, A. C.; J. Raman Spectrosc. 2017, 48, 789. [Crossref]
» Crossref -
44 Becke, A. D.; J. Chem. Phys. 1993, 98, 5648. [Crossref]
» Crossref -
45 Ditchfield, R.; Hehre, W. J.; Pople, J. A.; J. Chem. Phys. 2004, 54, 724. [Crossref]
» Crossref -
46 Hay, P. J.; Wadt, W. R.; J. Chem. Phys. 1985, 82, 299. [Crossref]
» Crossref - 47 Frisch, M. J.; Trucks, G. W.; Schlegel, H. B.; Scuseria, G. E.; Robb, M. A.; Cheeseman, J. R.; Scalmani, G.; Barone, V.; Mennucci, B.; Petersson, G. A.; Nakatsuji, H.; Caricato, M.; Li, X.; Hratchian, H. P.; Izmaylov, A. F.; Bloino, J.; Zheng, G.; Sonnenberg, J. L.; Hada, M.; Ehara, M.; Toyota, K.; Fukuda, R.; Hasegawa, J.; Ishida, M.; Nakajima, T.; Honda, Y.; Kitao, O.; Nakai, H.; Vreven, T.; Montgomery, J. A.; Peralta, J. E.; Ogliaro, F.; Bearpark, M.; Heyd, J. J.; Brothers, E.; Kudin, K. N.; Staroverov, V. N.; Kobayashi, R.; Normand, J.; Raghavachari, K.; Rendell, A.; Burant, J. C.; Iyengar, S. S.; Tomasi, J.; Cossi, M.; Rega, N.; Millam, J. M.; Klene, M.; Knox, J. E.; Cross, J. B.; Bakken, V.; Adamo, C.; Jaramillo, J.; Gomperts, R.; Stratmann, R. E.; Yazyev, O.; Austin, A. J.; Cammi, R.; Pomelli, C.; Ochterski, J. W.; Martin, R. L.; Morokuma, K.; Zakrzewski, V. G.; Voth, G. A.; Salvador, P.; Dannenberg, J. J.; Dapprich, S.; Daniels, A. D.; Farkas; Foresman, J. B.; Ortiz, J. V.; Cioslowski, J.; Fox, D. J.; Gaussian 09, Revision B.01, Gaussian, Inc., Wallingford CT, 2009.
-
48 Tonel, M. Z.; Martins, M. O.; Zanella, I.; Pontes, R. B.; Fagan, S. B.; Comput. Theor. Chem. 2017, 1115, 270. [Crossref]
» Crossref -
49 Olszówka, M.; Russo, R.; Mancini, G.; Cappelli, C.; Theor. Chem. Acc. 2016, 135, 27. [Crossref]
» Crossref -
50 Munnier, E; Cohen-Jonathan, S.; Linassier, C.; Douziech Eyrolles, L.; Marchais, H.; Soucé, M.; Hervé, K.; Dubois, P.; Chourpa, I.; Int. J. Pharm. 2008, 363, 170. [Crossref]
» Crossref -
51 Poupaert, J. H.; Couvreur, P.; J. Controlled Release 2003, 92, 19. [Crossref]
» Crossref -
52 Thedrattanawong, C.; Manaspon, C.; Nasongkla, N.; J. Drug Delivery Sci. Technol. 2018, 46, 446. [Crossref]
» Crossref -
53 Moskovits, M.; The J. Chem. Phys. 1982, 77, 4408. [Crossref]
» Crossref -
54 Das, G.; Nicastri, A.; Coluccio, M. L.; Gentile, F.; Candeloro, P.; Cojoc, G.; Liberale, C.; De Angelis, F.; Di Fabrizio, E.; Microsc. Res. Tech. 2010, 73, 991. [Crossref]
» Crossref -
55 Won, S. Y.; Singhmar, R.; Sahoo, S.; Kim, H.; Kim, C. M.; Choi, S. M.; Sood, A.; Han, S. S.; Colloids Surf., B 2025, 245, 114207. [Crossref]
» Crossref -
56 Gautier, J.; Munnier, E.; Douziech-Eyrolles, L.; Paillard, A.; Dubois, P.; Chourpa, I.; Analyst 2013, 138, 7354. [Crossref]
» Crossref -
57 Beljebbar, A.; Sockalingum, G. D.; Angiboust, J. F.; Manfait, M; Spetrochim. Acta, Part A 1995, 51, 2083. [Crossref]
» Crossref
Edited by
-
Editor handled this article:
Adriana Nunes Correia (Associate) and Brenno A. D. Neto (Editor-in-Chief)