Evaluation of the Lipid Composition of Commercially Available Evening Primrose Products by Gas Chromatography and Mass Spectrometry
Abstract
Evening primrose oil supplements are rich in omega-6 fatty acids, with emphasis on linoleic and γ-linolenic acids, being taken in the treatment and prevention of diseases, but mainly for the relief of symptoms caused by premenstrual tension and menopause in women. This study aimed to evaluate the quality of the lipid profile of evening primrose oil supplements using gas chromatography techniques with a flame ionization detector and mass spectrometry with electrospray ionization. For this, eight commercially available national evening primrose oil brands were used. Of the eight samples analyzed, only two met all the standards established in legislation for fatty acids. The remaining capsules were subjected to triacylglycerol analysis and using a calibration curve the presence of soybean oil in the composition of the evening primrose oil capsules was verified. From the triacylglycerol with a mass/charge ratio of 901, it was possible to identify the addition of 31.16-85.88% of soybean oil in six of the eight capsules, leading the consumer to ingest products that did not comply with current legislation.
Keywords:
quantification; lipid profile; lipid marker; esterification; food supplements
Introduction
Evening primrose (Oenothera biennis L.) is a plant from the Onagraceae family, characteristic of regions with a cold and dry climate. With more than 500 species, its initial uses were reported in China, as a garden flower. It is currently used mainly in the pharmaceutical industry, with use aimed at consumption in the form of dietary supplements.1, 2
The intake of evening primrose oil (EPO) has been welcomed, mainly due to its percentage of polyunsaturated fatty acids (PUFA), especially γ-linolenic fatty acid (GLA, 18:3n-6), with about 7-14% of the total fatty acid (FA) content. Studies1, 3, 4 correlate the intake of EPO with the prevention and/or treatment of various clinical cases, especially those related to the health of women, such as the reduction of symptoms caused by premenstrual tension, menopause, breast pain, among other benefits.
The consumption of dietary supplements has grown exponentially in recent years. A useful tool under the guidance of a professional, as it is not always possible to maintain a healthy and balanced diet. However, these products have considerably high prices and together with countless options on the market, it is difficult to know the origin and quality of these products.1, 5
Several analytical techniques are cited in the literature with potential to assess the quality of vegetable oils. Studies reported by Filoda et al. 6 and Alharbi et al.,7 evaluated the presence of other vegetable oils of lower commercial value in olive oil, using spectroscopic techniques, such as nuclear magnetic resonance (NMR) and Fourier transform infrared spectroscopy (FTIR).
Analytical techniques such as gas chromatography with flame ionization detector (GC-FID) and electrospray ionization mass spectrometry (ESI-MS) can also be used to evaluate the lipid profile and authenticity of vegetable oils. Silveira et al. 8 and Galuch et al., 5 determined adulterations in omega-3 supplements and olive oil, respectively, using GC-FID and ESI-MS. In addition to these, works reported by El Mrabet et al., 9 who used GC-FID to evaluate adulteration in rosemary oil and Piñero et al., 10 who determined the authenticity of olive oil using the ESI-MS technique can be highlighted. This demonstrates the viability of the GC-FID and ESI-MS techniques mentioned for evaluating the lipid profile of vegetable oils, since they are considerably fast and present excellent response to compounds such as lipids, with the possibility of being used as routine techniques in quality control laboratories.
Therefore, this study aimed to evaluate the quality of the lipid profile of EPO supplements using GC-FID and ESI-MS techniques.
Experimental
Samples
The capsules and standard EPO were obtained in different states of Brazil, on the digital market (Table 1). Soybean oil (SO) was obtained from the local market in Maringá (Paraná, Brazil) and, together with the standard EPO, was certified by analysis of the FA profile by GC-FID.
Lipid methylation
Methylation of lipids was carried out according to the ISO-5509 methodology.11 Initially, 100 mg of oil was measured in a test tube and 2.0 mL of n-heptane was added. The tube was shaken vigorously for 2 min. Then, 2.0 mL of potassium hydroxide/methanol (2.0 mol L−1) were added and stirred for another 2 min, when 500 μL of the internal standard methyl tricosanoate (23:0, Sigma-Aldrich, St. Louis, USA) was added and the test tubes were shaken gently. Finally, after complete phase separation, the organic portion was collected and chromatographic analyses were carried out.
Chromatographic analyses
The FA of the EPO and standard soybean samples, in addition to the EPO capsules, were analyzed. Fatty acid methyl esters (FAME) were separated according to ISO-5509.11 Samples were injected into a TRACE™ Ultra Thermo Scientific™ gas chromatograph (Thermo Scientific™, USA), with a flame ionization detector and a fused silica column (100 m × 0.25 mm internal diameter, 0.25 μm cyanopropyl, CP-7420). The gas flows were 1.2 mL min−1 for the carrier gas (H2), 30 mL min−1 for the auxiliary gas (N2), and 30 and 300 mL min−1 for the flame gases (H2) and synthetic air, respectively. A sample volume of 1 μL was injected in triplicate with a sample split of 1:40. The temperature of the injector and detector was maintained at 235 °C. The column temperature was programmed to start at 165 °C, increasing to 185 °C with a heating ramp of 4 °C min−1 for 7 min, held constant for 3 min. Then, the temperature was adjusted to 235 °C with a heating ramp of 6 °C min−1 and maintained constant for 2.67 min, totaling an analysis time of 26 min. The identification of FAME was carried out by comparing retention times with relative analytical standards, FAME Mix, C4-C24 (Sigma-Aldrich), and the results expressed in mg g−1 of total fatty acids (equation 1), automatically processed using Chromquest TM 5.0 software.
where: FA is the concentration in mg of fatty acids per g of total lipids; Ax is the FA peak area; AP is the area of the internal standard (IS) - methyl tricosanoate (23:0me); MP is the mass of IS added to the sample; MX is the mass of the sample; FCT is the theoretical correction factor e FCAE is the conversion factor necessary to express the results in mg of FA.12
Lipidic profile by ESI-MS
The TAG (triacylglycerol) profile was carried out on standard EPO and soy samples, and also on EPO capsules. To identify the TAG profile, samples were prepared in accordance with the works of Galuch et al. 5 and Silveira et al. 8 First, 50.0 μL of oil were diluted with 950 μL chloroform. Then, 5.0 μL of this solution were mixed with 1.0 mL of methanol:chloroform (90:10). Finally, 20.0 μL of a 0.1 mol L−1 of ammonium formate solution was added to form ammonium adducts. Furthermore, standard additions of known amounts of SO, with concentrations of 0, 20, 40, 60, 80 and 100% v/v, were made to the standard EPO to check the presence of adulterations in commercially purchased EPO capsules.
Samples were injected with a continuous flow of 10.0 μL min1 in positive mode, capillary voltage 3.0 kV, cone voltage 20.0 V, gas flow of 40 L h−1, desolvation flow of 600 L h−1, desolvation temperature of 200 °C and source temperature of 130 °C. Data were processed using MassLynx™ software from Waters (Newcastle, UK) and spectra acquired in the range of 800-1200 mass/charge (m/z).
Statistical analysis
FA analyses by GC-FID were performed in triplicate and the results were expressed as the mean and percentage deviation. Comparisons of mean results were subjected to the Student’s t-test, with a significance level of 95% (p < 0.05), with statistical analysis performed using the R software version 4.2.3.13 Principal component analysis (PCA) was obtained with the R software using the average levels of the FA results. ESI-MS analyses were performed in triplicate and results expressed as the mean percentage content.
Results and Discussion
FA profile by GC-FID
From GC-FID analyses the FA profile of commercial EPO samples was obtained (Table 1). The results obtained are presented in Table 2.
In total, 9 FA were identified in evening primrose supplements, however, the focus was on the pre-established concentration for some of these, such as palmitic acid (PA,16:0), stearic acid (SA,18:0 ), oleic acid (OA,18:1n-9), LA and GLA. The use of these FA as a reference is in accordance with the standards expressed in the legislation of the Agência Nacional de Vigilância Sanitária (ANVISA),14 which is the national institution that governs the pre-established FA values for the EPO.
Analyzing the lipid profile, it can be seen that the majority FA in samples A, B, D, E, F and H was LA, followed by OA and PA. In capsules C and G, GLA appears as one of the majority, being the second FA with the highest concentration in both samples. According to the literature,14 GLA is one of the majority FAs in EPO and this is confirmed in studies carried out by Blaak et al. 3 and Montserrat-de la Paz et al., 15 that also analyzed EPO by GC-FID. According to published studies, the LA content in EPO is approximately 73% of the total FA composition, GLA around 10% and OA around 7%, which collaborates with the standards established by legislation.14
When observing the percentage of FA contents in the samples compared to the legislation, it is clear that the majority of these are outside the established parameters. Only supplements C and G were within the standards for all FA. In samples A, B, D, E, F and H, only GLA presented compliant values, the LA content was below and the OA content was above the regulations.
Even with the difference in the species of primrose in the supplements and the amount of GLA and LA reported on the label, it is not justifiable for these supplements to be outside the acceptable parameters for FA. This is because the values established in legislation take into account factors responsible for changes in the lipid profile of vegetable oils, such as climate, harvest time, degree of maturation, among other factors.16
The SO was used as a comparison to analyze the quality of the lipid profile of samples A, B, D, E, F and H. This oil has a high content of omega-6 FA, with a lipid profile similar to evening primrose and is even much cheaper and widely used in the daily lives of the population.
In Table 3 there is a comparison between the samples outside the parameters of the legislation (A, B, D, E, F and H) with the values expressed in the SO standards, according to the Ministério da Agricultura e Pecuária (MAPA).17
Comparison of fatty acid contents between samples A, B, D, E, F and H with soybean oil legislation
Analyzing the results shown in Table 3, it can be seen that the samples outside the evening primrose legislation presented FA contents close to the soybean legislation values. This analysis becomes even clearer when analyzing the PCA (Figure 1) of the supplement samples compared to the SO and the standard EPO. It is worth mentioning that, for this statistical analysis, the FA contents of the supplements and SO and evening primrose were used as standards. The PCA was obtained using R software version 4.2.3.13
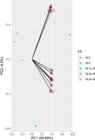
Principal component analysis (PCA) of evening primrose oil (EPO) and standard soybean oil (SO) and evening primrose supplement samples.
PCA provided an explanation of approximately 99% of the total variance in the data, with 95% attributed to principal component 1 (PC1) and 5% to principal component 2 (PC2).
Based on the PCA results, two loadings are formed, one referring to the standard C, G and EPO samples and the other with the other EPO capsules and the SO. This fact demonstrates the proximity of the AG profile between these samples and, therefore, the inconsistency of capsules A, B, D, E, F and H with current legislation. Thus, FAs proved to be useful chemical markers in identifying possible inconsistencies in EPO supplements.
Lipidic profile by ESI-MS
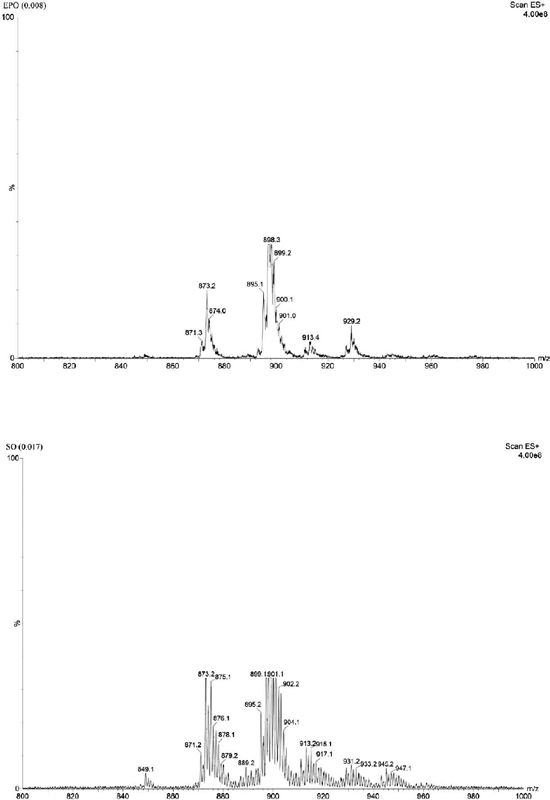
The ESI-MS technique was used to prove the presence of SO in samples of supplements A, B, D, E, F and H, outside the standards established for FA by GC-FID. The ESI-MS technique proved to be highly effective in determining the TAG profile of vegetable oils and, in addition, a method capable of quantifying the presence of adulterant oils. This potential has been demonstrated in other studies published in the literature, such as the evaluation of adulterations in coconut oil with palm kernel oil;18 quantification of SO in extra virgin olive oils;8 presence of adulteration in the lipid profile of oil-based cosmetic products of avocado,19 among other studies. The standard EPO and SO spectra are shown in Figure 2.
Observing the results obtained by ESI-MS, some differences can be analyzed in the lipid profile of the standard EPO and SO, with emphasis on the region in the SO with greater intensity with m/z ratio 901. With this information and the FA composition of the EPO, the main TAGs of this oil were identified, these being LLL, PLL and OLnLn (L: linoleic acid, O: oleic acid, P: palmitic acid, Ln: linoleic acid), through from the LAMES platform.20 In the SO sample, this TAG showed high intensity, therefore being a lipid marker characteristic of this vegetable oil. The same was identified in high intensity in samples A, B, D, E, F and H, the same ones that did not meet the legislation criteria in terms of FA. In this way, known amounts of SO were added with the aim of verifying the behavior of the intensity of this TAG in the supplements and quantifying the increase.

Therefore, the standard EPO sample was intentionally adulterated with addition of SO at six different levels (0, 20, 40, 60, 80 and 100% v/v), according to Table 4.
From the results obtained, a calibration curve was constructed to evaluate the behavior of TAG m/z 901 with increasing SO concentration in supplement samples and thus verify the presence or absence of SO in commercial products.
The calibration curve obtained presented a R2 (coefficient of determination) of 0.921 and a linear equation . By analyzing the angular coefficient of the calibration curve, it is possible to notice the increase in the intensity of the TAG chosen as a lipid marker. Furthermore, from the straight line equation it was possible to calculate the increase in SO concentration in the sample capsules. The results are presented in Table 5.
Given the results presented, the presence of SO was identified in capsules A, B, D, E, F and H, varying between 31.16 and 85.88%, confirming adulteration in these commercial products, indicating that these capsules are unfit for consumption. Furthermore, the TAG profile was an important marker for checking adulteration, corroborating the results obtained by GC-FID, demonstrating the efficiency of the study and the possible applicability in analyses of other vegetable oil supplements.
Conclusions
Through the study carried out, in which eight brands of national evening primrose oil supplements were analyzed, six of these were found to be in violation of current legislation and unsuitable for consumption, with SO concentrations varying between 31.16 and 85.88%. Furthermore, the study demonstrated that the GC-FΓD and ESI-MS techniques were efficient in determining adulterations in EPO supplement capsules and that they could be used in the analysis of other vegetable oil supplements and in routine experiments in quality control laboratories, guaranteeing consumers security in their choices.
Supplementary Information
Supplementary information (mass spectra of evening primrose oil capsules A, B, D, E, F and H) is available free of charge at http://jbcs.sbq.org.br as PDF file.https://minio.scielo.br/documentstore/1678-4790/KPbS5LGq63mDY5PkFWsbMSs/10324ef18910a007a697ba90f79a083c8d77b01d.pdf
Acknowledgments
The authors would like to thank Conselho Nacional de Desenvolvimento Científico e Tecnológico (CNPq), Coordenação de Aperfeiçoamento de Pessoal de Nível Superior (CAPES) and Fundação Araucária for their financial support.
References
-
1 Ferreira, M. S.; Rocha, K. D. C.; Garcia, C. E. R.; Braz.. J. Dev. 2022, 8, 41440. [Crossref]
» Crossref -
2 Zhao, B.; Gong, H.; Li, H.; Zhang, Y.; Deng, J.; Chen, Z.; J. Oleo Sci. 2019, 68, 719. [Crossref]
» Crossref -
3 Blaak, J.; Staib, P.; Int. J. Cosmet. Sci. 2022, 44, 1. [Crossref]
» Crossref -
4 Timoszuk, M.; Bielawska, K.; Skrzydlewska, E.; Antioxidants 2018, 7, 108. [Crossref]
» Crossref -
5 Galuch, M. B.; Carnonera, F.; Magon, T. F. S.; da Silveira, R.; dos Santos, P. D. S.; Pizzo, J. S.; Santos, O. O.; J. Braz. Chem. Soc. 2018, 29, 631. [Crossref]
» Crossref -
6 Filoda, P. L.; Fetter, L. F.; Fornasier, F.; Schneider, R. C. S.; Helfer, G. A.; Tischer, B.; Teichmann, A.; da Costa, A. B; Food Anal. Methods 2019, 12, 293. [Crossref]
» Crossref -
7 Alharbi, H.; Khafi, J.; Dutta, A.; Jaremko, M.; Emwas, A.; Food Control 2024, 166, 110679. [Crossref]
» Crossref -
8 Silveira, R.; Vágula, J. M.; Figueiredo, I. L.; Claus, T.; Galuch, M. B.; Santos Junior, O. O.; Visentainer, V. J.; Food Res. Int. 2017, 102, 43. [Crossref]
» Crossref -
9 El Mrabet, A.; El Orche, A.; Diane, A.; Johnson, J. B.; Said, A. A. H.; Bouatia, M.; Sbai-Elotmani, I.; Vib. Spectrosc. 2024, 132, 103674. [Crossref]
» Crossref -
10 Piñero, M.; Amo-González, M.; Ballesteros, R. D.; Pérez, L. R.; de La Mora, G. F.; Arce, L.; J. Am. Soc. Mass Spectrom. 2020, 31, 527. [Crossref]
» Crossref -
11 ISO-5509: Animal and Vegetable Fat and Oils - Preparation of Methyl Esters of Fatty Acids, ISO: Geneva, 1978. [Link] accessed in October 2024
» Link - 12 Visentainer, J. V.; Franco, M. R. B.; Ácidos Graxos em Óleos e Gorduras, 2nd ed.; Editora da Universidade Estadual de Maringá: Maringá, 2012.
-
13 R Core Team; R: A Language and Environment for Statistical Computing, version 4.4.3; R Foundation for Statistical Computing, Vienna, Austria, 2023. [Link] accessed in October 2024
» Link -
14 Agência Nacional de Vigilância Sanitária (ANVISA); Instrução Normativa - IN No. 87, de 15 de março de 2021, Estabelece a Lista de Espécies Vegetais Autorizadas, as Designações, a Composição de Ácidos Graxos e os Valores Máximos de Acidez e de Índice de Peróxidos para Óleos e Gorduras Vegetais; Diário Oficial da União (DOU), Brasília, No. 51, de 17/03/2021. [Link] accessed in October 2024
» Link -
15 Montserrat-de la Paz, S.; Fernández-Arche, M. A.; Ángel-Martín, M.; García-Giménez, M. D.; Phytochem. Lett. 2014, 8, 158. [Crossref]
» Crossref -
16 Jonas, M.; Ketlogetswe, C.; Gandure, J.; Heliyon 2020, 6, 2405. [Crossref]
» Crossref -
17 Ministério da Agricultura e Pecuária (MAPA); Instrução Normativa No. 49, de 14 de setembro de 2006, Aprovar as Instruções para Permitir a Entrada e o Uso de Produtos nos Estabelecimentos Registrados ou Relacionados no Departamento de Inspeção de Produtos de Origem Animal, do Ministério da Agricultura, Pecuária e Abastecimento; Diário Oficial da União (DOU), Brasília, 20/09/2006. [Link] accessed in October 2024
» Link -
18 Pizzo, J. S.; Galuch, M. B.; Manin, L. P.; Santos, P. D. S.; Zappielo, C. D.; Santos Jr., O. O.; Visentainer, J. V.; Food Addit. Contam.: Part A 2019, 36, 1597. [Crossref]
» Crossref -
19 Rydlewski, A. A.; Pizzo, J. S.; Manin, L. P.; Galuch, M. B.; Santos, P. D. S.; Zapiello, C.; Santos Jr., O. O.; Visentainer, J. V.; Chem. Pap. 2020, 74, 2799. [Crossref]
» Crossref -
20 Antoniosi Filho, N. R.; Mendes, O. L.; Lanças, F. M.; Chromatographia 1995, 40, 557. [Crossref]
» Crossref
Edited by
-
Editor handled this article:
Andrea R. Chaves (Associate)