Synthesis and Characterization of Sustainable Hydrochar from Banana Peels for the Removal of Iron and Manganese Ions in Aqueous Systems
Abstract
Iron and manganese are important water quality parameters, as their presence can lead to undesirable color and odor. Here, hydrochars (HCs) were synthesized from banana peels via hydrothermal carbonization to produce a sustainable adsorbent for efficient iron and manganese removal from water. A 23 factorial design with a central point was carried out to evaluate the variables: (i) activating agent (H3PO4 or NaOH), (ii) temperature (100 and 200 °C), and (iii) residence time (8 and 14 h). HC9 was performed in water at 150 °C for 11 h. Optimal performance was evaluated from Fe2+ and Mn2+ removal. Fourier transform infrared (FTIR) confirmed functional groups in all HCs, while X-ray diffraction (XRD) broad peaks between 15-30° indicated an amorphous structure. HC9 showed the best performance for the adsorption of both metals. Equilibrium was reached at 200 min, and the kinetic data were best described by the pseudo-second-order model. The adsorption data were best fitted by the Langmuir model for Fe and the Freundlich model for Mn, with maximum adsorption capacities (qmax) values of 33.18 and 19.00 mg g⁻1 for Fe and Mn, respectively. Thus, adsorption using this biochar is a promising and environmentally friendly method for removing those metals from aqueous systems.
Keywords:
hydrothermal process; adsorption; carbonization; biomass; agro-industrial waste
Introduction
The growing accumulation of agro-industrial waste poses significant environmental challenges due to improper disposal, which can result in various ecological problems. Consequently, valorizing these residues offers a promising approach for sustainable solid waste management and the effective removal of contaminants from aqueous systems. Among agro-industrial wastes, banana peel stands out. The banana, Musa spp., is native to South and Southeast Asia and is the most produced fruit worldwide.1 It has an annual production of approximately 116,7 million tons, accounting for 16% of global fruit production.2
Brazil is the fourth-largest banana producer in the world, with São Paulo being the leading producing state.3 In 2022, the state of Minas Gerais produced 841,688 tons of bananas, ranking as the second-largest producer.4 Bananas are widely consumed due to their pleasant sensory characteristics and taste, as well as their high caloric value, fiber content and vitamin levels.5 Moreover, banana consumption supports economic development and food security in developing countries, particularly those with low income and food deficits.6 As a result of high consumption, the waste generated, primarily banana peels, considered biomass, becomes substantial, necessitating the development of sustainable alternatives for its reuse.
Biomass derived from agricultural waste is a renewable carbon source, primarily composed of lignin (20-25%), hemicellulose (20-30%), and cellulose (40-50%),7 collectively referred to as lignocellulosic biomass. This material serves as the initial feedstock for biochar production, as the carbonization of biomass produces a carbon-rich substance known as biochar.8,9 Among the main components of biomass, lignin exhibits the greatest potential for carbon material production, since its highly cross-linked aromatic nature provides superior thermal stability and leads to higher biochar yields during pyrolysis.10 Biomass carbonization can occur through hydrothermal processing or pyrolysis (slow and fast). In hydrothermal carbonization (HTC), also referred to as wet pyrolysis, biochar is produced under milder temperatures and moderate pressures. This process results in a high conversion of biomass into solid phase hydrochar, yielding a material with high energy content.11
HTC is conducted in an aqueous medium, within a sealed system under autogenous pressure, using a hydrothermal reactor.12 One of the main advantages of the HTC process is that biomass does not require drying prior to treatment. Additionally, the relatively mild operating temperatures, generally below 250 °C, contribute to lower energy consumption.13 The process takes place under subcritical water conditions, which are defined by temperatures and pressures below the critical point of water, in other words, below 374 °C and 22.06 MPa. HTC involves hydrolysis, decarboxylation, and dehydration reactions, which jointly lead to biochar formation via condensation reactions.14 These processes tend to preserve surface oxygen-containing functional groups, resulting in the formation of a hydrophilic shell. This characteristic enables interactions with a wide range of compounds, making HTC-derived hydrochars excellent adsorbents. During HTC, reactions such as hydrolysis, condensation, decarboxylation, and dehydration take place. In the presence of water and at temperatures above 150 °C, hydrolysis fragments large biomass molecules, breaking down cellulose and hemicellulose into smaller units. Decarboxylation removes carboxyl groups, releasing CO2, while dehydration eliminates hydroxyl groups through water loss.15 The presence of oxygenated functional groups plays a key role in controlling interactions with contaminants, similar to observations in FeII-bearing clay minerals, where the distribution of oxygen-coordinated iron sites governs hydroxyl radical formation and the degradation of organic compounds.16
In this context, a lot of methods are employed for the removal of iron and manganese from water, including filtration, precipitation, biological processes, ion exchange and adsorption.17 Among these, adsorption offers advantages such as simple operation, low cost, and environmental sustainability.18 The concept is based on a mass transfer process in which particles present in a fluid phase are transferred to the surface of a porous solid through physical interactions or chemical bonds.19 This process facilitates the separation of components, where the adsorbate is the substance to be removed from the medium, and the adsorbent is the material onto which the adsorbate adheres, concentrating on its surface or interface.20 Different materials can be used for the removal of Fe and Mn in aqueous systems, such as zeolites,21 bentonites,22 charcoal,23 and biochars.24,25
The use of waste materials for the conversion into value-added products for water contaminant removal aligns with the United Nations Sustainable Development Goals (SDGs), particularly Goals 3 (Good Health and Well-being), 6 (Clean Water and Sanitation), and 14 (Life Below Water). Within this framework, the objective of this work was to evaluate key parameters for the sustainable synthesis of biochar via hydrothermal carbonization of banana peel, using a factorial experimental design, aiming at the removal of iron and manganese from water.
Experimental
Materials and reagents
Analytical-grade reagents were used in this work. Phosphoric acid (CAS: 7664-38-2) and sodium hydroxide (CAS: 1310-73-2) were purchased from Vetec and Neon, respectively. Hydrochloric acid 37% (CAS 7647-01-0) was obtained from Alphatec and anhydrous citric acid (CAS 77-92-9) from CRQ Química. Ammonium iron(II) sulfate (CAS: 7783-85-9), manganese sulfate (CAS: 10034-96-5), and nitric acid (CAS: 7697-37-2) were obtained from Êxodo Científica. Iron (10020 ± 45 mg L-1) and manganese (10006 ± 50 mg L-1) solutions were from SpecSol. All solutions were prepared using type II water. All solutions were stored protected from light at room temperature.
Biomass collection and processing
Banana peels were collected from the University Restaurant at the Universidade Federal de Viçosa (UFV). The peels were washed with tap water and dried in an oven at 105 °C for 24 h. Subsequently, the material was ground, sieved using a 500-micrometer (32 mesh) sieve, and stored at room temperature (nearly 25 °C).
Hydrothermal carbonization (HTC)
For hydrothermal carbonization, 6.25 g of the processed biomass and 50 mL of an activating agent solution were added to a stainless-steel autoclave containing 100 mL Teflon® liner. Phosphoric acid and sodium hydroxide, each at a concentration of 0.100 mol L-1, were individually used as activating agents. A control experiment was also conducted using only type II water. The samples were heated in the autoclave according to the factorial experimental design (Table 1). After the designated reaction time, the autoclave was cooled to room temperature, and the resulting product was washed with distilled water until a neutral pH (7.0) was achieved. Then, the samples were centrifuged (4000 rpm for 20 min), dried in an oven at 60 °C for 24 h, weighed and stored in a desiccator at room temperature. A full factorial experimental design (23) was applied, considering three variables (temperature, residence time and activating agent) each evaluated at two levels. Additionally, a control experiment was carried out at the midpoint of the variable ranges, in the absence of any activating agent, using only type II water, totaling ten experimental runs. The parameters assessed in each condition are presented in Table 1. A temperature of 100 °C was chosen because, in a closed system, water reaches a subcritical state with enhanced reactivity (lower dielectric constant and higher ionic product), promoting the hydrolysis of cellulose, hemicellulose, and other biomass components, and initiating hydrochar formation.26 The maximum temperature was limited to 200 °C to preserve the integrity of the Teflon® reactor.27
After hydrochars production, iron and manganese removal tests were carried out in water, with the removal percentage as the response variable for the experimental design. The data were analyzed using Excel (Microsoft),28 Statistica 7 (StatSoft),29 and Origin 2021 (OriginLab) software.30
Hydrochar characterization
The hydrochars were characterized using various analytical techniques. The carbon, nitrogen, and sulfur contents of hydrochars and the raw biomass were determined using a LECO TruSpec Micro elemental analyzer. Cystine (N 11.64%, C 29.98%, H 5.02%, S 26.71%) was used as the calibration standard. The combustion and reduction tubes were maintained at 1150 and 850 °C, respectively.
The Brønsted acid sites of the hydrochars and the raw biomass were quantified by acid-base titration. For this, 100 mg of each material were added to 10.00 mL of NaOH solution (0.100 mol L-1) and stirred for 3 h at 200 rpm. After centrifugation (10 min at 4000 rpm), 5.00 mL of the supernatant were titrated with hydrochloric acid (HCl, 0.100 mol L-1) and compared to a control experiment conducted without the addition of material. Both solutions were standardized, with HCl being standardized using a primary standard (Na2CO3), and NaOH subsequently standardized using the standardized HCl solution. The acid concentration was calculated using equation 1, below.
where Vc is the volume of titrant, VT is the volume of the solution being titrated, CT is the concentration of HCl, and mH is the mass of the material used.The point of zero charge (pHPCZ) of the hydrochars were determined by adding 20 mg of the material to 20.00 mL of NaCl solution (0.100 mol L-1) with the initial pH adjusted to 2, 4, 6, 8, or 10.13 The pH adjustment was carried out using HCl and/or NaOH solutions (0.100 mol L-1). The pH range of 2-10 was selected to minimize the influence of acid and alkaline errors, which are inherent to combined glass electrodes.31 The chosen range ensures operation within the linear region of the electrode, providing precise and reproducible measurements. The system was stirred at 100 rpm for 24 h, followed by centrifugation to separate the supernatant and determine the final pH.
Hydrochars were analyzed by Fourier transform infrared (FTIR) spectroscopy using a Varian 660-IR spectrometer equipped with a PIKE GladiATR attenuated total reflectance accessory featuring a diamond crystal.
The biomass and HC9 were also analyzed by X-ray diffraction (XRD) using a D8-Discover (Bruker) instrument with Cu Kα radiation (λ = 0.1541 nm), over a 2θ angular range of 10° to 60°.
Nitrogen adsorption and desorption isotherms of the hydrochar (HC9) and biomass were determined using a Nova 600 Series instrument from Anton Paar. The samples were degassed at 120 °C for 4 h prior to analysis. The specific surface area was calculated using the Brunauer-Emmett-Teller (BET) method, and pore size distribution was determined by the Barrett-Joyner-Halenda (BJH) method.
The surface charge (zeta potential) of the biomass and HC9 were measured using a Nano ZS Zetasizer (Anton Paar). For this analysis, 10 mg of biochar were added to 250 mL of NaCl solution (0.100 mol L-1) and stirred for 24 h. The system was sonicated for 2 h, and the pH was adjusted to different values: 2, 4, 6, 8, 10, and 12. All analyses were performed in duplicate.
The morphology of the biomass and HC9 were evaluated using scanning electron microscopy (SEM) with a JEOL JSM-6010LA electron microscope operating at an acceleration voltage of 20 kV. For the analysis, the samples were mounted on carbon tape and coated with gold, using a Quorum Q150R S sputter coater.
Iron and manganese removal from water
Hydrochar efficiency was investigated via adsorption experiments focused on iron and manganese removal from water. For this, 50 mg of each hydrochar were added to 20.00 mL of iron or manganese solution (10 mg L-1) and stirred at 200 rpm for 24 h at room temperature (nearly 25 ºC). Following adsorption, the suspensions were filtered through 0.45 µm cellulose acetate membranes, and the resulting supernatants were analyzed by microwave-induced plasma optical emission spectrometry (MIP OES) using an Agilent 4100 MP-AES (Agilent Technologies, Australia). The spectral lines used for metal determination included iron wavelengths of 259.940 and 371.993 nm, and manganese wavelengths of 260.568 and 403.449 nm. Total iron or manganese standard solutions were prepared at concentrations of 1.00, 2.00, 4.00, 6.00, 8.00, and 10.00 mg L-1 in 1% nitric acid. A linear regression model was fitted to experimental data to generate the analytical curve. All analyses were performed in duplicate.
To evaluate the effect of pH on adsorption, separate experiments were conducted using 20 mg of biochar in 20.00 mL of iron or manganese solution (10 mg L-1) with the pH adjusted to 2, 3, 4, and 5, using HCl and NaOH solutions, both at 0.100 mol L-1. The system was stirred at 200 rpm for 24 h at room temperature (nearly 25 ºC) and then filtered through a 0.45 µm cellulose acetate membrane. Although the results will be discussed in detail later, it is noteworthy that HC9 demonstrated the highest performance among all samples evaluated. Subsequently, kinetic experiments were conducted to determine the adsorption equilibrium time for Fe and Mn, using HC9 (11 h at 150 °C, without chemical activation). For this, 50 mg of biochar were added to 20.00 mL of a standard iron or manganese solution, each at a concentration of 100 mg L-1, stirred at 200 rpm for 24 h at room temperature (about 25 ºC). The study was conducted at the following time intervals: 0, 5, 10, 15, 20, 25, 30, 60, 90, 120, 150, 180, 240, 360, 480, 1020, and 1440 min. The experiments were carried out in batch mode. After each time point, the system was centrifuged and filtered through a 0.45 µm cellulose acetate membrane; from there, the samples were subsequently analyzed by MIP OES.
The pseudo-first-order kinetic model (equation 2), pseudo-second-order model (equation 3), and Elovich model (equation 4), were fitted to the experimental data, with the best-fitting model being the one with the highest coefficient of determination (R2) value and the lowest Akaike Information Criterion (AIC) value. The AIC is a metric that aids in the interpretation of results by indicating which of the applied models best fits the experimental data.32
where qt is the amount of solute adsorbed per unit mass of adsorbent at a given time (μg mg-1), qe is the amount of solute adsorbed per unit mass of adsorbent at equilibrium (μg mg-1), k1 is the pseudo-first-order adsorption rate constant (h-1), k2 is the pseudo-second-order adsorption rate constant (mg μg-1 L-1), coefficient a corresponds to the initial adsorption rate (mg g-1 min-1), coefficient b is the desorption constant (mg g-1), and t is time in hours.Adsorption isotherms were assessed by adding 50 mg of hydrochar to 50.00 mL of iron or manganese solutions at concentrations of 5, 10, 25, 35, and 50 mg L-1. The solutions were stirred for 7 h at 200 rpm and then filtered through a 0.45 µm cellulose acetate membrane. Finally, the supernatant was analyzed by MIP OES.
The Langmuir and Freundlich isotherm models were fitted to the experimental data according to equations 5 and 6.
where qmax is the maximum adsorption capacity (mg L-1), n is the constant related to adsorption intensity, Kf is the Freundlich constant (mg g-1), and Kl is the Langmuir adsorption constant.Evaluation of interferences in iron and manganese adsorption
Solutions of Fe2+ and Mn2+, each at a concentration of 100 mg L-1, were prepared using tap water collected from the Department of Chemistry at the Universidade Federal de Viçosa (UFV) to assess the influence of interfering species on their removal. Conductivity analyses were performed using an AZ® model 86503 meter (Taichung, Taiwan), and redox potential was measured with a Sensoglass platinum ORP electrode, model SRR03 (São Paulo, Brazil), connected to a potentiometer. Subsequently, 50 mg of HC9 (150 ºC, 11 h, and H2O) were added to 20.00 mL of the metal solution. The systems were stirred for 7 h (200 rpm) at room temperature (about 25 ºC). Then, the solutions were filtered through a cellulose acetate membrane with a pore size of 0.45 µm. Finally, the supernatant was analyzed by MIP OES. All analyses were performed in duplicate.
Regeneration and reuse of hydrochar
To assess the regeneration and reuse potential of HC9, 50 mg of the material were added to 20.00 mL of iron or manganese solution (200 mg L-1) and stirred for 7 h (200 rpm) at room temperature (nearly 25 °C). After centrifugation, the solid was separated and washed three times with 10.00 mL of hydrochloric acid or citric acid (0.100 mol L-1), to determine the most effective desorbing solution. Subsequently, the regenerated biochar was reused in new adsorption cycles, with the removal efficiency assessed over three consecutive cycles.
During the development of this proposal, ChatGPT was used exclusively for grammatical review. All ideas and technical content are the sole responsibility of the authors.
Results and Discussion
Characterization of hydrochars
Different hydrochars (HCs) were synthesized through a one-pot hydrothermal process with chemical activation, using phosphoric acid or sodium hydroxide as activating agents, at temperatures of 100 and 200 °C (Figure S1, Supplementary Information (SI) section). The yields obtained (Table S1, SI section) were notably high, all exceeding 50%, with HC3 achieving nearly 70%. Silva et al.33 reported a 63.5% yield in the production of hydrochar from malt bagasse. Fontoura et al.13 reported hydrochar yields ranging from 30 to 50% using malt bagasse as the precursor. Both works employed hydrothermal synthesis methods.
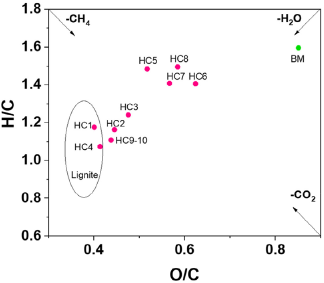
All hydrochars exhibited nitrogen and sulfur contents close to 2%, in agreement with values reported in the literature. Krysanova et al.34 obtained hydrochar with approximately 2% nitrogen using hydrothermal carbonization of deciduous tree sawdust and peat. Regarding the carbon and oxygen content, values were approximately 50 and 30%, respectively. The H/C and O/C ratios were determined and provide insights into the progression of carbonization and the presence of surface functional groups. These data are presented in the Van Krevelen diagram (Figure 1), where a decrease in the H/C ratio of the hydrochars compared to the biomass, confirming the progression of carbonization. These results can be attributed to the hydrolysis and dehydration steps, as well as the loss of aliphatic compounds, which increase the aromaticity of the hydrochar structures.35 There is also a noticeable decrease in the O/C ratio of the HCs relative to the biomass, due to decarboxylation and dehydration reactions that favor the removal of carboxyl and carbonyl groups, consequently resulting in oxygen loss from the biochar structure.36 Similar results were reported by Venkatesan et al.37 According to the authors, the hydrochars exhibited lower H/C and O/C atomic ratios compared to original coffee grounds biomass. These ratios decreased with increasing synthesis temperature, indicating a higher degree of carbonization and enhanced aromaticity in the hydrochars.38 The biomass exhibited the highest H/C and O/C ratios, as it did not undergo hydrothermal treatment. Among the hydrochars, HC5, HC6, HC7, and HC8, synthesized at 100 °C without thermal activation, also showed relatively high H/C and O/C values, indicating a lower degree of carbonization. Moreover, the presence of nitrogen-containing groups (Table S1) in the biochar structure enhances adsorption capacity, as these functional groups can form complexes with metal ions, promote electrostatic interactions and participate in specific chemical bond formations, thereby increasing the retention of heavy metals in aqueous solutions.39

Van Krevelen diagram for the hydrochars and biomass. HC1 (200 °C, 14 h, H3PO4), HC2 (200 °C, 14 h, NaOH), HC3 (200 °C, 8 h, H3PO4), HC4 (200 °C, 8 h, NaOH), HC5 (100 °C, 14 h, H3PO4), HC6 (100 °C, 14 h, NaOH), HC7 (100 °C, 8 h, H3PO4), HC8 (100 °C, 8 h, NaOH), HC9-HC10 (150 °C, 11 h, H2O), BM (biomass).
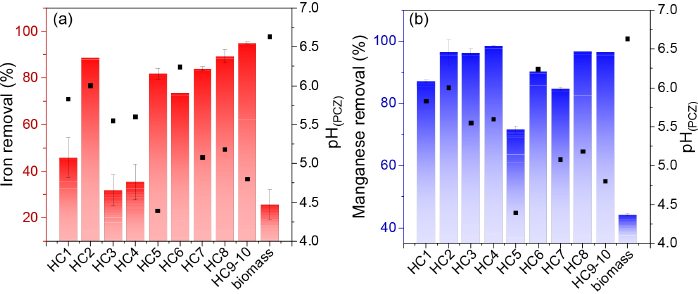
The results for pHPCZ (Table S1) indicate that the materials treated at 200 °C presented very similar characteristics, regardless of the activating agent or the retention time in the oven. At higher temperatures, dehydration, condensation and decarboxylation reactions are intensified, favoring carbonization of the material, which leads to a loss of surface functional groups.13 These reactions contribute to an increase in the surface pH of the material, maintaining values close to 6.0 due to the same synthesis temperature. This behavior is confirmed by the Van Krevelen diagram of HC1 to HC4, synthesized at 200 °C. Similar O/C values across the hydrochars indicate that the proportion of surface oxygenated functional groups is relatively uniform. However, under synthesis conditions of 100 °C and 14 h, the activation agent had a marked influence on the pHPCZ. Activation with phosphoric acid resulted in a value of 4.39, whereas NaOH led to a pHPCZ of 6.24. This difference is likely associated with the introduction of acidic functional groups by H3PO4, which lowers the pHPCZ, as opposed to the basic functionalities introduced by NaOH.33 Under the same temperature and a retention time of 8 h, the hydrochars exhibited comparable pHPCZ values, around 5. The hydrochars HC9 and HC10, subjected to a temperature of 150 °C and a time of 11 h, exhibited properties very similar to those of biochars HC7 and HC8. Therefore, at milder temperatures and shorter residence times, HC7 and HC8 showed very close pHPCZ values of 5.08 and 5.18, respectively.
Higher synthesis temperatures favored the preservation of Brønsted acidity (Table S1, SI section), as also reported by González-Fernández et al.40 According to the authors, the biochar produced from the biomass of sargassum algae by the hydrothermal process, without chemical activation at 180 ºC, presented a higher concentration of acidic sites compared to the biomass.
The results from the elemental analysis are consistent with the FTIR results (Figure S2, SI section), since different functional groups were observed. Bands near 3300 cm-1 can be attributed to the stretching vibration of hydroxyl groups (ν-OH). The bands at 2900 and 2850 cm-1 can be attributed to the symmetric and asymmetric stretching vibrations of νC(sp3)-H bonds.41 Bands around 1700 cm-1 are assigned to the stretching of νC=O bonds of ketone and amide groups.42 Bands at 1600 and 1450 cm-1 are attributed to the stretching of νC=C bonds in aromatic,43 while the bands at 1038 cm-1 can be assigned to the stretching of νC-O bonds in carboxylic groups.44 Although the spectra are very similar for the different biochars, small band shifts can be observed, which may be attributed to their chemical differences.
The materials were evaluated for the removal of iron and manganese from aqueous systems, with HC2, HC5, HC6, HC7, HC8, and HC9-10 showing the highest removal efficiencies for both metals (Figure 2). Although adsorption is often correlated with the pHPCZ, no clear quantitative relationship was observed in this case, likely because the pHPCZ values of the materials were close to each other and adsorption efficiency is also influenced by other surface characteristics.

Removal of (a) iron and (b) manganese and pH of the hydrochars and biomass. HC1 (200 °C, 14 h, H3PO4), HC2 (200 °C, 14 h, NaOH), HC3 (200 °C, 8 h, H3PO4), HC4 (200 °C, 8 h, NaOH), HC5 (100 °C, 14 h, H3PO4), HC6 (100 °C, 14 h, NaOH), HC7 (100 °C, 8 h, H3PO4), HC8 (100 °C, 8 h, NaOH), HC9 (150 °C, 11 h, H2O).
To assess the factors influencing biochar performance, a statistical analysis of the iron and manganese removal data was carried out using a 23 factorial design. The results are shown in Table S2 and Figure 3. The Pareto diagram for iron removal (Figure 3a) reveals that temperature had a significant negative effect on adsorption at the 95% confidence level, indicating that lower temperatures enhance iron removal. Similarly, residence time exerted a negative effect, suggesting that shorter durations favor adsorption. The interaction between temperature and time (T × t) showed a positive effect, whereas the interaction between temperature and activating agent (T × AA) exhibited a negative effect. All other variables were found to be statistically not significant. According to the Pareto diagram for iron removal (Figure 3b), all three variables were significant at the 95% confidence level. Temperature and residence time exerted positive effects, indicating that higher temperatures and longer durations enhance adsorption. In contrast, the activating agent showed a negative effect, suggesting that its presence reduces adsorption efficiency. Additionally, the interaction between temperature and activating agent (T × AA) displayed a positive effect. All other variables were not significant.
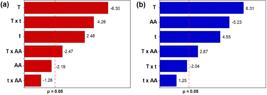
Pareto diagram for the 2³ factorial design (a) iron and (b) manganese, with independent variables (1) temperature (T), (2) time (t), and (3) activation agent (AA). The point at which the estimated effects are statistically significant (p = 0.05) is indicated by the red dashed vertical line.
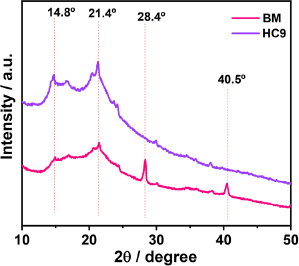
As HC9 showed the best performance for both metals without the use of any activating agent, further characterizations were conducted on HC9 (150 °C, 11 h, non-activated) and BM to elucidate its superior performance. As shown in Figure 4, both materials exhibited a broad diffraction peak between 2θ = 15° and 30°, characteristic of the amorphous structure of biochars.7 However, defined peaks at 2θ equal to 28.4º and 40.5º are observed in the biomass, which can be attributed to KCl (JCPDS 4-587). These peaks are absent in the hydrochar, likely due to the reduction of KCl content during carbonization, as this compound tends to volatilize at elevated temperatures.45
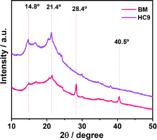
X-ray diffraction analysis of BM (banana peel biomass) and HC9 (150 °C, 11 h, without chemical activation).
A peak at 2θ = 14.8° is also observed in both the hydrochar and biomass, typically associated with the presence of cellulose in the materials.46 Additionally, a peak at 2θ = 21.4° is observed, which can be attributed to the presence of silica and amorphous carbon in the materials.47 It is worth noting that the absence of KCl peaks (28.4° and 40.5°) in the HC9 material can be attributed to the volatilization or removal of inorganic salts during HTC. Devnath et al.48 reported that monoatomic ions, such as potassium and chloride, are preferentially dissolved in the liquid phase during HTC. Furthermore, EDS (Figure S3) analysis showed a significant decrease in the potassium signal, supporting the assumption of potassium loss during carbonization. As the residual amount is considerably reduced, it may no longer be detectable in XRD analysis.
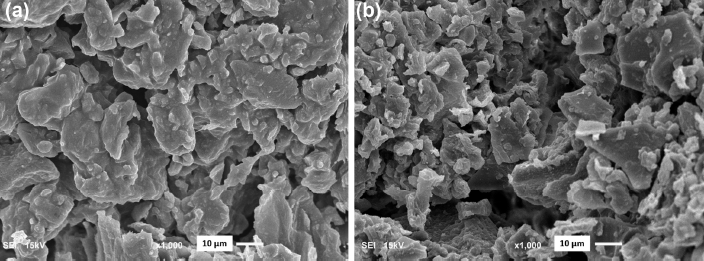
The scanning electron microscopy (SEM) analysis was performed on BM and HC9 (Figure 5). After hydrothermal treatment, the structure of the material became more fragmented and developed a plate-like morphology. The biomass surface appears smoother and thicker, contrasting with HC9, which exhibits a rougher, finer texture and increased fragmentation. Energy dispersive X-ray spectroscopy (EDS) characterization (Figure S3) revealed the presence of potassium in both materials. Similar results were reported by Behbahan et al.49 who produced modified biochars derived from banana peel for pesticide removal. An increase in the peaks corresponding to carbon was also observed in the hydrochar, consistent with CHNS analysis results, which showed a carbon content of 57% for HC9, compared to 42% in the biomass.
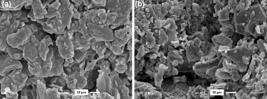
Scanning electron microscopy (SEM) images (magnification ×1000) of (a) BM (banana peel biomass) and (b) HC9 (150 °C, 11 h, without chemical activation).
The zeta potential of the biomass and HC9 was evaluated (Figure S4, SI section), revealing that both materials exhibit negative zeta potential values across the entire pH range evaluated (2 to 12), indicating negatively charged surfaces under both acidic and basic conditions. This indicates that the surface of the material is negatively charged within this pH range. It is also observed that, for all materials, the zeta potential decreased as the pH of the solutions increased. This occurs due to the deprotonation of functional groups present on the surface of these materials, increasing the negative charges, which favors interaction with cations.50 Additionally, as the absolute value of the zeta potential increases, the repulsions between the particles of the materials increase, due to the increase in the negative surface charges. Therefore, particle dispersion increases, enhancing removal efficiency due to greater contact between the adsorbent and the adsorbate.51
Nitrogen physisorption analysis was conducted for the biomass and HC9, with the results shown in Figure 6. Both materials exhibit reversible type IV isotherms, characteristic of mesoporous structures with pore diameters ranging from 2 to 50 nm. The isotherms display an H3-type hysteresis loop, typically associated with slit-shaped pores and indicating capillary condensation in non-rigid aggregates of plate-like particles. The absence of a limiting adsorption plateau at high relative pressures (P/Po) further supports the presence of open mesoporous structures.52 According to the textural analysis results (Table S3), both the biomass and HC9 exhibited low specific surface areas. However, HC9 showed a slightly higher surface area compared to the biomass. Although the BET surface areas of the hydrochars are low (0.141 and 0.156 m2 g-1), their adsorption capacities are relatively high. This apparent discrepancy can be explained by the surface chemistry of the materials. The presence of oxygen-containing functional groups, such as hydroxyl and carboxyl groups, as well as nitrogen-containing amino groups introduced during hydrothermal carbonization, provides active sites for metal ion binding.53 This is analogous to the funnel effect observed in reverse osmosis membranes,54 where the presence of non-porous regions influences water transport. Therefore, even without a large total surface area, surface chemistry can dominate adsorption by offering strategic sites for molecules or ion binding. Chambers et al.55 also reported a low specific surface area (1.97 m2 g-1) for hydrochar from corn straw residues.
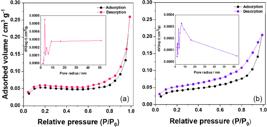
Nitrogen physisorption analysis (a) BM (banana peel biomass) and (b) HC9 (150 °C, 11 h, without chemical activation).
Application of hydrochar in the removal of Fe2+ and Mn2+ in aqueous systems
The effect of pH on the adsorption of iron and manganese ions is shown in Figures 7a-7b. For both metal solutions, pH values above 5 could not be evaluated due to the onset of metal precipitation under these conditions. At lower pH values (e.g., pH 2), a marked decrease in adsorption efficiency was observed. This behavior can be explained by the pHPZC of HC9, which is 4.8. At pH values below 4.8, the surface of the adsorbent becomes positively charged, leading to electrostatic repulsion between the HC9 surface and the Fe2+ and Mn2+ cations. Additionally, the increased concentration of H+ ions at low pH intensifies competition with metal ions for the available active sites. In contrast, at pH values above 4.8, the surface of HC9 acquires a negative charge, enhancing the electrostatic attraction toward the positively charged metal ions and thereby favoring their removal from solution.24
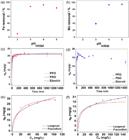
Iron and manganese removal by HC9. (a-b) Influence of the initial pH (24 h, with pH adjustment), (c-d) kinetic study and (e-f) adsorption isotherm (25 °C). General conditions: [Fe] = 10 mg L-1, [Mn] = 10 mg L-1, solution volume: 20 mL, HC9 mass: 50 mg.
The adsorption kinetics of iron and manganese by HC9 are shown in Figures 7c-7d. The initial metal concentrations used (10 and 100 mg L-1) were selected to allow a detailed evaluation of adsorption kinetics and to identify potential limiting factors of the process. The focus was on characterizing the modifications of hydrochar, emphasizing the availability of active sites and the assessment of internal and external diffusion mechanisms. While these concentrations are higher than those typically found in natural waters, they enable the detection of differences in kinetic performance, provide a more comprehensive understanding of the behavior of the adsorbent, and simulate relevant scenarios in industrial effluents, where metal levels often reach elevated values.56 For both metals, the adsorption curves exhibit a rapid initial uptake during the first 50 min, followed by a slower approach to equilibrium, which is reached in less than 200 min. The initial fast phase reflects the abundant availability of active sites on the hydrochar surface, whereas the subsequent slowdown suggests that intraparticle or external diffusion may limit the process. These observations support the suitability of the pseudo-second-order kinetic model, indicating that chemisorption is the predominant mechanism, although physisorption may also contribute.57 It is observed that equilibrium was reached in less than 200 min for both metals. Similarly, Kaveeshwar et al.58 synthesized a biochar from pecan shells via pyrolysis for Fe2+ removal and reported an equilibrium time of 150 min. Kinetic modeling results (Table S4, SI section) indicate that the pseudo-second-order model best describes the adsorption behavior for both iron and manganese, as evidenced by the highest coefficients of determination (R2) and the lowest Akaike Information Criterion (AIC) values. This model suggests that chemisorption is the rate-limiting step, involving electron sharing or exchange between adsorbate and adsorbent, although physisorption may also occur.59 The Elovich model was also applied to experimental data. However, due to the high standard deviations of its fitted parameters, it was not considered suitable. Similarly, Prajapati et al.60 found that the pseudo-second-order model best fitted the experimental data for CrVI adsorption using activated carbon derived from residual Aloe vera leaves via pyrolysis, corroborating the results observed in this work.
The adsorption isotherms for Fe2+ and Mn2+ ions were evaluated, and the results are shown in Figures 7e-7f, with the corresponding model parameters described in Table S5, SI section. For iron, the Langmuir isotherm model provided the best fit to the experimental data, as evidenced by the highest R² and the lowest AIC value. This model assumes monolayer adsorption on a homogeneous surface, and the Kl constant, with a value between 0 and 1, confirms the favorable nature of the adsorption process.61 Sema and Bhattacharyya25 also observed a good fit to the Langmuir model when evaluating iron adsorption using a biochar derived from residual bamboo shoots via pyrolysis. For manganese adsorption, the data presented in Table S5 indicate that the Freundlich isotherm model provided the best fit, as it exhibited the lowest AIC value and the highest R². This model describes adsorption on heterogeneous surfaces with the formation of multilayers, and the Freundlich constant n > 1 further confirms the favorability of the adsorption process.62 The Freundlich model captures adsorption on heterogeneous surfaces, where active sites exhibit different energies, allowing the adsorption capacity to increase continuously without reaching saturation.63 Carbon-based materials functionalized with surface groups have shown significant potential for environmental applications, particularly in the removal of heavy metal ions from aqueous solutions. In these systems, chemical and physical interactions between metal ions and the functional groups of the adsorbent play a key role in determining the adsorption efficiency, as observed for manganese adsorption.64
The difference in the adsorption behavior of Fe and Mn can be attributed to both the surface heterogeneity of the hydrochar and the intrinsic chemical properties of the metals. The Langmuir model describes Fe adsorption, indicating monolayer coverage on relatively homogeneous and specific adsorption sites, likely corresponding to a limited number of high-affinity functional groups on the HC surface. On the other hand, the Freundlich model fits Mn adsorption, suggesting multilayer adsorption on heterogeneous sites. This behavior may arise from the broader range of interactions that Mn2+ can establish with various surface functional groups present on the HC. Moreover, differences in ionic radius, charge density, and coordination chemistry between Fe and Mn can lead to distinct affinities and binding modes, with Mn interacting more variably across the hydrochar surface. Thus, the observed isotherm behavior reflects a combination of metal-specific chemistry and surface site heterogeneity, highlighting the complexity of adsorption mechanisms for different metal ions.
Similarly, in a thermodynamic study on manganese adsorption, Kim et al.65 also found that the Freundlich model best described the experimental data for biochar derived from banana peels via pyrolysis. The maximum adsorption capacities (qmax) obtained for Fe2+ and Mn2+ were 33.18 and 19.00 mg g-1, respectively. Sui et al.66 reported a qmax of 50.02 mg g-1 for Fe2+ adsorption at 25 °C using biochar derived from corn straw via pyrolysis. Similarly, Castro et al.67 found a qmax of 20.14 mg g-1 for manganese adsorption using biochar produced from sugarcane bagasse through pyrolysis.
The effect of interfering substances on the adsorption of Fe2+ and Mn2+ by HC9 was evaluated using solutions prepared with tap water, which naturally contain various ions such as chloride, sodium, calcium, and magnesium.68 This matrix was chosen because the intended application of the hydrochars is the removal of Fe2+ and Mn2+ from drinking water. For this purpose, redox potential and conductivity analyses of the tap water were performed, with the results presented in Table 2. As expected, the conductivity of tap water was significantly higher than that of type II water due to the presence of the aforementioned ions. However, the redox potential values were similar between the two water types. The adsorption capacities (theoretical qe values) of Fe2+ and Mn2+ by HC9 in both type II water and tap water (Table 2) were very similar, indicating that the water matrix exerted minimal influence on the metal adsorption process.
Evaluation of the influence of interfering ions on Fe2+ and Mn2+ adsorption by HC9 (150 °C, 11 h, H2O) using tap water
The high conductivity of tap water (189 µS cm-1) can be attributed to the presence of major ions, which typically include Na+, K+, Ca2+, Mg2+, Cl–, SO42+, HCO3–, and NO3–. Nahar and Zhang69 reported average concentrations in tap water samples are 2.64 mg L-1 for Na+, 0.26 mg L-1 for K+, 10.10 mg L-1 for Ca2+, 1.20 mg L-1 for Mg2+, 3.71 mg L-1 for Cl–, 5.88 mg L-1 for SO42–, 25.86 mg L-1 for HCO3–, and 0.88 mg L-1 for NO3–. The presence of these ions may affect adsorption through (i) direct competition for active sites, (ii) alteration of the ionic strength of the medium, thereby reducing electrostatic interactions, and (iii) complexation with the adsorbate.
Regeneration and reuse assays were conducted to evaluate the reusability of the hydrochars for additional adsorption cycles of iron and manganese (Figure S5a). It was observed that hydrochloric acid solution yielded the best desorption results for both iron and manganese, as the highest concentrations of both metals were recovered. Therefore, reused cycles proceeded using HCl solution for the regeneration of HC9 (Figure S5b). Using HCl, desorption reached 80.2% for manganese and 73.8% for iron, while citric acid resulted in 74.0% desorption for manganese and 65.8% for iron. Based on the reuse cycle results, a decrease in adsorption capacity was observed from 15.73 to 2.74 mg g-1 for iron and from 11.50 to 2.62 mg g-1 for manganese. This reduction in removal efficiency may be due to blockage of the adsorption sites of the hydrochar by hydrochloric acid, which hindered the interaction between the surface and the ions.67 Although efficiency decreased, the experiments used very high concentrations of iron and manganese, which is not typical in real-world applications. Silva et al.70 also reported similar results in their regeneration and reuse experiments with hydrothermally produced hydrochar from citrus fruit waste. The authors identified hydrochloric acid (0.5 mol L-1) as the most effective desorbing agent for CuII ions. Following desorption, the adsorption capacity decreased from 45 to 9 mg g-1, indicating a significant reduction in removal efficiency.
Conclusions
In this work, hydrochars were sustainably synthesized from banana peels via a hydrothermal process conducted at moderate temperatures. The materials were thoroughly characterized using various analytical techniques, which confirmed the occurrence of carbonization while preserving functional groups and Brønsted acid-base sites. Compared to raw biomass, the hydrochars exhibited slightly improved thermal stability and a fragmented, plate-like mesoporous structure, consistent with successful carbonization. For iron and manganese ions removal, the adsorption mechanism involved both physisorption and chemisorption, with chemisorption identified as the rate-limiting step. Iron adsorption followed a monolayer pattern, best described by the Langmuir isotherm, while manganese adsorption occurred in multilayers, as modeled by the Freundlich isotherm. The maximum adsorption capacities were 33.18 mg g-1 for Fe2+ and 19.00 mg g-1 for Mn2+. Importantly, the adsorption performance was not significantly affected when using tap water, indicating that common interfering ions had minimal influence on metal removal efficiency.
Desorption experiments using hydrochloric acid demonstrated the feasibility of regenerating the adsorbent. Although a decline in adsorption capacity was observed upon reuse, the material remains suitable for practical applications, especially considering that real wastewater typically contains metal concentrations lower than those used in this study. Overall, the results highlight the potential of these hydrochars as effective, low-cost, and environmentally friendly adsorbents for the removal of Fe2+ and Mn2+ from aqueous systems. The results obtained from banana peel surpass those typically reported in the literature, highlighting the effectiveness of the hydrothermal approach and the potential of these hydrochars as sustainable, high-performance adsorbents. These findings highlight the novelty of the hydrothermal approach and confirm its potential as a sustainable route for producing high-performance adsorbents. This approach not only adds value to agroindustrial residues by converting them into high-value functional materials, but also aligns with several United Nations Sustainable Development Goals (SDGs), particularly: Good Health and Well-being (SDG 3), Clean Water and Sanitation (SDG 6), and Life Below Water (SDG 14). These findings open opportunities for future studies to further enhance adsorption capacities and to explore the removal of other relevant contaminants in real wastewater systems.
Acknowledgments
We thank the Federal University of Viçosa, the Department of Chemistry, and the Graduate Program in Agrochemistry for the opportunity to pursue graduate studies. We also acknowledge the support from the Foundation for Research Support of the State of Minas Gerais (FAPEMIG) (APQ-00083-21 and RED-00144-22), the National Council for Scientific and Technological Development (CNPq) (Processes 312400/2021-7 and 405828/2022-5), and the Coordination for the Improvement of Higher Education Personnel (CAPES).
Supplementary Information
Data Availability Statement
The authors confirm that the data supporting the findings of this study are available within the text.
References
-
1 Abdullah, N.; Mohd Taib, R.; Mohamad Aziz, N. S.; Omar, M. R.; Md Disa, N.; Heliyon 2023, 9, e12940. [Crossref]
» Crossref -
2 Chen, L.; Mi, B.; He, J.; Li, Y.; Zhou, Z.; Wu, F.; Bioresour. Technol. 2023, 376, 128840. [Crossref]
» Crossref -
3 SEBRAE; Brasil é o 4º Produtor Mundial De Banana; 2023. [Link] accessed in October 2025
» Link -
4 EMBRAPA; Produção Brasileira de Banana em 2023; 2023. [Link] accessed in October 2025
» Link -
5 Acevedo, S. A.; Carrillo, Á. D.; Flórez-López, E.; Grande-Tovar, C. D.; Molecules 2021, 26, 5282. [Crossref]
» Crossref -
6 Castillo, M.; de Guzman, Ma. J. K.; Aberilla, J. M.; Sustainable Prod. Consum. 2023, 37, 356. [Crossref]
» Crossref -
7 Lopes, R. P.; Astruc, D.; Coord. Chem. Rev. 2021, 426, 213585. [Crossref]
» Crossref -
8 Weber, K.; Quicker, P.; Fuel 2018, 217, 240. [Crossref]
» Crossref -
9 Wang, J.; Wang, S.; J. Cleaner Prod. 2019, 227, 1002. [Crossref]
» Crossref -
10 Xu, Y.; Fan, Z.; Li, X.; Yang, S.; Wang, J.; Zheng, A.; Shu, R.; Bioresour. Technol. 2024, 399, 130557. [Crossref]
» Crossref -
11 Zang, J. W.; da Fonseca-Zang, W. A.; Reis, S.; Latin Am. J. Dev. 2021, 3, 2750. [Crossref]
» Crossref -
12 Antero, R. V. P.; Domingos, M. E. G. R.; Suzuki, L. L.; de Oliveira, S. B.; Ojala, S. A.; Mendonça, A. R. V.; Brum, S. S.; Matéria 2019, 24, e-12378. [Crossref]
» Crossref -
13 Fontoura, C. R. O.; Dutra, L. V.; Guezgüan, S. M.; Nascimento, M. A.; Oliveira, A. F.; Lopes, R. P.; J. Anal. Appl. Pyrolysis 2022, 168, 105775. [Crossref]
» Crossref -
14 Aragón-Briceño, C. I.; Pozarlik, A. K.; Bramer, E. A.; Niedzwiecki, L.; Pawlak-Kruczek, H.; Brem, G.; Renewable Energy 2021, 171, 401. [Crossref]
» Crossref -
15 Wilk, M.; Magdziarz, A.; Kalemba-Rec, I.; Szymańska-Chargot, M.; Energy 2020, 202, 117717. [Crossref]
» Crossref -
16 Yu, D.; Peng, H.; Yu, C.; Ji, W.; Wang, X.; Pu, S.; J. Earth Sci. 2025, 36, 1226. [Crossref]
» Crossref -
17 Nkele, K.; Mpenyana-Monyatsi, L.; Masindi, V.; J. Cleaner Prod. 2022, 377, 134152. [Crossref]
» Crossref -
18 Rudi, N. N.; Muhamad, M. S.; Te Chuan, L.; Alipal, J.; Omar, S.; Hamidon, N.; Abdul Hamid, N. H.; Mohamed Sunar, N.; Ali, R.; Harun, H.; Heliyon 2020, 6, e05049. [Crossref]
» Crossref -
19 Alomar, T.; Hameed, B. H.; Al-Ghouti, M. A.; Almomani, F. A.; Han, D. S.; J. Water Process Eng. 2024, 64, 105616. [Crossref]
» Crossref -
20 do Nascimento, R. F.; de Lima, A. C. A.; Vidal, C. B.; Melo, D. Q.; Raulino, G. S. C.; Adsorção: Aspectos Teóricos e Aplicações Ambientais; Imprensa Universitária, Universidade Federal do Ceará: Fortaleza, 2014. [Crossref]
» Crossref -
21 Pak, S.-H.; Park, S.-M.; An, J.; Park, C.; Desalin. Water Treat. 2018, 123, 150. [Crossref]
» Crossref -
22 John, B.; Krishnan, D.; Athira, S.; Amsi, A.; Anukrishnan, S.; Maya, T. M. V.; Krishnan, K. A.; Int. J. Biol. Macromol. 2024, 279, 134963. [Crossref]
» Crossref -
23 Quansah, J. O.; Obiri-Nyarko, F.; Karikari, A. Y.; J. Contam. Hydrol. 2024, 260, 104283. [Crossref]
» Crossref -
24 Brishti, R. S.; Kundu, R.; Habib, Md. A.; Ara, M. H.; Results Chem. 2023, 5, 100727. [Crossref]
» Crossref -
25 Sema, A. I.; Bhattacharyya, J.; J. Indian Chem. Soc. 2022, 99, 100791. [Crossref]
» Crossref -
26 Chandraratne, M. R.; Gezae Daful, A.; Hydrothermal Conversion of Lignocellulosic Biomass to Hydrochar: Production, Characterization, and Applications; IntechOpen, 2024, ch. 7. [Crossref]
» Crossref -
27 Alaboodi, A. S.; Sivasankaran, S.; Ammar, H. R.; Heliyon 2024, 10, e34676. [Crossref]
» Crossref - 28 Excel, 16.0; Microsoft, USA, 2019.
- 29 Statistica 7.0; StatSoft, Tulsa, OK, USA, 2003.
- 30 Origin Pro, version 9.8; OriginLab, Northampton, USA, 2021.
-
31 Skoog, D. A.; West, D. M.; Holler, F. James.; Crouch, S. R.; Fundamentals of Analytical Chemistry; Brooks/Cole, Cengage Learning, 2013. [Crossref]
» Crossref -
32 Portet, S.; Infect. Dis. Modell. 2020, 5, 111. [Crossref]
» Crossref -
33 Silva, A. A. S.; Bousada, G. M.; Mazzini, L. F. M.; Guezguan, S. M.; de Freitas, C. P. M.; Monteiro, K. A.; dos Santos Renato, N. S.; Moreira, R. P. L.; J. Anal. Appl. Pyrolysis 2024, 183, 106707. [Crossref]
» Crossref -
34 Krysanova, K.; Krylova, A.; Kulikova, M.; Kulikov, A.; Rusakova, O.; Fuel 2022, 328, 125220. [Crossref]
» Crossref -
35 Akbari, A.; Peighambardoust, S. J.; Lotfi, M.; J. Water Process Eng. 2023, 55, 104099. [Crossref]
» Crossref -
36 Ali Khan, M.; Hameed, B. H.; Raza Siddiqui, M.; Alothman, Z. A.; Alsohaimi, I. H.; J. King Saud Univ. Sci. 2022, 34, 101941. [Crossref]
» Crossref -
37 Venkatesan, S.; Baloch, H. A.; Jamro, I. A.; Rafique, N.; J. Water Process Eng. 2022, 49, 103037. [Crossref]
» Crossref -
38 Pan, T.; Guo, Z.; Zhang, X.; Feng, L.; J. Cleaner Prod. 2024, 457, 142386. [Crossref]
» Crossref -
39 Lin, H.; Xie, J.; Dong, Y.; Liu, J.; Meng, K.; Jin, Q.; J. Environ. Chem. Eng. 2025, 13, 116681. [Crossref]
» Crossref -
40 González-Fernández, L. A.; Medellín-Castillo, N. A.; Navarro-Frómeta, A. E.; Castillo-Ramos, V.; Sánchez-Polo, M.; Carrasco-Marín, F.; Environ. Res. 2024, 261, 119651. [Crossref]
» Crossref -
41 Ribeiro, M. R.; Guimarães, Y. M.; Silva, I. F.; Almeida, C. A.; Silva, M. S. V.; Nascimento, M. A.; da Silva, U. P.; Varejão, E. V.; Renato, N. S.; Teixeira, A. P. C.; Lopes, R. P.; J. Environ. Chem. Eng. 2021, 9, 105367. [Crossref]
» Crossref -
42 Cui, D.; Zhang, B.; Liu, Y.; Wu, S.; Wang, X.; Wang, Q.; Zhang, X.; Fattahi, M.; Zhang, J.; J. Anal. Appl. Pyrolysis 2024, 183, 106777. [Crossref]
» Crossref -
43 Liu, X.; Peng, L.; Deng, P.; Xu, Y.; Wang, P.; Tan, Q.; Zhang, C.; Dai, X.; Bioresour. Technol. 2025, 415, 131665. [Crossref]
» Crossref -
44 Tafete, G. A.; Uysal, A.; Habtu, N. G.; Abera, M. K.; Yemata, T. A.; Duba, K. S.; Kinayyigit, S.; Int. J. Electrochem. Sci. 2024, 19, 100827. [Crossref]
» Crossref -
45 Kaur, P.; Sharma, N.; Kaur, K.; Pedosphere 2023, 33, 463. [Crossref]
» Crossref -
46 Nizamuddin, S.; Qureshi, S. S.; Baloch, H. A.; Siddiqui, M. T. H.; Takkalkar, P.; Mubarak, N. M.; Dumbre, D. K.; Griffin, G. J.; Madapusi, S.; Tanksale, A.; Materials 2019, 12, 403. [Crossref]
» Crossref -
47 Minaei, S.; Zoroufchi Benis, K.; McPhedran, K. N.; Soltan, J.; Chem. Eng. Res. Des. 2023, 190, 407. [Crossref]
» Crossref -
48 Devnath, B.; Khanal, S.; Shah, A.; Reza, T.; Environments 2024, 11, 150. [Crossref]
» Crossref -
49 Behbahan, A. K.; Mahdavi, V.; Roustaei, Z.; Bagheri, H.; Food Chem. 2021, 360, 130085. [Crossref]
» Crossref -
50 Tan, Z.; Yuan, S.; Hong, M.; Zhang, L.; Huang, Q.; J. Hazard. Mater. 2020, 384, 121370. [Crossref]
» Crossref -
51 Zhu, C.; Zhang, J.; Huang, G.; Zhu, D. Z.; Biochem. Eng. J. 2024, 212, 109527. [Crossref]
» Crossref -
52 Thommes, M.; Kaneko, K.; Neimark, A. V.; Olivier, J. P.; Rodriguez-Reinoso, F.; Rouquerol, J.; Sing, K. S. W.; Pure Appl. Chem. 2015, 87, 1051. [Crossref]
» Crossref -
53 Zhou, F.; Li, K.; Hang, F.; Zhang, Z.; Chen, P.; Wei, L.; Xie, C.; RSC Adv. 2022, 12, 1885. [Crossref]
» Crossref -
54 Xu, Y.; Qiu, Z.; Chen, J.; Ma, B.; Zou, W.; Yang, Z.; Dai, R.; Energy Environ. Sustainable 2025, 1, 100003. [Crossref]
» Crossref -
55 Chambers, C.; Nagar, H.; Sharma, S.; Toufiq Reza, M.; J. Anal. Appl. Pyrolysis 2023, 176, 106243. [Crossref]
» Crossref -
56 Li, N.; Zhu, F.; Wang, Z.; Wu, J.; Gao, Y.; Li, K.; Zhao, C.; Wang, X.; Waste Manage. 2025, 197, 25. [Crossref]
» Crossref -
57 Hu, Q.; Ma, S.; He, Z.; Liu, H.; Pei, X.; J. Water Process Eng. 2024, 60, 105241. [Crossref]
» Crossref -
58 Kaveeshwar, A. R.; Ponnusamy, S. K.; Revellame, E. D.; Gang, D. D.; Zappi, M. E.; Subramaniam, R.; Process Saf. Environ. Prot. 2018, 114, 107. [Crossref]
» Crossref -
59 Burbano, A. A.; Gascó, G.; Horst, F.; Lassalle, V.; Méndez, A.; Biomass Bioenergy 2023, 172, 106772. [Crossref]
» Crossref -
60 Prajapati, A. K.; Das, S.; Mondal, M. K.; J. Mol. Liq. 2020, 307, 112956. [Crossref]
» Crossref -
61 Ahmed, M. M. M.; Liao, C.-H.; Liu, Y.-T.; Venkatesan, S.; Hsieh, Y.-C.; Nail, H. M.; Wang, H.-M. D.; Lin, M.-C.; Jien, S.-H.; Tzou, Y.; J. Cleaner Prod. 2024, 144267. [Crossref]
» Crossref -
62 Prasannamedha, G.; Kumar, P. S.; Mehala, R.; Sharumitha, T. J.; Surendhar, D.; J. Hazard. Mater. 2021, 407, 124825. [Crossref]
» Crossref -
63 Khanzada, A. K.; Al-Hazmi, H. E.; Kurniawan, T. A.; Majtacz, J.; Piechota, G.; Kumar, G.; Ezzati, P.; Saeb, M. R.; Rabiee, N.; Karimi-Maleh, H.; Lima, E. C.; Mąkinia, J.; Sci. Total Environ. 2024, 945, 173972. [Crossref]
» Crossref -
64 Yang, X.; Wan, Y.; Zheng, Y.; He, F.; Yu, Z.; Huang, J.; Wang, H.; Ok, Y. S.; Jiang, Y.; Gao, B.; Chem. Eng. J. 2019, 366, 608. [Crossref]
» Crossref -
65 Kim, H.; Ko, R.-A.; Lee, S.; Chon, K.; Water 2020, 12, 1173. [Crossref]
» Crossref -
66 Sui, L.; Tang, C.; Du, Q.; Zhao, Y.; Cheng, K.; Yang, F.; J. Environ. Sci. 2021, 106, 116. [Crossref]
» Crossref -
67 de Castro, A. E.; Penido, E. S.; Souza, T. F.; Camargos, J. B.; Lobato, R. L. M.; Ribeiro-Soares, J.; Ferreira, G. M. D.; Ferreira, G. M. D.; J. Environ. Chem. Eng. 2023, 11, 110761. [Crossref]
» Crossref -
68 Ingin, Y. P.; Mahringer, D.; El-Athman, F.; Appl. Food Res. 2024, 4, 100600. [Crossref]
» Crossref -
69 Nahar, Mst. S.; Zhang, J.; Environ. Geochem. Health 2012, 34, 141. [Crossref]
» Crossref -
70 da Silva, M. D.; Schnorr, C.; Lütke, S. F.; Silva, L. F. O.; Manera, C.; Perondi, D.; Godinho, M.; Collazzo, G. C.; Dotto, G. L.; Environ. Sci. Pollut. Res. 2023, 30, 63661. [Crossref]
» Crossref
Edited by
-
Editor handled this article:
Josué Carinhanha Caldas Santos (Associate)