Pilot Study on Adulteration in Extra Virgin Olive Oil: A Multiblock Approach to Relate Gas Chromatography, Digital Imaging, and Spectroscopy
Abstract
Analysis of olive oil coloration using ultraviolet-visible (UV-Vis) spectroscopy is an efficient technique for detecting adulterations, offering advantages over traditional methods like gas chromatography (CG) and high-performance liquid chromatography (HPLC) in terms of cost, time, and expertise. The development of a method that integrates fatty acid composition and spectral properties into a portable analytical technique, such as smartphone-based digital image analysis, can enhance cost-effectiveness and environmental friendliness in food quality control. This study aimed to establish this relationship using common dimension analysis (ComDim) on authentic and adulterated extra virgin olive oil (EVOO) samples. Commercially available EVOOs were mixed with refined soybean oil, showing a correlation of 79.18% between techniques for detecting adulterations exceeding 20%. Refined soybean oil was associated with fatty acids stearic, α-linolenic, γ-linolenic, behenic, and the B (blue) color channel, while authentic EVOO samples were correlated with fatty acids palmitic, palmitoleic, 7-hexadecenoic, vaccenic, oleic, arachidic, and with absorbance at 456 nm.
Keywords:
extra virgin olive oil; adulteration; gas chromatography; spectroscopy; digital images
Introduction
In recent years, the consumption of extra virgin olive oil (EVOO) has grown considerably due to its health benefits and its role in the Mediterranean diet.1,2 EVOO is known for its rich composition of monounsaturated fatty acids, especially oleic acid, as well as for the bioactive compounds, such as polyphenols and vitamin E, which confer antioxidant and anti-inflammatory properties.3
However, the increased demand for EVOO has also raised concerns about the authenticity and quality of the product, especially due to the practice of adulteration, in which lower-quality oils are mixed with EVOO to increase profits. This adulteration not only damages consumers, who may not receive the expected benefits of authentic EVOO, but also negatively affects the reputation of the olive oil industry.4,5,6,7
In this context, the authentication and quality of EVOO have become topics of great interest for the scientific community and food industry regulators. Traditional analytical methods, such as gas chromatography and high-performance liquid chromatography, have been widely used to characterize the chemical composition of EVOO8,9 and identify adulterations.10 Nevertheless, these methods are often expensive, time-consuming, and require specialized equipment and expertise. Therefore, there is a growing demand for alternative analytical techniques to detect adulterations in EVOO more quickly, affordably, and effectively.11,12
Another way to assess the freshness, quality, and authenticity of EVOO is through the analysis of its pigments, which belong to two distinct classes, carotenoids and chlorophylls, and play a crucial role in this context. Carotenoids mainly include lutein, β-carotene, neoxanthin, violaxanthin, and other xanthophylls, while chlorophylls consist of chlorophyll a, chlorophyll b, pheophytin a, pheophytin b, and other derivatives. Their presence and quantities not only indicate the origin of the olives and the olive oil production process, but can also be used to differentiate and authenticate different varieties of virgin olive oil. Furthermore, a detailed analysis of the pigments can reveal potential adulterations in EVOO, as inappropriate or excessive concentrations of these pigments may suggest the presence of lower quality or adulterated oils.13
Spectroscopic methods, including near-infrared (NIR) and ultraviolet-visible (UV-Vis) spectroscopy, are established and effective approaches for the identification and quantification of pigments in olive oil. Compared to chromatography, these techniques offer significant advantages, being faster, simpler, and more cost-effective.14 Another alternative is digital image analysis, which is less explored but notable for its adaptability to portable devices such as smartphones, offering a more favorable cost-benefit ratio without compromising samples or generating waste. The use of smartphone cameras follows a similar logic to charge-coupled device (CCD) in spectrophotometers, converting reflected light into electrical signals and becoming an accessible possibility for collecting information through the analysis of sample light reflection.15 Smartphone-based digital image analysis is currently being studied and applied to various vegetable matrices. For example, the essential oil content of bergamot16 and the quality of kiwi during storage17 have already been investigated.
In recent years, the application of chemometrics in food sciences and technology has grown significantly, mainly due to the ease of obtaining and interpreting important information. Common dimension analysis (ComDim) is an unsupervised tool that allows assessing the importance of each technique (salience) in a specific analysis. It provides shared information among techniques in a common dimension, i.e., in global scores.18
Previous studies have evaluated the nutritional quality of extra virgin olive oils,3 analyzed the evolution of pigments,19 and have investigated adulterations in these products, including the use of digital imaging.20
However, multiblock analysis in this context has not been reported to verify the relationship between techniques to discover which characteristic is most strongly related to fatty acids linked to a specific wavelength and RGB (red, green, blue) color channels. Furthermore, as far as we know, this is the first study where ComDim is being used to discriminate between authentic and adulterated extra virgin olive oil. Therefore, it should be emphasized that the advantage of using such an approach is the weighted variance for all the techniques involved.
In this sense, this study aims to establish the relationship among fatty acid composition, the absorbance at 456 nm and RGB color channels through multiblock ComDim analysis, intending to identify which parameters are associated with authentic olive oils and which are associated with adulterated olive oils.
Experimental
Chemicals
Heptane (98%), methanol (99.8%) and analytical standard methyl tricosanoate (97%) were acquired from Sigma-Aldrich (Darmstadt, Hesse, Germany). For chromatographic analysis, all reagents and solvents used were of analytical grade.
Samples
In total, 15 samples of EVOOs (1-15), one sample of refined soybean oil (SO) and one sample of compound oil (CO) were purchased at local supermarkets in Maringá, PR, Brazil. Among them, one was Argentine, two were Brazilian, one was Chilean, five were Spanish, three were Italian, and five were Portuguese, in addition to a sample of EVOO identified as P, which was chosen as the standard after a preliminary analysis by gas chromatography and proved to be in compliance with the European Union regulation on the fatty acid composition for extra virgin olive oils.21 All EVOOs had an intense green coloration, indicating that they originated from green olives, were within the expiration date, kept in their original packaging, refrigerated (between 6 and 10 °C), and were protected from light.
Addition of refined soybean oil in extra virgin olive oil
The standard (P) was intentionally adulterated by adding SO at seven different levels (1, 5, 10, 20, 50, 70, 90% v/v), each with three replicates. This extensive range was selected because previous research22 conducted by our group has detected olive oil adulterated with up to 100% soybean oil. Thus, olive oils produced with yellow olives, even with high levels of adulteration, could go unnoticed. The same applies to green olives, considering that the packaging used for this type of product is amber-colored. The codes described in Figure 1 are employed along with the commercial samples to identify them in all subsequent graphs and additional discussions.

Description of the codes used to identify commercial samples and samples involved in fraud simulation.
Quality criteria analysis
Absorbancy in visible
The absorbances were recorded on the spectrophotometer (Genesys 10-S UV-Vis, Rochester, USA) at the wavelength of 456 nm considering that it is the maximum absorption in extra virgin olive oil23 and it can be assigned to the typical absorption range of chlorophyll (400 to 500 nm)24 while vegetable oils such as refined soybean oil used in this study do not exhibit significant absorption in this region. This is a result of the refining process, particularly the bleaching process, which removes the colored pigments through physical interactions.25 For reading, the samples were transferred to quartz cuvettes without any additional prior manipulation.
Purity criteria analysis
Fatty acid composition
The conversion of the samples into methyl esters was performed following the COI/T.20/Doc. No. 3326 and ISO 12966-2.27 The method consists of mixing 100 mg of the sample with 2.0 mL of n-heptane for 2 min. It was added 0.2 mL of methanolic potassium hydroxide solution 2 mol L-1 and 500.0 μL of methyl tricosanoate standard (23:0, Sigma-Aldrich, Germany) 0.507 g L-1. The samples were analyzed in triplicate.
Gas chromatography (GC) parameters
The analysis of fatty acid methyl esters (FAME) in EVOO and refined SO was conducted using a Thermo Scientific gas chromatograph (GC, Waltham, Massachusetts, USA) equipped with a flame ionization detector (FID), split/splitless injector, and a CP-7420 fused silica capillary column (select FAME, Waltham, Massachusetts, USA) with dimensions of 100.0 m length, 0.25 mm internal diameter, and a 0.25 μm cyanopropyl thin film as the stationary phase. The operational parameters were set as follows: the column temperature was initially held at 165 °C for 18 min, then raised to 235 °C at a rate of 4 °C per min and maintained for an additional 20-min period. The injector and detector temperatures were maintained at 230 and 250 °C, respectively. The carrier gas (H2) had flow rate of 1.2 mL min-1, and the make-up gas (N2) was set at 30 mL min-1. The gas flow rates in the FID were 30 mL min-1 for hydrogen (H2) and 300 mL min-1 for synthetic air. Samples were injected in split mode with a ratio of 40:1, and the injection volume was 1.0 μL. Fatty acids were identified by comparing their retention times with standards.
Fatty acid methyl esters quantification
The analysis was conducted by determining the relative percentage area, in accordance with the technical regulations for the identity and quality of oils and fats,28 utilizing ChromQuest software (Thermo Fisher Scientific, version 5.0, Maringá, 2024).
Digital images
Acquisition
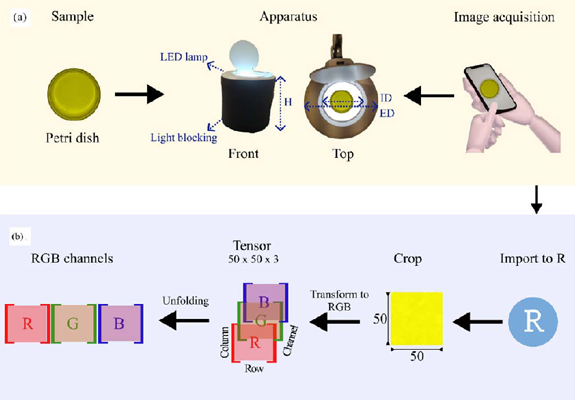
For capturing the images, a 24 W ring light emitting diode (LED) with a color temperature of 6000 to 6500 K was used, supported on a bench, which allowed for maintaining a fixed distance (H) of 15 cm between the smartphone and the sample for all samples. The ring light has external diameter (ED) of 23 cm and internal diameter (ID) of 12 cm.
A black ethylene vinyl acetate (EVA) wrap was designed to cover the external diameter of the ring light to ensure uniform illumination for all samples and to prevent light reflection. A white surface was kept in the background to avoid interfering with the color of the sample.
Petri dishes measuring 6.0 × 1.5 cm (diameter × height) were completely filled with the samples and inserted one by one through the opening without altering the initial configuration of the setup, as shown in Figure 2a. A POCO F5 Pro smartphone with the Android 13 operating system, MIUI 14 for POCO, and Snapdragon 8 Plus Gen 1 processor was used for image capture. The main sensor, which features a 1/2”, 64 MP (megapixel) resolution and optical image stabilization (OIS), was utilized. The images were acquired in triplicate and the average was used.

Processing
The images were imported into the R software version 4.3.0.29 All the image processing steps described below were performed using the Imager package. An area of 50 × 50 pixels was selected in each image. These cutouts were converted into the RGB color channels, generating a 50 × 50 × 3 array (tensor), where 50 is the number of pixels used for each image, and 3 corresponds to the variable channels R, G, and B, which were normalized to take values varying from 0 to 1 (0 for lack of color, 1 for maximum color intensity).30 Subsequently, the tensor was split, resulting in three matrices (R matrix, G matrix, and B matrix), as illustrated in Figure 2b.
From these matrices, three histograms were generated, representing the red (R), green (G), and blue (B) color components, illustrating the frequency of intensity values for each color channel. Finally, each matrix was vectorized and placed side by side, resulting in RGB vectors with the dimension of 1:7500. Then, the vectors obtained for each image were organized one below the other, generating a data hypermatrix (25:7500), where chemometric analysis was applied.
Chemometric analysis
Software
The data obtained were evaluated in R software (version 4.3.0).29 The ComDim analysis was conducted using the MBAnalysis package.31,32
ComDim
ComDim is derived from the “common components and apecific weights analysis” (CCSWA), initially applied by Qannari et al.33 for sensory analysis.34 Currently, it has been employed to fuse various analysis approaches on a set of samples with the purpose of making comparisons among them.35
Before applying ComDim, the data were organized into three blocks, each containing data related to a specific technique. Block 1 was composed of the digital image data (25:7500), block 2 was composed of gas chromatography data (25:11), and block 3 was composed by the absorbances read at 456 nm (25:1), resulting in a matrix with dimensions 25:7512.
Data fusion is generally classified in three different categories depending on the combination in which the data aremerged: low-level, mid-level and high-level. The fusion is considered as low-level if the raw data are used as input, while it is named as mid-level when the extracted features of the data are used in place of the raw data. High-level is achieved when the data are combined at the classification/ prediction decision level.36 In this manner, the ComDim approach was used here as a low-level method, since the data were used in their raw form.
The first step to apply ComDim involves the iterative calculation of the weighted sum of the variance-covariance matrices, where the initial iteration, a weight (or “salience”) equal to 1, is assigned to all tables (blocks), and the first normalized principal component as the common dimension (CD) is extracted from the resulting matrix. The weights indicate the relevance assigned to each block in the CD.
The values obtained for the first CD are used to calculate a new weight estimate, which will be used for the calculation of the subsequent CD. The process is repeated until convergence of the fit is achieved. Thus, the tool allows for the identification of common dimensions among the involved techniques and their contribution in these spaces.
Results and Discussion
Analysis of the color histograms
Figure 3a shows the histograms of the R, G, and B channels for the standard sample (P) and standard samples with different proportions of refined soybean oil (S1, S5, S10, S20, S50, S70, and S90), as well as refined soybean oil (SO). Figure S1 (presented in Supplementary Information (SI) section) displays the images of the cutouts from adulterated EVOO samples at different levels and commercial samples from different brands. Figure 3b shows the histograms of the commercial samples of EVOO and CO.

Histograms of the R, G, and B channels for (a) standard sample (P) and standard samples with different proportions of soybean oil (S1, S5, S10, S20, S50, S70, and S90), as well as soybean oil (SO) and (b) commercial samples of EVOO and compound oil (CO).
The intensities in the R, G, and B channels for the standard sample, as well as for the samples adulterated with refined soybean oil and pure refined soybean oil (Figure 3a), ranged from 0.620 and 0.698 in the R channel and between 0.612 and 0.698 in the G channel. In the B channel, the standard sample (P) and fraud simulations with refined soybean oil, ranging from 1 to 70% (S1 to S70), exhibited similar intensities ranging from 0.035 to 0.114. Generally, as the amount of refined soybean oil increased, the frequencies at higher levels decreased. However, the observed intensity for the sample with 90% refined soybean oil (S90) and for pure refined SO were more frequent at 0.198 and 0.438, respectively.
For the EVOO and CO samples (Figure 3b), the intensities ranged between 0.600 and 0.714 in the R channel and between 0.573 and 0.694 in the G channel. In the B channel, intensities varied from 0.039 to 0.102 for the EVOO samples, while higher intensity was observed for the CO sample, with more common frequency at 0.218, comparable to the intensity found in the sample adulterated with 90% refined soybean oil (S90), as confirmed by Table S3 (SI section), which represents the means and standard deviations for color intensity in the R, G, and B channels. The intensity means of samples S90 and CO in the R, G, and B channels were statistically equal, while sample SO showed significant differences compared to all other samples (p < 0.05) in the B channel, according to the Tukey’s test.
Thus, the results indicate that the B channel plays a crucial role in the color variations identified by digital image analysis. This is evidenced by the observation of higher intensities for samples with 90% refined soybean oil and even higher for pure refined soybean oil. Further details on the effect of color variations are presented in relation to the variables of the other techniques, as discussed below.
ComDim
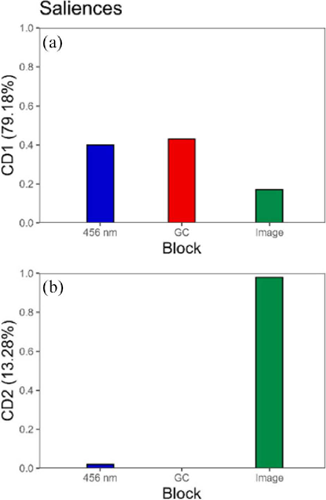
The first common dimension (CD1) explained 79.18% of the data variance, while CD2 explained 13.28%. One notable advantage is the ability to obtain information about the salience of each technique (block), highlighting its importance and variability across each dimension.The saliences were calculated for each CD and are presented in Figure 4a for CD1 and Figure 4b for CD2. In other words, when the saliences are similar, it is possible to establish correlations among the techniques.37,38 The CD1 shows significant saliences for the three techniques together (the absorbance in 456 nm, gas chromatography and image), while in CD2 the image is likely to be the only important technique. This result indicates that it is more suitable to use CD1 results to investigate the relation among techniques.

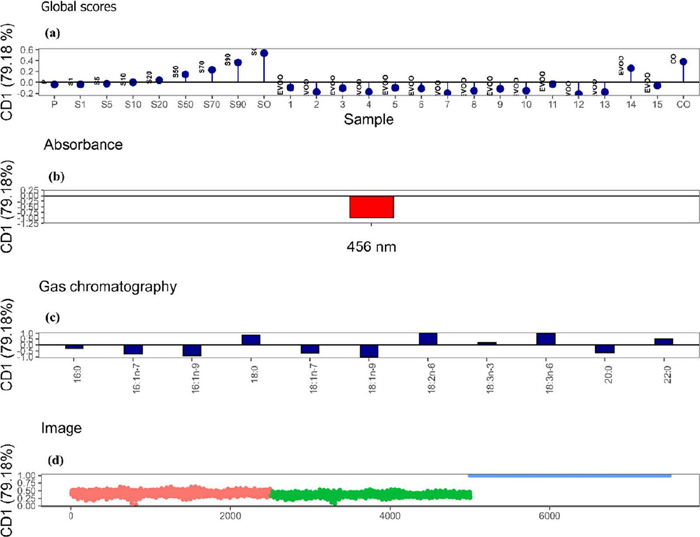
The overall scores provided information about similarities/differences among the samples concerning CD1 (Figure 5a) and CD2 (Figure 6a) and the origins of variables responsible for the similarities and differences observed in the samples through loadings concerning CD1 (Figures 5b-5d) and CD2 (Figure 6b).

Multiblock analysis (ComDim) results for CD1 include: (a) global scores and loadings, (b) absorbance, (c) gas chromatography, and (d) image.

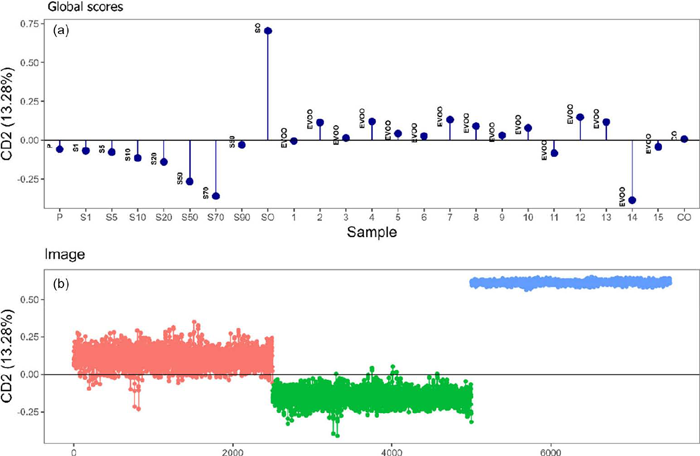
Multiblock analysis (ComDim) results for CD2 include: (a) global scores and loadings, (b) image.
The global scores for CD1 (Figure 5a) show sample differences regarding the composition of oils and olive oils, highlighting that samples with higher positive scores in CD1 are associated with larger amounts of refined soybean oil. This pattern is exemplified by pure refined SO, which achieved the highest score (0.539). Additionally, the presence of SO is noticeable when its proportion is equal to or greater than 20% (S20, 0.038), as samples S1 and S5 had negative scores (–0.038 and –0.024 respectively), while S10 was positioned near the axis (0.000). The loadings for CD1 are presented in Figures 5b-5d for absorbance in 456 nm, GC, and for the image, respectively. In CD1, the relationship between the samples (Figure 5a) and the variables (Figures 5b-5d) is established by observing the positive or negative direction in which they are depicted.
Therefore, the EVOO samples, located on the negative side, were directly influenced by absorbance at 456 nm (Figure 5b), as expected, since this wavelength falls within the blue visible spectrum, where the absorption of chlorophylls occurs.39 The average (means) and standard deviations for the absorbance are presented in Table S1 (SI section).
The sample SO does not absorb light at 456 nm since it is a refined oil and, thus, had its pigments removed. As its concentration increases in the EVOO sample, the absorption at this wavelength decreases. According to the results presented in Table S1, this reduction in absorption is observed only when refined SO is added in equal or greater amounts than 5%. The amount of pigments identified in sample CO did not differ significantly from the sample adulterated by 70%, just as sample 14 did not differ from the sample adulterated by 50%.
The samples SO, S1-S90, CO, and 14, located on the positive side, are directly influenced by stearic acid (18:0), linoleic acid (18:2n-6), α-linolenic acid (18:3n-3), γ-linolenic acid (18:3n-6) and behenic acid (22:0). On the other hand, the EVOO samples were positioned with negative score values, being directly associated with palmitic acid (16:0), palmitoleic acid (16:1n-7), 7-hexadecenoic acid (16:1n-9), vaccenic acid (18:1n7), oleic acid (18:1n-9), and arachidic acid (20:0), as shown in Figure 5c.
EVOO is predominantly composed of monounsaturated fatty acids (MUFA), with oleic acid representing the majority (55-85%), followed by palmitic acid (7.50-20%), according to the standards established by the International Olive Council (IOC).26 This composition gives EVOO greater resistance to oxidation due to the lower number of double bonds in the fatty acids, making it more stable when exposed to heat, light, and other factors.40 Refined SO, otherwise, is characterized by higher presence of polyunsaturated fatty acids (PUFA), such as linoleic acid, compared to saturated fatty acids (SFA) and MUFA.41
Therefore, the ratio between oleic acid and linoleic acid can be considered an indicator of adulteration, as they are present in SO in smaller and larger quantities, respectively.42 The means and standard deviations for the compositionof fatty acids are presented in Table S2 (SI section). With the exception of sample 14, the EVOO samples exhibited distribution of fatty acids in compliance with European Union regulations.21 Oleic acid, classified as monounsaturated, was the most abundant fatty acid in these samples, followed by palmitic acid and linoleic acid in decreasing order. Additionally, the ratio of oleic acid to linoleic acid approached 5, as expected for EVOO. Sample SO showed an oleic/linoleic acid ratio of less than 1, so as we increase the level of adulteration (S1-S90), this ratio also decreases.
Both sample 14 and CO caused a decrease in the amount of oleic acid below the 55% limit established for EVOO. On the other hand, the concentration of linoleic acid significantly increased to over 21%, exceeding the upper limit of 21% set by the European Union regulations.21 This resulted in an oleic/linoleic acid ratio of less than 1. For sample CO, it was expected since it contains a concentration of over 90% of refined soybean oil. Otherwise, sample 14, being an EVOO, did not meet regulatory criteria.
In general, edible oils of the same class exhibit similar chromatogram patterns, regardless of the variety or specific origin of these oils. This first approach allowed for distinguishment based on the classification/identification of EVOO and other categories of edible oils, including EVOO adulterated with refined soybean oil (SO). Thus, subtle differences between these oils of the same category but different brands are not addressed in this work. For example, as evidenced in Table S1, the various EVOOs evaluated contain chlorophylls in their composition, although their quantities may vary between 0.9387 and 1.8600 nm.
For the image analysis technique, the samples containing refined soybean oil were directly related to the R, G, and B color channels, with the B color channel playing a more significant role in this separation (Figure 5d). Carvalho et al.42 found that the most effective models were developed using the G and B color channels for predicting refined soybean oil levels in EVOO and avocado oil.21
According to what was observed by Milanez and Pontes,20 the color channels responsible for differentiating authentic and adulterated EVOO samples vary depending on the brand. In some cases, the variation was observed in the R and G channels, while in other cases it occurred in the G and B channels.43 In order to eliminate this variation, the strategy used by Rios et al.43 involved mixtures of commercial olive oils and mixtures of refined soybean oil from different brands to simulate adulteration. In this context, the R color channel provided the most accurate results in quantifying the olive oil content in the mixtures.44
The spectral ranges covered by the R, G, and B channels are 550-750, 450-650, and 400-550 nm, respectively.30 Therefore, the greater importance attributed to the B channel in our study is likely due to the chlorophylls, which act in opposing (complementary) manner to the B channel, making the detection of these compounds more sensitive. Thus, samples with higher concentrations of refined soybean oil (S90 and CO) and pure refined soybean oil (SO) exhibited higher intensities in this channel, as previously demonstrated and evidenced in the color histograms (Figure 3), as the resulf of the lower concentration of these pigments.
The scores in CD2 (Figure 6a) are attributed to the image analysis (98%) without establishing a relation with the other two techniques. However, it is possible to observe that the image analysis alone demonstrates a trend in separating the samples according to the percentage of adulteration and the type of oil.
In CD2 (Figures 6a) the sample SO stood out on the positive side, while the partially adulterated samples were located with negative values. Observing the variables responsible for this separation in Figure 6b, there is a relationship between sample SO and the R and B channels, with greater importance attributed to the B channel. Additionally, there is an association between the partially adulterated samples and the G color channel.
The color intensities in the R, G, and B channels were the same for samples S70 and 14, as well as the intensities in the G and B channels were equal for samples S90 and CO (Table S3, SI section), a circumstance that highlights the contribution of image analysis to the observed separation in CD1.
The differentiation between authentic and adulterated samples was achieved through ComDim, highlighting the importance of the different techniques used in this study. Furthermore, image analysis was noted for its significant contribution to the observed separation. It is crucial to consider that the consistency and stability of digital analysis results can be affected by the use of different models or batches of smartphones, each equipped with distinct image sensors. Variations in image quality captured across devices can directly impact the accuracy and reliability of the method, especially in applications requiring high resolution and fidelity in detail reproduction. Therefore, further studies are needed to develop robust protocols that minimize these variations, ensuring consistent and reliable application of digital image analysis across various contexts and conditions.
It is also relevant to mention that the distinction between authentic and adulterated EVOOs was obtained regardless of the production region, olive variety used and climatic conditions, suggesting that the addition of refined soybean oil can be perceived through the reduction in the amount of pigments, even under the aforementioned conditions. Thus, this approach could be used to detect the adulteration of extra virgin olive oil with refined vegetable oils, such as those derived from canola, corn, sunflower and cotton.
Conclusions
A strong correlation (79.18%) was achieved between the techniques through multiblock ComDim analysis. This correlation enabled the effective detection of adulterated samples containing over 20% refined soybean oil, while also establishing relationships among fatty acid composition, absorbance at 456 nm and RGB color channels for authentic and adulterated olive oils. The fatty acids responsible for distinguishing samples containing refined soybean oil included stearic acid (18:0), linoleic (18:2n-6), γ (18:3n-6), α (18:3n-3) linolenic, and behenic acid (22:0), these being associated with the color channels obtained by digital imaging, primarily the B channel. The most relevant fatty acids for authentic EVOO samples were palmitic (16:0), palmitoleic (16:1n-7), 7-hexadecenoic (16:1n-9), vaccenic (18:1n-7), oleic (18:1n-9), and arachidic (20:0), all related to the absorbance at 456 nm.
In addition, the importance of image analysis in combination with other established analytical techniques is highlighted. This approach demonstrates its effectiveness, as color plays a crucial role in characterizing olive oil, and visual analysis can identify visible differences that suggest possible adulterations. Furthermore, the use of images offers benefits such as cost reduction and the elimination of solvent use, emphasizing its feasibility and applicability.
Supplementary Information
Supplementary information is available free of charge at http://jbcs.sbq.org.br as PDF file.
Acknowledgments
This work was supported by Conselho Nacional de Desenvolvimento Científico e Tecnológico (CNPq, process 141181/2022-2).
References
-
1 Almanza-Aguilera, E.; Cano, A.; Gil-Lespinard, M.; Burguera, N.; Zamora-Ros, R.; Agudo, A.; Farràs, M.; Semin. Cancer Biol. 2023, 95, 103. [Crossref]
» Crossref -
2 Giuffrè, D.; Giuffrè, A. M.; AIMS Public Health 2023, 10, 568. [Crossref]
» Crossref -
3 Jimenez-Lopez, C.; Carpena, M.; Lourenço-Lopes, C.; Gallardo-Gomez, M.; Lorenzo, J.; Barba, F. J.; Prieto, M. A.; Simal-Gandara, J.; Foods 2020, 9, 1014. [Crossref]
» Crossref -
4 Marrone, G.; Urciuoli, S.; Di Lauro, M.; Ruzzolini, J.; Ieri, F.; Vignolini, P.; Di Daniele, F.; Guerriero, C.; Nediani, C.; Di Daniele, N.; Noce, A.; Nutrients 2022, 14, 4265. [Crossref]
» Crossref -
5 Rojas Gil, A. P.; Kodonis, I.; Ioannidis, A.; Nomikos, T.; Dimopoulos, I.; Kosmidis, G.; Katsa, M. E.; Melliou, E.; Magiatis, P.; Front. Oncol. 2022, 11, 810249. [Crossref]
» Crossref -
6 Vrdoljak, J.; Kumric, M.; Vilovic, M.; Martinovic, D.; Tomic, I. J.; Krnic, M.; Ticinovic Kurir, T.; Bozic, J.; Nutrients 2022, 14, 757. [Crossref]
» Crossref -
7 Rodilla, S. D.; Martínez-Pineda, M.; Yagüe-Ruiz, C.; Vercet, A.; Int. J. Gastron. Food. Sci. 2023, 33, 100771. [Crossref]
» Crossref -
8 Trovato, E.; Russo, M.; Cucinotta, L.; El Majdoub, Y. O.; Testa Camillo, M. R.; De Grazia, G.; Arigò, A.; Sciarrone, D.; Mondello, L.; Dugo, P.; Food Anal. Methods 2023, 16, 1313. [Crossref]
» Crossref -
9 Ariza-Ortega, J. A.; Castañeda-Antonio, M. D.; Ramos-Cassellis, M. E.; Manríquez-Torres, J. J.; Ruíz-Sánchez, M.; Díaz-Reyes, J.; Food and Humanity 2024, 3, 100367. [Crossref]
» Crossref -
10 Knaul, L. E.; Santos, L. M. S.; Ramos, P. M. M.; Cabrera, M. B. R.; Rüdiger, A. L.; Kapp, M. N.; Toci, A. T.; Boroski, M.; J. Braz. Chem. Soc. 2024, 35, e-20240051. [Crossref]
» Crossref -
11 Jabeur, H.; Zribi, A.; Bouaziz, M.; Food Anal. Methods 2016, 9, 712. [Crossref]
» Crossref -
12 Bouymajane, A.; El Majdoub, Y. O.; Cacciola, F.; Russo, M.; Salafia, F.; Trozzi, A.; Filali, F. R.; Dugo, P.; Mondello, L.; Molecules 2020, 25, 5428. [Crossref]
» Crossref -
13 Lu, C. H.; Li, B. Q.; Jing, Q.; Pei, D.; Huang, X. Y.; Food Chem. 2023, 420, 136161. [Crossref]
» Crossref -
14 Jurinovich, S.; Domenici, V.; J. Chem. Educ. 2022, 99, 787. [Crossref]
» Crossref -
15 Xia, D. H.; Song, S.; Tao, L.; Qin, Z.; Wu, Z.; Gao, Z.; Wang, J.; Hu, W.; Behnamian, Y.; Luo, J. L.; J. Mater. Sci. Technol. 2020, 53, 146. [Crossref]
» Crossref -
16 Anello, M.; Mateo, F.; Bernardi, B.; Giuffrè, A. M.; Blasco, J.; Gómez-Sanchis, J.; Ind. Crops Prod. 2024, 220, 119233. [Crossref]
» Crossref -
17 Li, H.; Lv, S.; Feng, L.; Peng, P.; Hu, L.; Liu, Z.; Hati, S.; Bimal, C.; Mo, H.; Foods 2022, 11, 2113. [Crossref]
» Crossref -
18 Cariou, V.; Qannari, E. M.; Rutledge, D. N.; Vigneau, E.; Food Qual. Preference 2018, 67, 27. [Crossref]
» Crossref -
19 Borello, E.; Roncucci, D.; Domenici, V.; Foods 2021, 10, 1891. [Crossref]
» Crossref -
20 Milanez, K. D. T. M.; Pontes, M. J. C.; Anal. Methods 2015, 7, 8839. [Crossref]
» Crossref -
21 Commission Implementing Regulation (EU) No. 1348/2013, of 16 December 2013, Amending Regulation (EEC) No. 2568/91 on the Characteristics of Olive Oil and Olive-Residue Oil and on the Relevant Methods of Analysis; Official Journal of the European Union, 2013, L. 338, p. 31. [Link] accessed in March 2025
» Link -
22 da Silveira, R.; Vágula, J. M.; de Lima Figueiredo, I.; Claus, T.; Galuch, M. B.; Santos Jr., O. O.; Visentainer, J. V.; Food Res. Int. 2017, 102, 43. [Crossref]
» Crossref -
23 Minuceli, F. S.; da Silva, J. M.; da Silveira, R.; Santos, O. O.; Res. Soc. Dev. 2021, 10, e50210612822. [Crossref]
» Crossref -
24 Lichtenthaler, H.; Buschmann, C.; Curr. Protoc. 2001, F4, 3.1. [Crossref]
» Crossref -
25 Chew, S. C.; Ali, M. A.; Trends Food Sci. Technol. 2021, 116, 468. [Crossref]
» Crossref -
26 International Olive Council; COI/T.20/Doc. No 33: Determinationof Fatty Acid Methyl Esters by Gas Chromatography; COI: Madri, 2017. [Link] accessed in March 2025
» Link -
27 ISO 12966-2: Animal and Vegetable Fats and Oils - Gas Chromatography of Fatty Acid Methyl Esters - Part 2: Preparation of Methyl Esters of Fatty Acids; ISO: Geneva, 2017. [Link] accessed in March 2025
» Link -
28 United States Department of Agriculture (USDA), Olive Oil and Olive-Pomace Oil Grades and Standards, https://www.ams.usda.gov/grades-standards/olive-oil-and-olive-pomace-oil-grades-and-standards, accessed in March 2025.
» https://www.ams.usda.gov/grades-standards/olive-oil-and-olive-pomace-oil-grades-and-standards -
29 R Core Team; R: A Language and Environment for Statistical Computing; R Foundation for Statistical Computing, Vienna, Austria, 2024. [Link] accessed in March 2025
» Link -
30 Fan, Y.; Li, J.; Guo, Y.; Xie, L.; Zhang, G.; Measurement 2021, 171, 108829. [Crossref]
» Crossref -
31 Mangamana, E. T.; Glèlè Kakaï, R.; Qannari, E. M.; Chemom. Intell. Lab. Syst. 2021, 217, 104388. [Crossref]
» Crossref -
32 Mangamana, E. T.; Cariou, V.; Vigneau, E.; Glèlè Kakaï, R. L.; Qannari, E. M.; Chemom. Intell. Lab. Syst. 2019, 194, 103856. [Crossref]
» Crossref -
33 Qannari, E. M.; Courcoux, P.; Vigneau, E.; Food Qual. Preference 2001, 12, 365. [Crossref]
» Crossref -
34 Qannari, E. M.; Walkeling, I.; MacFieb, H. J. H.; Food Qual. Preference 1995, 6, 309. [Crossref]
» Crossref -
35 Vieira, T. F.; Makimori, G. Y. F.; Scholz, M. B. S.; Zielinski, A. A. F.; Bona, E.; Food Anal. Methods 2020, 13, 97. [Crossref]
» Crossref -
36 Azcarate, S. M.; Ríos-Reina, R.; Amigo, J. M.; Goicoechea, H. C.; TrAC, Trends Anal. Chem. 2021, 143, 116355. [Crossref]
» Crossref -
37 Mishra, P.; Roger, J. M.; Rutledge, D. N.; Biancolillo, A.; Marini, F.; Nordon, A.; Jouan-Rimbaud-Bouveresse, D.; Chemom. Intell. Lab. Syst. 2020, 205, 104139. [Crossref]
» Crossref -
38 Baqueta, M. R.; Coqueiro, A.; Março, P. H.; Mandrone, M.; Poli, F.; Valderrama, P.; Food Chem. 2021, 355, 129618. [Crossref]
» Crossref -
39 Schoefs, B.; Trends Food Sci. Technol. 2002, 13, 361. [Crossref]
» Crossref -
40 Tian, M.; Bai, Y.; Tian, H.; Zhao, X.; Molecules 2023, 28, 6393. [Crossref]
» Crossref -
41 Siano, F.; Vasca, E.; J. Chem. Educ. 2020, 97, 4108. [Crossref]
» Crossref -
42 de Carvalho, I. M.; da Silva Mutz, Y.; Machado, A. C. G.; Santos, A. A. L.; Magalhães, E. J.; Nunes, C. A.; Foods 2023, 12, 3436. [Crossref]
» Crossref -
43 Rios, C. A.; de Souza, A. M.; Poppi, R. J.; Breitkreitza, M. C.; Quim. Nova 2022, 45, 1167. [Crossref]
» Crossref -
44 Soares, S.; Lima, M. J. A.; Rocha, F. R. P.; Microchem. J. 2017, 133, 195. [Crossref]
» Crossref
Edited by
-
Editor handled this article:
Andréa Rodrigues Chaves