Development of a Process for Hydrolysis of Chicken Blood Meal and Identification of Bioactive Peptides by LC-MS/MS
Abstract
Bioactive peptides play essential roles in living organisms, acting as antioxidants, hormones, and regulators of physiological processes. The hydrolysis of chicken blood meal represents a promising strategy to enhance its nutritional and functional value by generating bioactive compounds with benefits to animal health. In this study, alkaline hydrolysate (AlkH) (NaOH ca. 1.04-2.08 M; ca. 98 °C) and enzymatic (Alcalase) protein hydrolysate (EPH) (pH 8.5; 60 °C) were optimized to maximize the release of water-soluble proteins, peptides, and amino acids while achieving a high degree of hydrolysis. After optimizing each route separately, we performed sequential combined hydrolysis (AlkH→EPH and EPH→AlkH) to test additivity/synergy. The organic nitrogen content was determined by the Kjeldahl method, and degree of hydrolysis (DH) was quantified using the o-phthalaldehyde (OPA). Peptides and amino acids were characterized by liquid chromatography-tandem mass spectrometry (LC-MS/MS), and their potential bioactivities were evaluated through the BIOPEP database (BIOPEP). AlkH produced a broader spectrum of bioactive dipeptides, with optimal conditions of 10% NaOH and 15% substrate for maximum DH, and 5% NaOH with 30% substrate for the highest nitrogen recovery. Identified peptides included angiotensin-converting enzyme (ACE) and dipeptidyl peptidase (DPP-IV) inhibitors.
Keywords:
peptides; amino acids; chicken blood meal; hydrolysis; LC-MS/MS
Introduction
Animal-derived meat is a rich source of proteins that is consumed worldwide, and it is also a source of vitamins A, B-12, riboflavin, calcium, iron, and zinc.1 Due to the increasing global population, there is a growing demand for animal protein, resulting in a significant expansion in meat production.2 Brazil is one of the major global producers of meat, and about 17% of this production is exported.3 The meat industry generates a significant volume of organic waste from slaughtering and processing animals, including blood, fat, and other tissues, some of which are considered environmental pollutants. A common disposal method for these wastes is sanitary landfill, but in some countries, it is prohibited due to the environmental problems it causes.4 A large volume of these wastes consists of effluents with high organic loads, with values ranging from 752 1135 mg L-1 for chemical oxygen demand (COD) and from 120 600 mg L-1 for biochemical oxygen demand (BOD).5
World consumption of chicken meat has increased in the last decade, with about 32.17% of national production being exported in 2021. In the same year, Brazil produced approximately 14.3 million tons of chickens, generating a significant amount of production waste.6 Blood is one of the byproducts generated from the slaughter of these animals, representing about 4% of their body weight.7 These byproducts usually have low added value, which makes their study viable for the development of processes to increase their industrial value.8 Some studies9-11 have been developed in order to find better solutions for the management of these waste products.
One possible way to increase the value of chicken blood byproduct is to hydrolyze its proteins into bioactive peptides which have potential applications in various fields, including functional foods and pharmaceuticals. Chicken blood is processed into meal by some industries for animal feed production, but its intact proteins may have lower absorption due to their high molecular weight and folding.12 Proteins can be hydrolyzed to generate peptides, and their biological activities depends on the protein source and the hydrolysis processes used. Thus, different hydrolysis processes can yield different peptides with specific bioactivities.13-15 To access the peptides liquid chromatography (LC) coupled with tandem mass spectrometry (MS/MS) has been one of the most widely used methods for identifying biopeptides in different types of samples, including hydrolysates of whey protein and other protein sources.16
Proteins can be hydrolyzed (degraded) into peptides and amino acids using acid, alkaline or enzymatic processes. Acid hydrolysis occurs in the presence of substances with low pH, such as sulfuric acid (H2SO4) and is used in the degradation of bird feathers to obtain organic nitrogen, a widely used fertilizer.17 Alkaline hydrolysis is performed in the presence of a substance with a high pH, such as potassium hydroxide (KOH) or sodium hydroxide (NaOH). This type of hydrolysis has been successfully applied to cellulose, where the alkaline treatment disrupts the plant cell matrix, thereby enhancing subsequent enzymatic activity.18 Beyond industrial and biotechnological applications, alkaline hydrolysis has been employed in so-called bio-cremation as an environmentally friendly alternative to traditional burial and cremation methods, in which the body is dissolved until only the bones remain, and the residual solution is neutralized and safely discharged into common sewage systems.19
Enzymatic hydrolysis is a process that uses proteases, enzymes that break the peptide bonds between the amino acids of proteins. Peptidases are divided into two groups: endopeptidases and exopeptidases, which catalyze the hydrolysis of internal and terminal peptide bonds, respectively.20 Alcalase stands out as a protease belonging to the endopeptidase category widely used by the industry due to its high catalytic activity and specificity, as well as its commercial value. The conditions for hydrolysis with Alcalase are mild, with pH between 6 to 8.5 and temperature of 40 to 60 °C, ensuring optimal proteolytic activity. The enzyme/substrate (E/S) ratio is an important factor to be considered, as it directly impacts the degree of hydrolysis (DH) and the peptides produced.21 Literature reports obtaining protein hydrolysates with antioxidant activity in the hydrolysis of chicken blood (Gallus gallus) with Alcalase.22 Enzymatic hydrolysis of bovine hemoglobin produced peptides with antimicrobial action.23 Peptides from the hydrolysis of bovine plasma using Alcalase were able to inhibit the angiotensin I converting enzyme.24
The objective of this study was to optimize enzymatic and alkaline hydrolysis conditions of chicken blood meal, using a 22 factorial design, to maximize total organic nitrogen release and DH to evaluate sequential combinations and identify di-/tripeptides by LC-MS/MS.
Experimental
The chicken blood meal (CBM) was provided by GTFoods company from Maringá, Paraná, Brazil. The raw material was sieved and stored under refrigeration at 20 °C until use. For enzymatic hydrolysis Alcalase enzyme was used (Novozymes Latin America Ltda) and flake sodium hydroxide (NaOH, Êxodo Cientifica) was used for alkaline hydrolysis. The degree of hydrolysis was determined using the orthophthaldehyde 97% (OPA) (Sigma-Aldrich Brazil), Na-dodecyl-sulfate (SDS) (Sigma-Aldrich Brazil), di-Na tetraborate decahydrate (Sigma-Aldrich Brazil) and dithiothreitol 99% (DTT) (Sigma-Aldrich Brazil) reagents. High-performance liquid chromatography (HPLC)-grade acetonitrile (Sigma-Aldrich Brazil) was used for LC-MS/MS analysis, along with formic acid (Acros Organics). Ultrapure water used in the experiments was obtained using a Milli-Q system (Millipore, Billerica, MA).
Proximate analysis of the chicken blood meal
Moisture, ash, and total protein analyses were conducted at the Food Analysis Laboratory of the Federal University of Paraná, Jandaia do Sul Campus, following the protocol described in the literature.25 For moisture analysis, approximately 2 g of the sample were weighed and dried directly in an oven at 105 °C for 3 h. For ash analysis, approximately 5 g of the sample were weighed and heated in a muffle furnace at 550 °C until complete incineration. The residue was then cooled in a desiccator to room temperature and weighed.
Full factorial design
The full factorial design with a central point is a robust methodology widely used for optimizing hydrolysis processes. This statistical approach allows for the identification of the most relevant variables in the experiment. The inclusion of a central point is important for detecting curvature in the regression model, which helps determine whether a linear approximation is appropriate or if higher-order effects need to be considered.26-28
The percentages of enzyme and NaOH, as well as the amount of chicken blood meal, were selected based on an evaluation of the lowest production cost and the minimum amount of reagents needed to achieve effective hydrolysis.
The temperature conditions were based on the literature, according to the ideal temperature for each procedure.29 The hydrolysis time was pre-established to obtain a feasible time for the process that can be used industrially.
For the preparation of the hydrolysates, the hydrolysis conditions were established according to a 22 full factorial design with a central point. In the enzymatic hydrolysis, two independent variables were evaluated: Alcalase concentration (X1) and chicken blood meal concentration (X2). The levels of these variables were defined as follows: Alcalase concentration varied from 0.1% (inferior limit, -1) to 10.0% (superior limit, +1), with a central point at 5.5%, central point rounded to 5.5% to match pipetting accuracy and/or supplier stock solutions. The chicken blood meal concentration ranged from 10.0% (-1) to 20.0% (+1), with a central point at 15.0%. All concentrations were expressed as weight percentage (m/m).
Similarly, for the alkaline hydrolysis, the experimental design included NaOH concentration (hydrolytic agent, X1) and chicken blood meal concentration (X2) as independent variables. The NaOH concentration ranged from 5.0% (-1) to 10.0% (+1), with a central point at 7.5%, NaOH levels corresponded to 1.25, 1.87, and 2.50 g dissolved in 30 mL (ca. 1.04, 1.56, and 2.08 M, respectively; calculated as moles per 0.030 L, assuming negligible volume change and density = 1 g mL-1). The chicken blood meal concentration varied between 15.0% (-1) and 30.0% (+1), with an intermediate level of 22.5%. All values were expressed on a weight basis (m/m).
The experiments were conducted considering the chosen reagent ranges, as described in Table 1. In preliminary tests, we observed the maximum amount of chicken blood meal that could be suspended in water without precipitation under the temperature conditions used.
Experimental setup and conditions for Alcalaseand NaOH-mediated hydrolysis of chicken blood meal
The best results for organic nitrogen content and degree of hydrolysis from both enzymatic and alkaline hydrolysis were selected and subjected to a second hydrolysis step (combined hydrolysis). Therefore, the sample hydrolyzed first with Alcalase was subjected to alkaline hydrolysis, and the sample from NaOH hydrolysis was hydrolyzed with Alcalase as well.
Enzymatic hydrolysis
The enzyme used for this hydrolysis was Alcalase, and the amount of enzyme was calculated based on the sample weight (E:S, m/m). According to the experimental design, five experiments were carried out in triplicate (Table 1), with enzyme concentrations of 0.1, 10, and 5.5% (central; rounded to match pipetting/stock solutions), as described in Table 1. Blood meal (10-20 g) was weighed and mixed with 80-90 mL of deionized H2O, totaling 100 mL per sample. The optimum pH of Alcalase is between 6.5 and 8.5, and the optimum temperature for this enzyme is between 55 and 70 °C.29 The pH was adjusted to 8.5 with 1 mol L-1 NaOH, the enzyme was added, and the samples were placed in a shaking incubator with agitation at 160 rpm at 60 °C for 1 h. Subsequently, the enzyme was inactivated in a water bath for 20 min at 90 °C. After this process, samples were filtered using a vacuum pump with qualitative filter paper, and the filtered liquid was stored in a freezer at -20 °C while the solid residue was discarded. This filtering process was employed due to the characteristics of the sample, which presented the solid granules separated from the liquid part.
Alkaline hydrolysis
Alkaline hydrolysis was performed using hydroxide (NaOH) following a methodology adapted from the literature.18 Following the proportions established in the experimental design (Table 1), five experiments were set up in triplicate. The reaction took place in beakers, where the weighed sample (3.75, 5.63, and 7.50 g), NaOH reagent (1.25, 1.87, and 2.50 g or 1.04, 1.56, and 2.08 M, respectively), and 30 mL of deionized water were added and then placed in a water bath at 98 °C for 1 h. At the end of the reaction, the pH was adjusted to 7.5, with 5 M sulfuric acid (H2SO4). The samples had a pasty appearance, with no well-defined separation between solid and liquid, and for this reason, they were centrifuged at 7000 rpm for 10 min. The supernatant was then stored under refrigeration for subsequent analysis.
Total nitrogen
The total nitrogen content was determined using the Kjeldahl method.25 Initially, 0.2 g of sample were weighed and added to a digestion tube containing 2 g of catalytic mixture (10 g Na2SO4 and 0.5 g of CuSO4.5H2O) and 5 mL of concentrated sulfuric acid. Digestion took place in a digestion block, starting at 100 °C and increasing the temperature by 50 °C every 30 min until reaching 350 °C, where it remained for 1 h. After digestion, the sample was distilled using a nitrogen distiller with 40% NaOH to release the ammonia produced during digestion, and the collected liquid was titrated using a 20 mL Erlenmeyer flask containing 2% boric acid and an acid-base indicator (0.1% methyl red and 0.1% bromocresol green). At the end of this step, the sample was titrated with 0.01 mol L-1 of HCl. The total protein can be determined using 6.25 correction with the organic nitrogen obtained.
Degree of hydrolysis
To determine the degree of hydrolysis (DH), 0.25 g of sample were weighed and transferred to a 25 mL volumetric flask and the volume was completed with deionized water. Serine at 0.01% was used as a standard. A solution called OPA, containing 3.5% sodium tetraborate, 1% sodium dodecyl sulfate, 0.8% phthalaldehyde, 0.9% dithiothreitol, and deionized water was prepared. For this analysis, 400 μL of the sample were added to 3.0 mL of the reagent solution, and after 2 min, the reading was taken at 340 nm using a UV Vis spectrophotometer. The same procedure was carried out with the standard and the blank.30
Sample preparation (diand tripeptide analysis) for LC-MS/MS
The samples were prepared according to the method standardized by Poliseli.16 100 mg of protein hydrolysates were weighed and added to 1000 μL of 50 mM ammonium bicarbonate solution in water. The mixture was vortexed for 40 s and then centrifuged at 4000 rpm for 15 min at room temperature (25 °C). 100 μL of the supernatant were collected and added to 900 μL of the mobile phase (acetonitrile/water 70:30 m/m) and vortexed for 1 min. The mixture was then centrifuged at 4000 rpm for 10 min and kept at -20 °C for 1 h. For injection into the LC-MS/MS system, an additional dilution of 100 μL of the supernatant in 900 μL of the mobile phase was made.
Mass spectrometry (LC-MS/MS)
A mobile phase solution with the following ratio was prepared: acetonitrile:water:formic acid (70.0:29.9:0.1 v/v/v) at a flow rate of 300 μL min-1 using a Waters 515 LC pump. An XBridge (Waters) C18 3.5 μm (4.6 × 50 mm) column was used with an injection volume of 5 μL, employing the Rheodyne® valve, with a run time of 5 min at room temperature.16 For the MS/MS analysis, a triple quadrupole mass spectrometer PremierXE (Waters Corporation, Milford, MA, USA) with electrospray ionization (ESI) source (4.0 kV) in positive ion mode was used. The parameters were adjusted as follows: desolvation gas at 350 °C and source block at 110 °C. Cone voltage was set at 20 V, collision energy at 15 V, and collision gas pressure (argon) at 3.0 × 10⁻³ Torr.
Statistical analysis
The results were analyzed using the R language, and the response surface was calculated using the least squares method.31 The parameters considered in the response surface model were based on analysis of variance (ANOVA), where only significant factors and interactions were considered.
Results and Discussion
Proximate analysis
Blood meal is a byproduct of the meat industry with low commercial value, priced around the local market at R$ 3,500 per ton. In the literature,12 it is reported to have a high protein content and richness in essential amino acids. Thus, these characteristics make this residue a promising source for obtaining bioactive peptides.32Table 2 shows the values obtained in the proximate analysis of chicken blood meal.
The amount of nitrogen content found in the blood meal samples was 14.97%. This value is higher than that reported by Huang and Liu,33 who obtained 10.51% of nitrogen content in their analyses. However, the result obtained is equivalent to the value found by Alves et al.,12 which was 14.94%. One possible explanation for this difference could be due to the processing of this by-product by the industry, which alters its composition, since in order to achieve the ideal consistency, other residues such as feathers are added in smaller amounts. The moisture content of the blood meal was analyzed in triplicate, and the average presented was 3.85%. The determination of ash showed that the amount of minerals present in the sample was 3.6%.
The high nitrogen content, along with low moisture, makes this raw material ideal for producing protein hydrolysates on an industrial scale. These hydrolysates can be used in both animal feed and special fertilizers for agriculture.
Hydrolysis
To optimize hydrolysis, a full factorial design with a central point was employed, which is a robust methodology widely utilized for this purpose. Its statistical approach enables the incorporation of the most relevant variables for the experiment, with the central point playing a crucial role in error estimation.26-28 The selection of variables considered minimizing production costs and determining the minimum reagent quantity necessary for effective hydrolysis. Temperature conditions were determined based on the literature,20 aligning with the reported ideal temperatures for each procedure. Additionally, hydrolysis time was predetermined to ensure a feasible processing duration.
Through enzymatic hydrolysis, five different results were obtained. The best result was from experiment 2 (Table 3), with 20% sample and 10% Alcalase. The obtained result was 1.51% of total nitrogen and 14.64% DH.
These results demonstrate a trend towards higher yields of total nitrogen (a mixture of soluble proteins, peptides, and amino acids) and degree of hydrolysis with increased proportions of sample and enzyme. Industrially, working under these conditions can ensure the production of a hydrolysate with elevated levels of protein, peptides, and amino acids; however, at a higher cost due to the increased enzyme percentage.
The determination of the degree of hydrolysis is crucial in the analysis of a hydrolysate, as it represents the proportion of protein that has been broken down into peptides and amino acids during the hydrolysis process. A high DH content indicates a potential presence of more peptides and amino acids, which are smaller molecules and have numerous applications, especially in bioinputs for agricultural use. In the industry, both the quantity of proteins and the DH serve as quality parameters for the hydrolysate and are directly linked to its commercialization.
Alves et al.12 used Alcalase for the hydrolysis of blood meal at a temperature of 60 °C for up to 90 min. The DH, as determined by the OPA method, was 22.7%, representing the best result obtained within the maximum hydrolysis time, demonstrating the significant role of reaction time in increasing this parameter. The authors further identified emulsifying properties equivalent to those of commercial protein emulsifiers. Although the hydrolysate did not exhibit antioxidant activity in 2,2-diphenyl-1-picrylhydrazyl (DPPH) and 2,2’-azinobis(3 ethylbenzothiazoline-6-sulfonic acid) (ABTS) assays, it displayed other intriguing characteristics, such as metal-reducing activity in the FRAP assay (ferric reducing antioxidant power).
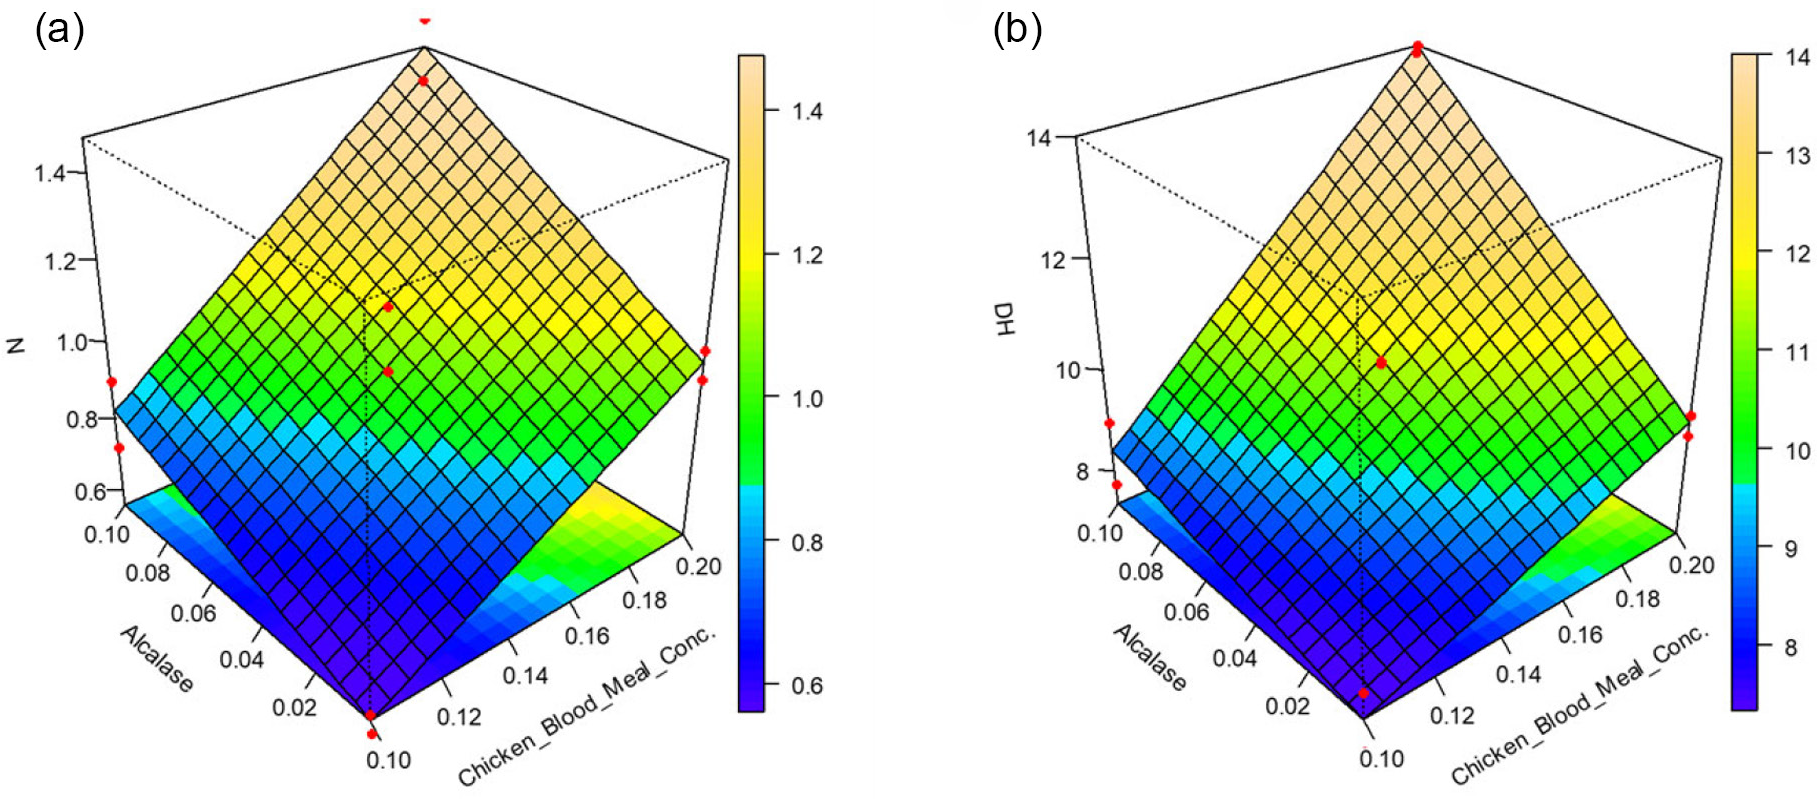
In Figure 1a, it can be observed the highest values of total nitrogen (TN) and DH in the same experiment, with a concentration of 0.1 E/S (enzyme/substrate).
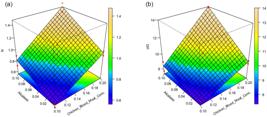
Response surfaces for Alcalase hydrolysis of chicken blood meal showing the influence of process variables on (a) response surface of total nitrogen (TN). Regression equation: y = 0.11 + 0.55x1 + 4.50x2 + 20.57x1x2 with R2 adjusted = 0.9256). (b) Response surface of degree of hydrolysis (DH). Regression equation: y = 5.18 - 23.39x1 + 21.43x2 + 343.766x1x2 with R2 adjusted = 0.9522.
The trend depicted in the response surface/plot indicates that the maximum level of total nitrogen in the hydrolysate was not linearly achieved, suggesting that testing higher concentrations, particularly of blood meal, could be beneficial, given that Alcalase is more expensive. Tables S1-S8, in Supplementary Information (SI) section presents the analysis of variance for all treatments and dependent variables.
Alcalase proves to be a promising commercial option for the hydrolysis of animal protein, with a degree of hydrolysis similar to that of other commercial enzymes such as neutrase and flavourzyme.29 Literature30 reports superior DH results in chicken breast and thigh samples hydrolyzed with Alcalase compared to flavourzyme. Hydrolysates produced with Alcalase shows good market acceptance, as evidenced by several commercial poultry protein hydrolysates produced by major companies in the sector.
Hydrolysates with NaOH presented improved conditions, as seen in experiment 2 with a higher total nitrogen content (2.63%) and experiment 3 with a higher degree of hydrolysis (26.09%) (Table 4). In experiment 2, the variables used were 30% sample and 5% NaOH, while in experiment 3, it was 15% sample to 10% NaOH.
Total nitrogen (TN) and degree of hydrolysis (DH) obtained from chicken blood meal after combined enzymatic and alkaline hydrolysis
Table 4 demonstrates that an experimental condition with higher NaOH concentration combined with a higher concentration of flour leads to a greater concentration of the protein-peptide-amino acid mixture, whereas a lower concentration of flour with a NaOH concentration result in more hydrolysis, yielding more peptides and amino acids. As the DH is a proportion of total organic nitrogen, we can observe that experiment 2, which contains more protein-peptide-amino acid mixtures, results in 1.62 g of peptides and amino acids per 100 mL of hydrolysate, while experiment 3, with a higher degree of hydrolysis, yields 2.50 g of peptides and amino acids per 100 mL of hydrolysate. Therefore, through these experiments, the industry can make informed decisions about which type of condition will result in greater product effectiveness for the intended purpose.
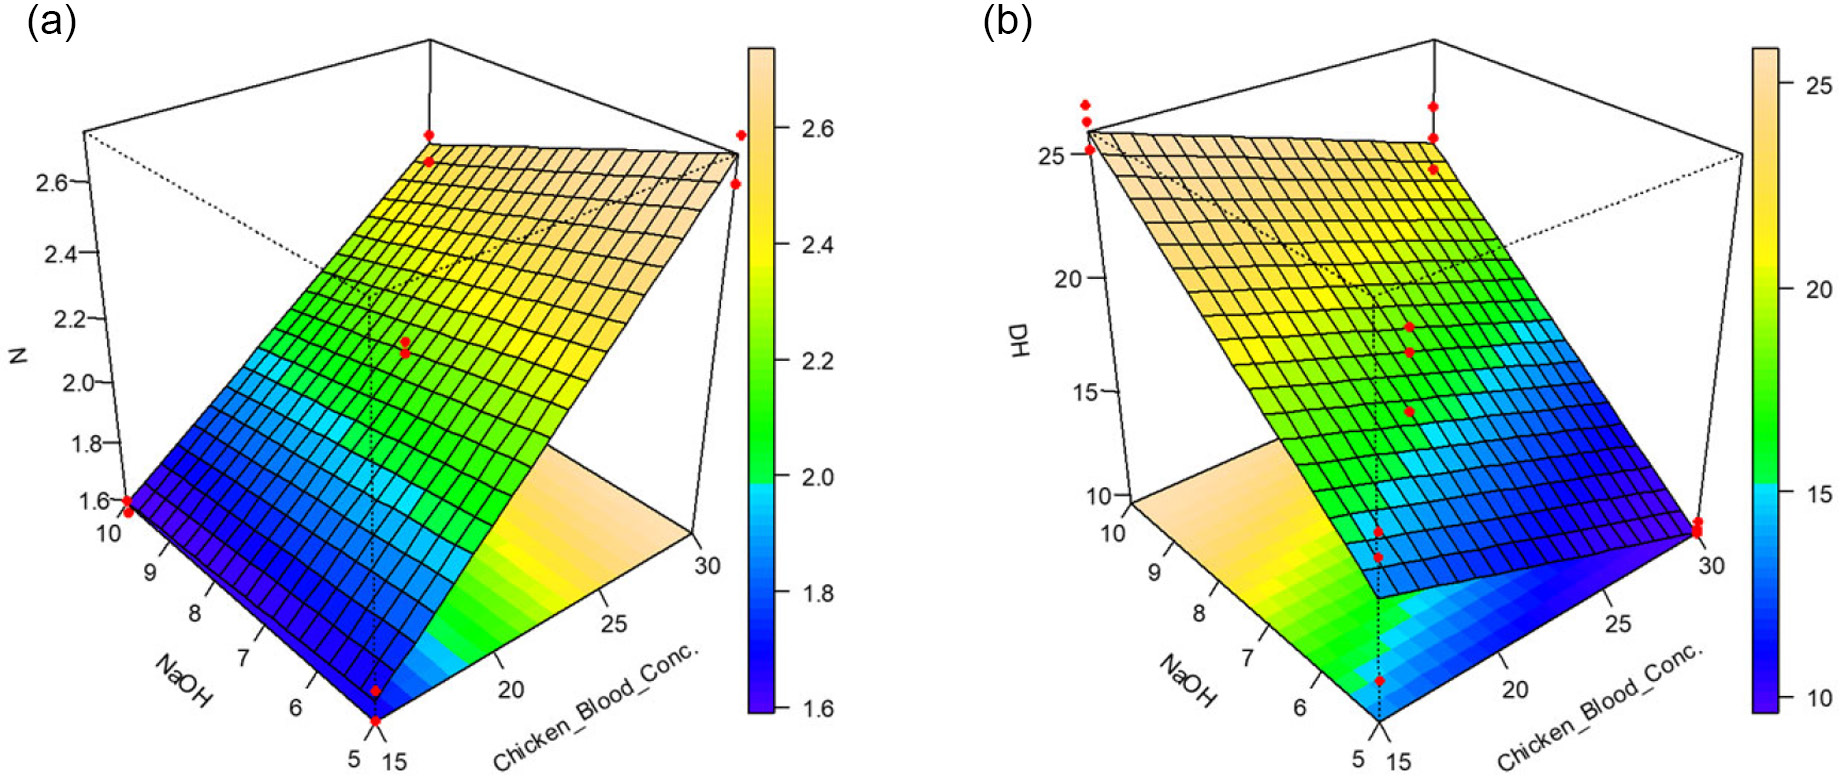
Figure 2a presents the response surface of total organic nitrogen (N) as a function of the independent variables X1 (NaOH concentration) and X2 (blood meal concentration). The response, which reflects the mixture of proteins, peptides, and amino acids in the hydrolysate, displays a gently sloping and relatively flat surface. This behavior indicates that among the two variables, the concentration of blood meal (x2) is the most influential factor in increasing the total organic nitrogen, whereas the effect of NaOH (x1) is comparatively less significant.
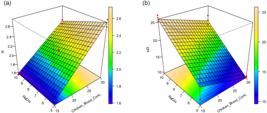
Response surface plots for the alkaline hydrolysis of chicken blood meal with NaOH, showing the combined effects of pH and temperature on (a) Response surface of total nitrogen (TN). Regression equation: y = 0.38 + 0.04x1 + 0.093x2 - 0.004x1x2 with R2 adjusted = 0.9799. (b) Response surface of degree of hydrolysis (DH). Regression equation: y = 10.21 + 2.03x1 - 0.41x2 - 0.01x1x2 with R2 adjusted = 0.9000.
Figure 2b illustrates the response surface of the DH with respect to the independent variables x1 (NaOH concentration) and x2 (blood meal concentration). The surface exhibits a gently sloping and relatively flat profile, indicating that the most influential factor in enhancing the DH is the NaOH concentration (x1). Lower values of blood meal concentration (x2), when combined with higher NaOH concentrations (x1), result in greater hydrolysis. This confirms that the reaction is strongly dependent on the availability of NaOH, as alkaline hydrolysis is highly efficient in digesting animal samples a process that naturally occurs more slowly. The application of heat further accelerates the solubilization and hydrolysis induced by NaOH. From an economic perspective, this type of hydrolysis is advantageous due to the low cost and wide availability of NaOH, which is also employed for sterilization. Nevertheless, sodium concentration remains a limiting factor; however, when used at low levels, it does not pose significant environmental concerns.
Figure 2 shows a trend, indicating that further increasing the raw material and NaOH leads to an increase in the quantity of peptides and amino acids. To this end, a cost-benefit analysis within the industry is necessary to determine whether it is economically viable. This analysis aims to address the questions: Will we proportionally save time, energy, reduce waste, and save on sales logistics by producing a more concentrated product?
To assess whether the hydrolysis process could be optimized, the best results from both methodologies were selected and combined. Consequently, two hydrolyses on the same sample were tested. For this purpose, the optimal variables were chosen alkaline hydrolysate (AlkH) (experiments 2 and 3-1.25 and 2.50 g or 1.04 and 2.08 M) and for enzymatic (Alcalase) protein hydrolysate (experiment 2, 10% of E:S). The first hydrolysis was performed with NaOH (Table 1), with the pH adjusted to 8.5, and the second hydrolysis was conducted with Alcalase. Similarly, the hydrolysis with Alcalase was initially performed with the variables from experiment 2, and the second hydrolysis was carried out with NaOH (experiment 2).
The best-performing hydrolysates were subjected to a second hydrolysis step. Experiment 2, which involved enzymatic hydrolysis with Alcalase, was subsequently hydrolyzed under alkaline conditions using 2.022 g of protein from the enzymatically hydrolyzed flour and 0.10 g (5%) of NaOH, while maintaining the same time and temperature conditions.
The regression model analysis for both DH and total nitrogen in EPH and AlkH showed no curvature (Figures 1 and 2), confirming a linear model (P < 0.05) without quadratic terms. Additionally, the regression model presented is close to 1, indicating a good fit (Tables S1-S8, SI section).30
The results demonstrate that the combined hydrolysis with NaOH followed by Alcalase (experiment 2) produced the highest protein content (2.67%), while the highest degree of hydrolysis (27.79%) was obtained in experiment 3 (NaOH + Alcalase). These findings indicate that the sequential hydrolysis using NaOH and Alcalase promotes a greater release of peptides, likely due to the complementary mechanisms of chemical and enzymatic hydrolysis.
However, the treatment involving Alcalase followed by NaOH resulted in lower DH and total nitrogen content, suggesting that the order of application is a critical factor. Although the double hydrolysis increases peptide yield, this approach may not be industrially feasible unless the resulting bioactive peptides exhibit substantial functional or economic relevance.
Mass spectrometry
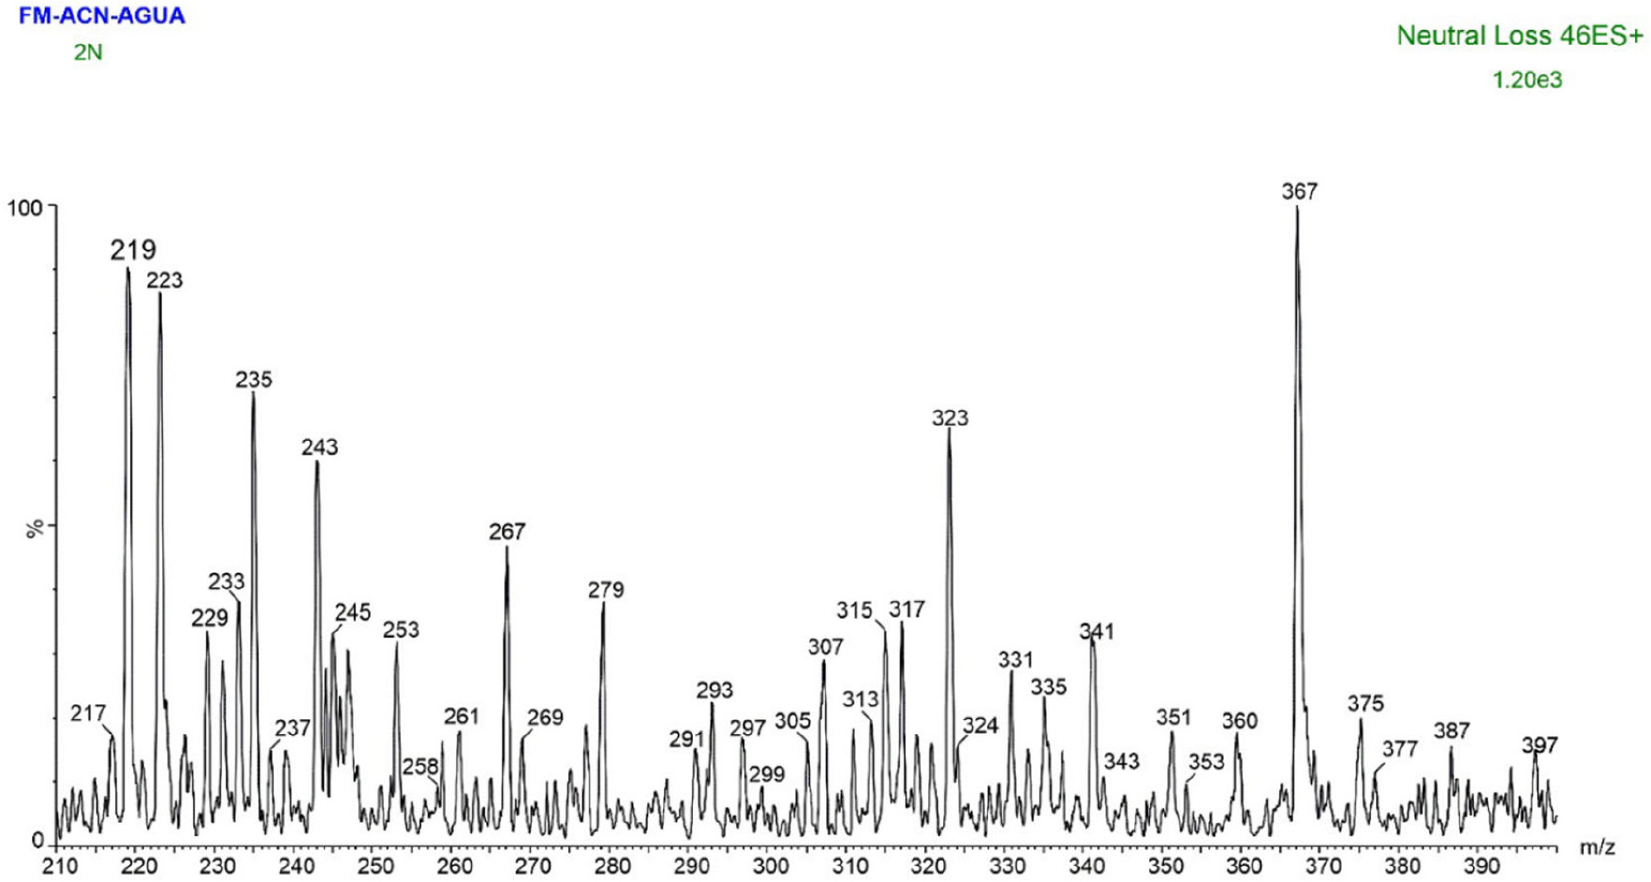
Samples were injected using a Neutral Loss (NL) of 46 Da to screen for dipeptide candidates, as outlined in Table S21 (SI section), followed by collision-induced dissociation (CID) for confirmation and sequencing.16,32 A triplicate scan was performed for NL of 46 Da, as shown in Figure 3. Figures containing the fragmentation spectra of the peaks and identification of the peptides are in Figures S1-S11, SI section.
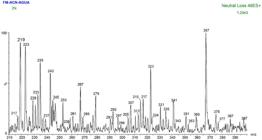
LC-MS/MS neutral loss scan (46 Da) of the alkaline hydrolysate from chicken blood meal obtained in experiment 2 with NaOH hydrolysis. The ion at m/z 219 was selected for CID fragmentation.
During the scan, possible peptides with intensities above 1000, and with candidate ions observed in at least two out of three replicates, were selected based on their m/z ions: 189, 219, 227, 235, and 279 from alkaline hydrolysates; 227, 229, 235, 279, and 285 from enzymatic hydrolysates; m/z 227, 229, and 235 from hydrolysis with NaOH + Alcalase; and m/z 189, 187, 227, 235, and m/z 279 from Alcalase + NaOH. These ions were subjected to CID and de novo (manual) sequencing for fragment analysis. This selection of dipeptide candidates follows the primary criteria outlined in Tables S11 and S12 (SI section). Furthermore, Tables S13 to S25 (SI section) extend the analysis to tripeptides, offering a comprehensive overview of potential dipeptides and tripeptides formed from combinations of the 20 amino acids that make up proteins.
Mass spectra interpretation was performed via de novo sequencing,16,32 and the identified dipeptide sequences were searched in the BIOPEP database,32 which contains literature-reported peptides and their bioactivities.
The biological activities of the identified peptides are presented in the SI section (Table S10).34,35 Bioactive peptides are of significant research interest due to their health benefits, such as dipeptidyl peptidase (DPPIV) inhibitors, which promote insulin secretion,36 and ACE (angiotensin-converting enzyme) inhibitors.37
According to the BIOPEP database, the dipeptides found in the chicken blood meal hydrolysates exhibit promising activities that could potentially improve animal health when used as feed additives.
In NaOH hydrolysis, the sequences AV (Ala-Val), AE (Ala-Glu), VT (Val-Thr), (I/L)S (Ile/Leu-Ser), and G(I/L) (Gly-Ile/Leu) were identified. These peptides are reported in the literature as DPPIV inhibitors, which are relevant in the treatment of type 2 diabetes. DPPIV is a protease expressed in tissues like the brain, lungs, and kidneys, capable of enhancing insulin secretion from pancreatic β-cells, thus lowering blood glucose levels.38
Human blood pressure is regulated by protein-derived compounds from biochemical systems; one such system produces ACE, which converts angiotensin I to angiotensin II, a vasoconstrictor. ACE inhibitors act by blocking angiotensin II formation, thereby reducing blood pressure. The AV peptide sequence inhibits ACE, assisting in blood pressure regulation for hypertensive individuals.38 Enzymatic hydrolysis did not yield dipeptides, possibly due to low ionizability, even though these treatments showed a degree of hydrolysis.
In combined hydrolysis, dipeptide analyses identified two distinct sequences: (I/L)P from NaOH + Alcalase and AH from Alcalase + NaOH hydrolysis, both of which inhibit ACE. Additionally, the second peptide exhibits antioxidant and DPPIV inhibitory properties.
The sequences G(I/L) and AV appear in both NaOH and Alcalase + NaOH hydrolysates, suggesting that these peptides were likely formed by NaOH action, without enzymatic influence. The results also indicate that enzymatic action contributed to the formation of two distinct peptides.
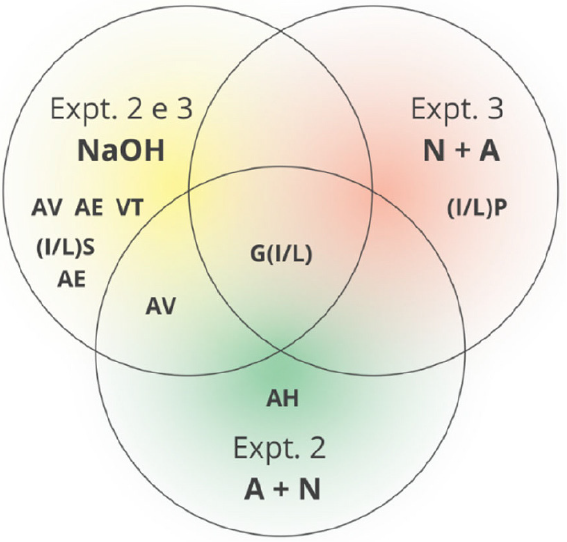
To establish a correlation among the dipeptides observed across different treatments, a Venn diagram was created, as presented in Figure 4, revealing that the dipeptide G(I/L) was present in all hydrolysates. Each treatment exhibited its unique peptides, with experiments 2 and 3 displaying a noticeably higher quantity of dipeptides.
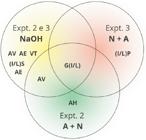
Diagram showing the dipeptides with the highest intensities identified in different hydrolysis processes of chicken blood meal. NaOH: alkaline hydrolysis with sodium hydroxide; A + N: sequential hydrolysis with Alcalase followed by sodium hydroxide; N + A: sequential hydrolysis with sodium hydroxide followed by Alcalase.
Amino acids were also identified across the different types of hydrolysis, as shown in Table S11 (SI section). In EPH, serine, proline, valine, leucine/isoleucine, and phenylalanine were found with the highest intensities. In AlkH, experiment 2 showed alanine, serine, proline, valine, threonine, leucine/isoleucine, glutamic acid, histidine, and tyrosine with greater intensities, while in experiment 3 (NaOH), proline, valine, leucine/isoleucine, and phenylalanine were prominent. In combined hydrolysis (AlkH + EPH) from experiment 2, serine, proline, valine, leucine/isoleucine, histidine, phenylalanine, and tyrosine were most intense, and in experiment 3, alanine, serine, valine, leucine/isoleucine, phenylalanine, and tyrosine stood out. For combined hydrolysis with EPH + AlkH, the most intense amino acids were proline, valine, leucine/isoleucine, histidine, and phenylalanine.
Although the amino acids were similar across all hydrolyses, intensity levels differed, with leucine/isoleucine showing the highest intensity in experiment 2 with AlkH (19.572) and in experiment 2 with EPH (5.884). The AlkH + EPH (experiment 2) generated the highest quantity of amino acids overall.
Conclusions
This study successfully optimized the EPH and AlkH conditions of chicken blood meal to maximize the release of total organic nitrogen and the DH. Among the tested conditions, AlkH proved more effective than EPH, producing a broader spectrum of bioactive dipeptides. The optimal parameters were 10% NaOH and 15% substrate for the highest DH, and 5% NaOH and 30% substrate for maximum nitrogen recovery. Chicken blood meal is an industrial by product with low economic value and potential environmental risk. However, when combined with the hydrolysis process, it not only increases the value of this material but also generates bioactive peptides such as AV, AH, (I/L)P, VT, and AE, which exhibit ACE and DPP-IV inhibitory activities. Peptides without previously reported bioactivities, such as G(I/L) and I(L/S), were also identified. Therefore, hydrolysis represents a sustainable and versatile strategy for converting animal byproducts into functional peptide sources, warranting further investigation through antioxidant assays and plant bioactivity tests.
Supplementary Information
Supplementary information is available free of charge at https://jbcs.sbq.org.br/ as PDF file.
Supplementary Information
-
Acknowledgments
The authors would like to express their gratitude to Waters Company, Jamel Company, OMICS Company, CAPES, CNPq, UEM, and UFPR for their financial support.
Data Availability Statement
All data supporting the findings of this study are included within the article and its Supplementary Information section.
References
-
1 Kim, S. W.; Less, J. F.; Wang, L.; Yan, T.; Kiron, V.; Kaushik, S. J.; Lei, X. G.; Annu. Rev. Anim. Biosci 2019, 7, 221. [Crossref]
» Crossref -
2 Sans, P.; Combris, P.; Meat Sci 2015, 109, 106. [Crossref]
» Crossref -
3 Ministério da Agricultura e Pecuária (MAPA); Agrostat - Estatísticas de Comércio Exterior do Agronegócio Brasileiro [Link] accessed in December 2025
» Link -
4 Selormey, G. K.; Barnes, B.; Kemausuor, F.; Darkwah, L.; Rev. Environ. Sci. Bio/Technol 2021, 20, 1073. [Crossref]
» Crossref -
5 Bastos, M. L.; Silva, J. M.; Costa, S. S. L.; Palomino-Romero, J. A.; Res. Soc. Develop 2020, 9, 12. [Crossref]
» Crossref -
6 Associação Brasileira de Proteína Animal (ABPA); Mercados [Link] accessed in December 2025
» Link -
7 de Queiroz, A. P. L. B.; Guimarães, E. C.; Silveira, A. C. P.; Res. Soc. Develop 2020, 9, e7379108979. [Crossref]
» Crossref -
8 Araujo, T. S.; Brito, L. P.; Duarte Neto, J. M. W.; Wanderley, M. C. A.; Albuquerque, W. W. C.; Herculano, P. N.; Pastrana, L.; Soares, M. T. C. V.; Porto, A. L. F.; Res. Soc. Develop 2022, 11, e181111133353. [Crossref]
» Crossref -
9 Zheng, L. H.; Wang, Y. J.; Sheng, J.; Wang, F.; Zheng, Y.; Lin, X. K.; Sun, M.; Mar. Drugs 2011, 9, 1840. [Crossref]
» Crossref -
10 Fagbemi, O. D.; Sithole, B.; Tesfaye, T.; Sustainable Chem. Pharm 2020, 17, 100267. [Crossref]
» Crossref -
11 Ouakarrouch, M.; Laaroussi, N.; Garoum, M.; Renewable Energy Environ. Sustainable 2020, 5, 2. [Crossref]
» Crossref -
12 Alves, F. E. S. B.; Teixeira, G. L.; Ávila, S.; Ribani, R. H.; Scheer, A. P.; Braz. J. Develop 2020, 6, 21149. [Crossref]
» Crossref -
13 de Matos, F. M.; Castro, R. J. S.; Braz. J. Food Tech 2021, 24, e2020044. [Crossref]
» Crossref -
14 Selamasskul, O.; Laohakunjit, N.; Kerdchoechuen, O.; Yang, L.; Maier, C. S.; J. Food Sci 2020, 85, 707. [Crossref]
» Crossref -
15 Yaghoubzadeh, Z.; Peyravii Ghadikolaii, F.; Kaboosi, H.; Safari, R.; Fattahi, E.; Int. J. Pept. Res. Ther 2020, 26, 625. [Crossref]
» Crossref -
16 Poliseli, C. B.; Tonin, A. P. P.; Martinez, F. C.; Nascimento, N. C.; Braz Jr., V.; Maluf, J.; Ribeiro, V. M. S.; Della Rosa, F. A.; Meurer, E. C.; J. Mass Spect 2021, 56, e4701. [Crossref]
» Crossref -
17 Jie, M.; Raza, W.; Xu, Y. C.; Shen, Q. R.; J. Plant Nut 2008, 31, 571. [Crossref]
» Crossref -
18 Banvillet, G.; Depres, G.; Belgacem, N.; Bras, J.; Carbohydr. Polym 2021, 255, 117383. [Crossref]
» Crossref -
19 Hooper, N. M.; Essays Biochem 2002, 38, 1. [Crossref]
» Crossref -
20 Bah, C. S. F.; Bekhit, A. E. A.; Mccornell, M. A.; Carne, A.; Food Chem 2016, 213, 98. [Crossref]
» Crossref -
21 Cheng, F. Y.; Lai, I. C.; Lin, L. C.; Sakata, R.; Animal Sci. J 2016, 87, 921. [Crossref]
» Crossref -
22 Adje, E. Y.; Balti, R.; Lecouturier, D.; Kouach, M.; Dhulster, P.; Guillochon, D.; Nedjar-Arroume, N.; Probiotics and Antimicrob. Prot 2013, 5, 176. [Crossref]
» Crossref -
23 Gómez, L. J.; Zapata, J. E.; Braz. Arch. Biol. Technol 2014, 57, 386. [Crossref]
» Crossref -
24 Ministério da Agricultura, Pecuária e Abastecimento (MAPA); Métodos Oficiais para Análise de Produtos de Origem Animal, 1st ed.; MAPA: Brasília, Brazil, 2022. [Link] accessed in December 2025
» Link -
25 Mussatto, S. I.; Dragone, G.; Roberto, I. C.; Ind. Crops Products 2007, 25, 231. [Crossref]
» Crossref -
26 Muley, A. B.; Pandit, A. B.; Singhal, R. S.; Dalvi, S. D.; Ultrason. Sonochem. 2021, 71, 105385. [Crossref]
» Crossref -
27 Singh, S.; Sinha, R.; Kundu, S.; Biomass Conv. Bioref 2022, 12, 1657. [Crossref]
» Crossref -
28 Zavareze, E. R.; Silva, C. M.; Salas-Mellado, M.; Prentice-Hernández, C.; Quim. Nova 2009, 32, 1739. [Crossref]
» Crossref -
29 Schmidt, C. G.; Salas-Mellado, M.; Quim. Nova 2009, 32, 1238. [Crossref]
» Crossref -
30 Bezerra, M. A.; Santelli, R. E.; Oliveira, E. P.; Villar, L. S.; Escaleira, L. A.; Talanta 2008, 76, 965. [Crossref]
» Crossref -
31 Cantú, M. D.; Carrilho, E.; Wulff, N. A.; Palma, M. S.; Quim. Nova 2008, 31, 669. [Crossref]
» Crossref -
32 Minkiewicz, P.; Iwaniak, A.; Darewicz, M.; Int. J. Mol. Sci 2019, 20, 5978. [Crossref]
» Crossref -
33 Huang, S. C.; Liu, P. J.; J. Food Drug Analysis 2010, 18, 5. [Crossref]
» Crossref -
34 Baetta, R.; Corsini, A.; Drugs 2011, 71, 1441. [Crossref]
» Crossref -
35 Chen, H. M.; Muramoto, K.; Yamauchi, F.; J. Agric. Food Chem. 1995, 43, 574. [Crossref]
» Crossref -
36 Van Platerink, C. J.; Janssen, H. G. M.; Haverkamp, J.; Anal. Bioanal. Chem. 2008, 391, 299. [Crossref]
» Crossref -
37 Matsui, T.; Zhu, X. L.; Watanabe, K.; Tanaka, K.; Kusano, Y.; Matsumoto, K.; Life Sci 2006, 79, 2492. [Crossref]
» Crossref -
38 Lan, V. T. T.; Ito, K.; Ohno, M.; Motoyama, T.; Ito, S.; Kawarasaki, Y.; Food Chem 2015, 175, 66. [Crossref]
» Crossref -
39 Salampessy, J.; Reddy, N.; Kailasapathy, K.; Phillips, M.; J. Funct. Food. 2015, 14, 716. [Crossref]
» Crossref
Edited by
-
Editor handled this article: César Ricardo Teixeira Tarley (Associate)