Controlled Phase Evolution and Pore Architecture in Porous NASICON-Type Glass-Ceramics Derived from Germanophosphate Glasses
Abstract
The demand for porous sodium super ionic conductor (NASICON)-type materials with high surface area and controlled microstructure has intensified due to their potential in energy storage, sensing, and catalytic applications. However, conventional synthesis routes are often complex and poorly scalable. Here, we demonstrate that acid leaching of lithium germanophosphate-based glass-ceramics provides an efficient pathway for NASICON phase formation while enabling selective dissolution of soluble phases. The effects of acid type (hydrochloric acid (HCl) and phosphoric acid (H3PO4), 1 mol L-1) and leaching temperature (25 and 70 °C) on the phase purity, morphology, and porosity of NASICON monoliths derived from 6Li2O-24GeO2-39CaO-31P2O5 (mol%) glasses heat-treated at 658 and 750 °C were systematically investigated. Leaching in H3PO4 at 25 °C produced monoliths with high structural integrity, large interconnected pores (ca. 10 µm), and selective NASICON preservation, attributed to the phosphate-assisted removal of metaphosphate and pyrophosphate species. In contrast, HCl leaching at 25 °C generated smaller pores (ca. 1 µm) with germanium dioxide (GeO2) residues, while higher temperatures (70 °C) in either acid completely dissolved the NASICON phase. These results establish a rational framework for tuning the morphology and phase purity of porous NASICON glass-ceramics via coupled thermal and chemical processing, offering new insights for their targeted design in energy, catalytic, and sensing technologies.
Keywords:
germanophosphate glasses; devitrification; NASICON; porous materials
Introduction
Porous materials represent a highly versatile class of compounds that have evolved remarkably due to their large specific surface area, enabling their application across diverse scientific and technological fields, including energy conversion,1 tumor therapy,2 antimicrobial treatments,3 and pharmaceutical delivery.4 These materials can be derived from organic frameworks, such as metal-organic networks and polymeric chains,5 as well as from inorganic matrices. Among the latter, phosphate-based structures stand out for exhibiting the NASICON (sodium super ionic conductor) framework.6 The NASICON system constitutes a family of materials renowned for their high chemical7-10 and thermal stability,11-14 excellent ionic conductivity,15-18 and remarkable structural flexibility.19,20 The first NASICON compounds, synthesized by Goodenough et al.21 and described by the general formula Na1+xZr2P3-xSixO12 (0 ≤ x ≤ 3), laid the foundation for subsequent developments. Currently, NASICON-type materials can be obtained from a broad range of elements and are generally represented by the formula AxM2(XO4)3, in which A corresponds to a monovalent cation (Na, Li, K), M to polyvalent metal ions (e.g., V, Fe, Ge, Ti), and XO4 to tetrahedral oxoanions, such as SiO4 or PO4.20,22
The NASICON crystalline phases exhibit either rhombohedral (r-) or monoclinic symmetry, forming three-dimensional anionic frameworks composed of MO6 octahedra interconnected through corner-sharing XO4 tetrahedra. The interstitial sites created within this lattice enable facile cation migration along specific crystallographic pathways, a feature that makes these materials highly attractive as solid-state electrolytes for diverse technological applications, including catalysis,23-25 solid-state batteries,24-27 ionic membranes,28,29 and gas sensing of pollutant species such as SO2,30 NOx,31 volatile organic compounds (VOCs)32 and CO.33 For instance, Tiwari et al.34 synthesized NASICON-type Na3Fe2(PO4)3 via a sol-gel route and employed it as a gas sensor for CO detection at room temperature. The sensor exhibited excellent sensitivity, achieving limits of detection below parts-per-billion levels. Similarly, Modak et al.35 prepared thin films of NASICON-type Na3.1Zr1.55Si2.3P0.7O11 and evaluated their performance as flow-battery electrolytes. When compared with conventional polymeric membranes such as Nafion, the NASICON films demonstrated superior chemical stability over a broad pH range (neutral to alkaline), low reagent permeability in electrochemical media, minimal capacitance loss, and enhanced overall battery performance. Moshareva et al.36 synthesized (NH4)1-xHxHf2(PO4)3 (0 ≤ x ≤ 1) NASICON-type catalysts via a hydrothermal route and applied them to ethanol conversion. The catalysts displayed remarkable selectivity (> 96%) and conversion (> 60%) for the dehydration of ethanol to diethyl ether at 360 °C, and achieved complete (100%) selectivity and conversion to ethylene at 450 °C. There is growing interest in incorporating germanium into NASICON frameworks, as Ge4+ ions readily form GeO6 octahedra, yielding robust interconnected structures with high thermal and electrochemical stability.37 Furthermore, substitutional incorporation of Ge4+ facilitates aliovalent doping with cations such as Al3+, which enhances ionic conductivity within the NASICON lattice.38
Several synthesis routes for producing NASICON-type crystalline phases have been reported in the literature, including the sol-gel method,39,40 mechanochemical approaches,41 freeze-casting techniques,42,43 and devitrification of glass precursors.44,45 Among these, the devitrification route involves the controlled thermal treatment of vitreous materials, leading to the precipitation of crystalline phases within the glass matrix. This devitrification process may occur through either nucleation-and-growth mechanisms or spinodal decomposition, wherein an initially homogeneous glass undergoes compositional separation into interconnected regions enriched in specific components.46 Devitrification often yields both soluble and insoluble species when subjected to chemical leaching, thereby generating porous structures.47 In particular, when the NASICON phase precipitates as an insoluble component, other coexisting phases - such as metaphosphates and pyrophosphates - can be selectively dissolved in acidic media. This selective leaching process results in highly interconnected three-dimensional porous architectures, typically forming robust monolithic materials suitable for use as supports in integrated chemical systems and as versatile templates for material synthesis.48 The preparation of porous monoliths via acid leaching requires careful optimization of the leaching parameters, including temperature and the chemical nature of the reactive medium. Acidic environments, especially those containing different acid species, can strongly influence pore morphology and size distribution.49
In this work, we prepared glass-ceramics derived from Li2O-GeO2-CaO-P2O5 germanophosphate glasses, from which the NASICON phase was obtained. The influence of leaching conditions on the formation of NASICON-based porous monoliths was systematically investigated using two acids, hydrochloric (HCl) and phosphoric (H3PO4), at different temperatures. The resulting crystalline phases and microstructural features, both before and after porosity development, were characterized using complementary techniques, including X-ray diffraction (XRD), Fourier transform infrared (FTIR) spectroscopy, and Raman spectroscopy.
Experimental
Glass preparation
The parent glass, hereafter referred to as g-LGeCP, was prepared with the nominal composition 6Li2O 24GeO2 39CaO-31P2O5 (mol%). Analytical-grade precursors Li2CO3, GeO2, CaCO3, and P2O5 were used as starting materials. The reagents were thoroughly mixed in a porcelain mortar and transferred to a platinum crucible, followed by melting in an electric furnace at 1300 °C for 1 h. To ensure chemical homogeneity, the melt was stirred after approximately 40 min of heating. The molten glass was then poured onto a copper plate and rapidly pressed using a steel plate, a process known as splat quenching, yielding transparent glass sheets. These sheets were subsequently annealed at 550 °C for 1 h to relieve internal stresses.
Glass-ceramics formation
The corresponding glass-ceramic, denoted as gc LGeCP, was obtained from powdered g-LGeCP glass. The glass powder was compacted into monoliths and sintered at 620 °C, after which two distinct heat-treatment procedures were applied: (i) monoliths were heat-treated at 658 °C for 12 h, yielding samples labeled gc-LGeCP-658; (ii) in the second process, monoliths were heat-treated at 658 °C for 12 h followed by an additional treatment at 750 °C for 12 h to promote the complete formation of crystalline phases throughout the bulk, producing samples labeled gc-LGeCP-750. The heat-treatment temperature of 750 °C was selected to ensure complete crystallization and full growth of the NASICON-type phases, as temperatures moderately above the crystallization peak are known to promote uniform and fully developed microstructures in phosphate-based glass-ceramics.
Acid leaching for porous glass-ceramics formation
Porous glass-ceramics (pgc-LGeCP) were obtained from the acid leaching of gc-LGeCP-658 monoliths (1 mol L-1 acid solution) under four different conditions: (i) HCl at 25 °C → pgc-LGeCP-658-HCl-25; (ii) HCl at 70 °C → pgc-LGeCP-658-HCl-70; (iii) H3PO4 at 25 °C → pgc-LGeCP-658-H3PO4-25; (iv) H3PO4 at 70 °C → pgc-LGeCP-658-H3PO4-70. HCl and H3PO4 were selected because they provide distinct and controllable leaching regimes, HCl enabling rapid dissolution of transient phosphate phases and H3PO4 offering a common-ion-stabilized, milder dissolution, while the mild temperatures employed (25 and 70 °C) ensure sufficient removal of soluble phases without compromising the structural integrity of the NASICON framework. To compare pore morphology, identical leaching procedures were applied to the gc-LGeCP-750 samples, producing pgc-LGeCP-750-HCl-25, pgc-LGeCP-750-HCl-70, pgc-LGeCP-750-H3PO4-25, and pgc-LGeCP-750-H3PO4-70.
Characterization techniques
Powder X-ray diffraction (XRD) analyses were carried out on a Shimadzu XRD-7000 diffractometer using Cu Kα radiation (λ = 1.5418 Å) operated at 44 kV and 40 mA. Data were collected in the 10-40° (2θ) range with a scanning rate of 2° min-1. Raman spectra were recorded on a HORIBA Jobin-Yvon T64000 spectrometer equipped with a 532 nm excitation laser, 20 s exposure time, one accumulation, and a 100× objective lens. Fourier transform infrared (FTIR) spectra were obtained using a Cary 660 spectrometer, with samples dispersed in KBr pellets at a 1:100 ratio, measured within the 1300-400 cm-1 range. Differential thermal analysis (DTA) were performed on a TA Instruments SDT Q600 system from 50 to 1000 °C under N2 atmosphere, using platinum crucibles and heating rates of 10, 15, 20, and 30 °C min-1, with sample masses of approximately 10 mg. Microstructural characterization was conducted via scanning electron microscopy (SEM) using a FEI Quanta 250 FEG microscope operated at 20 kV.
Results and Discussion
Characterization of g-LGeCP and gc-LGeCP samples before the leaching process
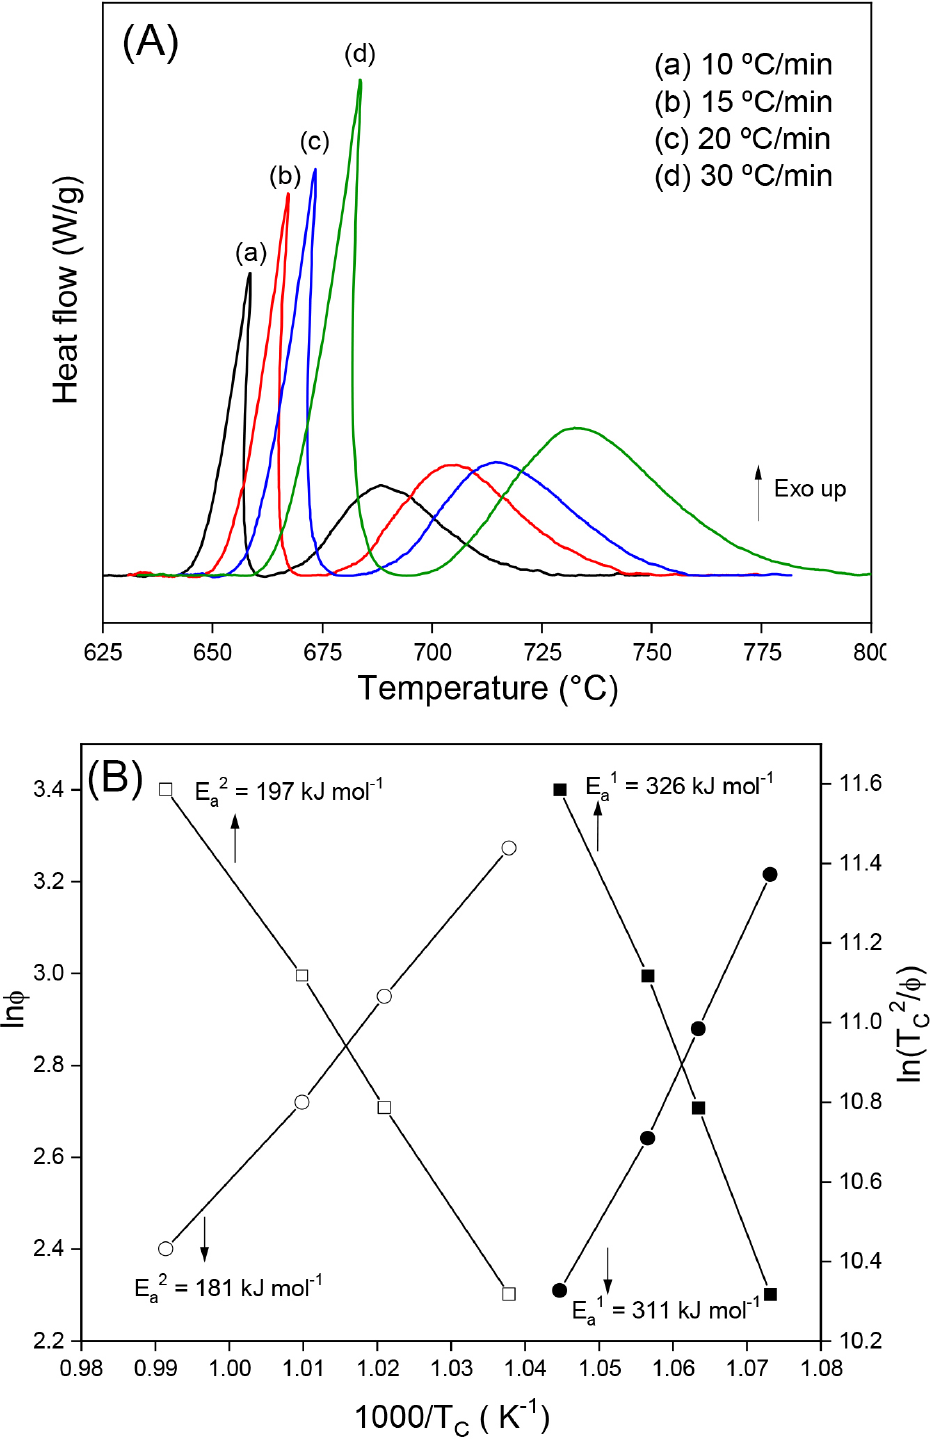
The melt-quenching procedure performed via the splat-quenching method produced homogeneous glass slides exhibiting a yellowish coloration, characteristic of the g-LGeCP composition. DTA was carried out at different heating rates to investigate the devitrification behavior of the parent glass, as shown in Figure 1. Figure 1A reveals two distinct exothermic peaks associated with devitrification: one intense and asymmetric, and a second of lower intensity and symmetric profile. At a heating rate of 10 °C min-1, the asymmetric peak appears at approximately 658 °C, while the symmetric peak is observed at around 688 °C. The pronounced asymmetry of the first peak is attributed to the highly exothermic crystallization event, which transiently increases the local furnace temperature beyond the programmed setpoint, temporarily interrupting the heating ramp until thermal equilibrium is re-established.
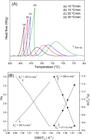
(A) DTA curves of the parent glass (g-LGeCP) recorded at different heating rates; (B) plots used for calculating the activation energies of the crystallization process. ○: Kissinger model; □: Kissinger-Augis-Bennett model. For both symbols, filled markers represent the first devitrification peak, while open markers correspond to the second devitrification peak.
The crystallization peak shifts to higher temperatures with increasing heating rate, a well-known kinetic effect in DTA that results from the delayed thermal response of the sample and the temperature dependence of nucleation and crystal-growth processes.
The DTA curves obtained at different heating rates were analyzed to determine the activation energy of the devitrification process using the Kissinger and Kissinger-Augis-Bennett models, given by equations 1 and 2, respectively:
where φ is the heating rate, TC is the crystallization peak temperature, and m and n are kinetic parameters associated with the nucleation and growth mechanism; for finely powdered samples, the commonly adopted assumption m = n = 1 was applied. EK and EKAB represent the activation energies obtained from the Kissinger and Kissinger-Augis-Bennett models, respectively, while R is the universal gas constant and C is an empirical constant. The values of EK and EKAB were determined from the slopes of the linear fits shown in Figure 1B.
The calculated activation energies for the first devitrification event were 311 kJ mol-1 (Kissinger) and 326 kJ mol-1 (Kissinger-Augis-Bennett), while the second event yielded lower values of 181 and 197 kJ mol-1, respectively. These results indicate that the first thermal event corresponds to the precipitation of crystalline phases requiring higher activation energy, accompanied by an intense exothermic release. Conversely, the second event is associated with the formation of phases of lower activation energy and a correspondingly weaker exothermic response. Literature data50,51 report that crystalline phases such as Ca3(PO4)2 and GeO2 exhibit formation enthalpies on the order of -2000 and -500 kJ mol-1, respectively. Therefore, it is plausible that the first devitrification peak is primarily associated with the crystallization of Ca3(PO4)2, whereas the second corresponds to the precipitation of GeO2.
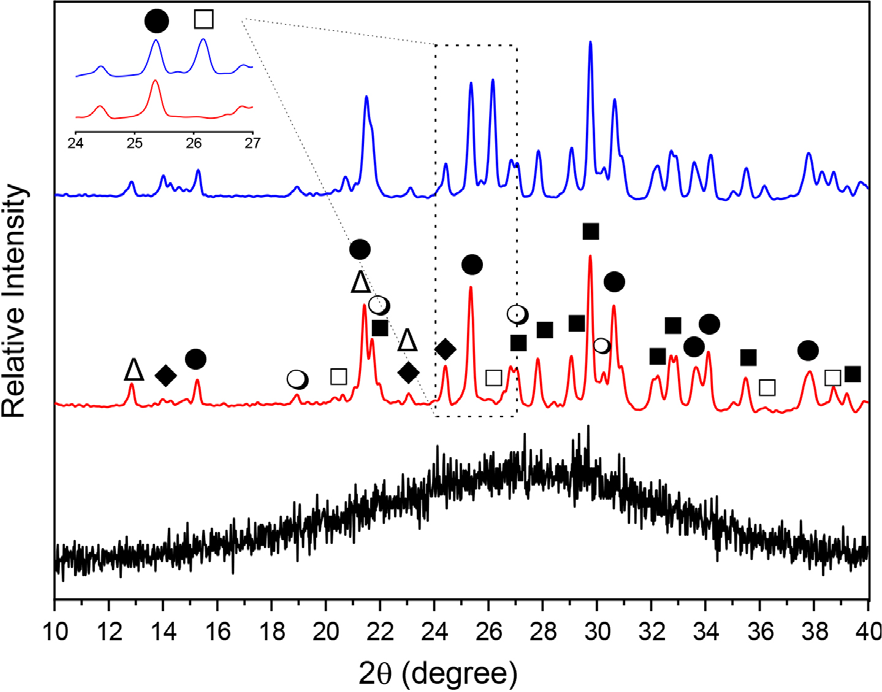
The XRD pattern of the parent glass (g-LGeCP) exhibits a total absence of crystalline reflections, confirming its fully amorphous nature (Figure 2, black line). This lack of diffraction peaks is consistent with the formation of a homogeneous glass matrix. In contrast, the diffractograms of the glass-ceramic samples gc LGeCP-658 and gc-LGeCP-750 (Figure 2, red and blue lines, respectively) reveal well-defined diffraction peaks corresponding to several crystalline phases, including β-Ca2P2O7, GeP2O7, LiCaPO4, GeO2, β-Ca3(PO4)2, and LiGe2(PO4)3, the latter being the NASICON-type phase. A comparison of the relative peak intensities provides insight into the evolution of crystalline phases with increasing heat-treatment temperature. The ratio between the diffraction peaks at 2θ = 25.0° (LiGe2(PO4)3, NASICON) and 2θ = 24.4° (LiCaPO4) decreases from gc-LGeCP-658 to gc-LGeCP-750, suggesting a relative reduction in the NASICON phase content compared to LiCaPO4. Likewise, the ratio between the NASICON peak (2θ = 25.0°) and the GeO2 peak at 2θ = 20.6° also decreases, indicating a progressive enrichment of GeO2 and a depletion of the NASICON phase as the thermal treatment temperature increases. This interpretation is further supported by the emergence of a distinct GeO2 peak at 2θ = 26° in the gc-LGeCP-750 sample, which is almost absent in gc-LGeCP-658.52 Additionally, the diffraction feature at 2θ = 21°, observed as a single peak in gc-LGeCP-658, appears as a split doublet in gc-LGeCP-750, reflecting the overlapping contributions of the β-Ca2P2O7 and GeP2O7 phases. Overall, the results indicate that although both thermal treatments promote the crystallization of similar phases from the g-LGeCP parent glass, the treatment at 750 °C favors the formation of GeO2 and LiCaPO4 at the expense of the LiGe2(PO4)3 (NASICON) phase. In contrast, the treatment at 658 °C enhances the crystallization of the NASICON structure, suggesting that lower-temperature devitrification conditions are more favorable for stabilizing the NASICON framework.
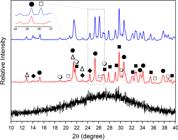
XRD patterns for the g-LGeCP (black line), gc-LGeCP-658 (red line) and gc-LGeCP-750 (blue line). The crystalline phases obtained were ∆: β-Ca3(PO4)2; ♦: LiCaPO4; ■: β-Ca2P2O7; □: GeO2; ●: LiGe2(PO4)3; ○: GeP2O7.
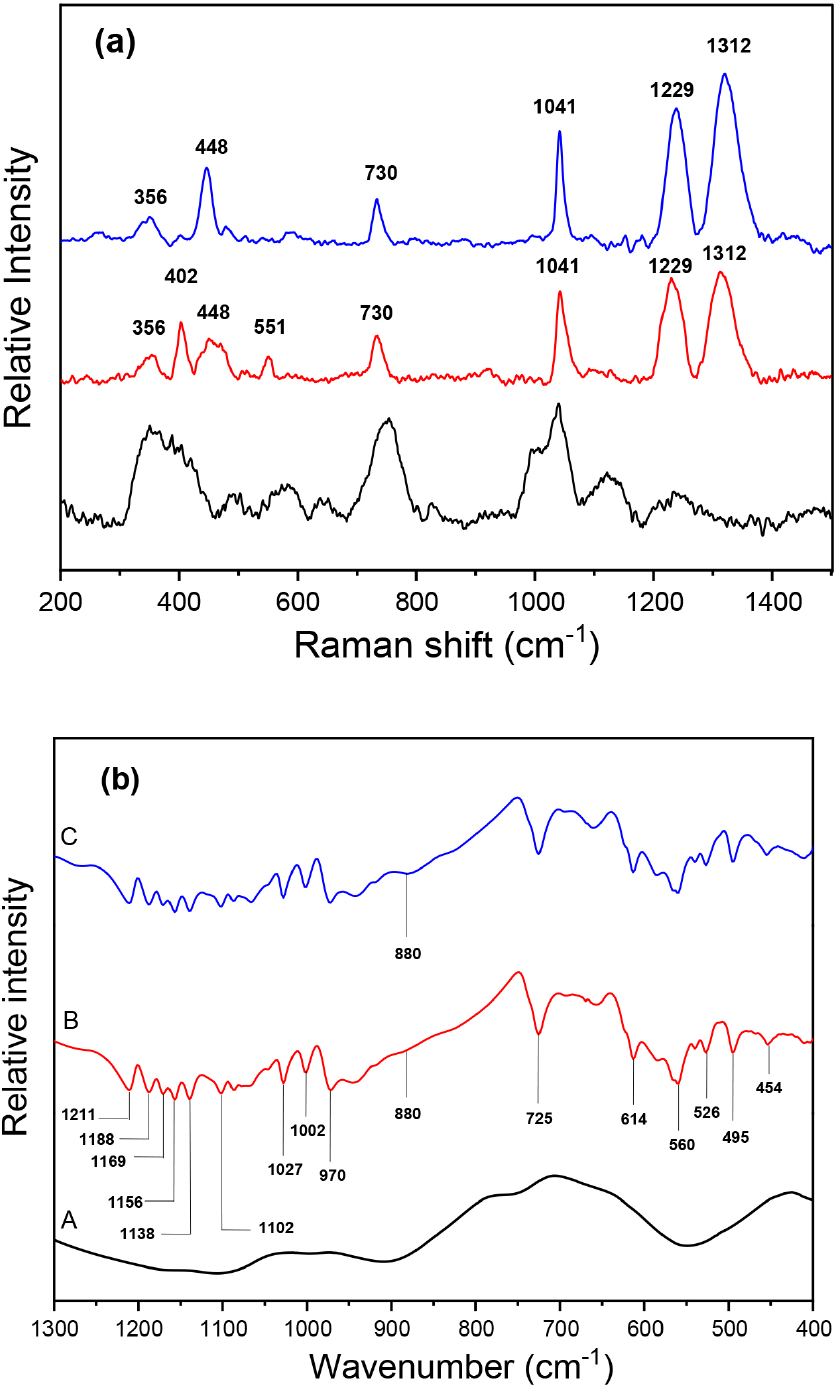
To confirm the formation of the GeO2 crystalline phase, Raman spectroscopy was performed for all samples, as shown in Figure 3. The Raman spectrum of gc-LGeCP-750 (Figure 3a) displays a characteristic band at 448 cm-1, attributed to the Ge-O-Ge stretching vibration in the rutile-type phase of GeO2.53 A similar band is also observed in the spectrum of gc-LGeCP-658, although with lower relative intensity. When comparing the relative intensity of this band with that of the 402 cm-1 feature, assigned to the ν(PO43-) stretching vibration of metaphosphate units, the I(GeO2)/I(PO43-) ratio is significantly lower for gc LGeCP-658 than for gc-LGeCP-750. This trend indicates that the crystallization of GeO2 is favored at higher temperatures, consistent with the 750 °C heat treatment.
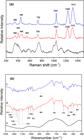
(a) Raman spectra of the samples: g-LGeCP (black line), gc LGeCP-658 (red line), and gc-LGeCP-750 (blue line); (b) FTIR spectra of the same samples: g-LGeCP (black line), gc-LGeCP-658 (red line), and gc-LGeCP-750 (blue line).
Additionally, the band at 402 cm-1, attributed to the metaphosphate structure of PO43-, evidences the presence of a Ca3(PO4)2-related phase,54 whose intensity decreases upon heating to 750 °C. This decrease is consistent with the consumption of this phosphate phase during the second devitrification event identified in the DTA curve (Figure 1A).
A Raman band at 551 cm-1 is assigned to the Ge-O-P stretching vibration associated with the LiGe2(PO4)3 (NASICON) phase.55 Similar to the XRD analysis, the I(GeO2)/I(LiGe2(PO4)3) intensity ratio increases from gc LGeCP-658 to gc-LGeCP-750, suggesting that P-O-Ge linkages are progressively converted into GeO2 as the temperature increases. The FTIR spectra (Figure 3b) further corroborate the Raman results. A weak infrared band near 880 cm-1 is observed for the monoliths heat-treated at 658 °C, while a marked increase in its intensity occurs for those treated at 750 °C. This band is attributed to the Ge-O stretching mode of GeO4 tetrahedra in crystalline GeO2.56 Together, the Raman and FTIR analyses confirm that heat treatment above the second devitrification peak promotes the structural rearrangement of the glass-ceramic network and the crystallization of GeO2 as a predominant phase.
The structural changes observed in the glass-ceramic samples subjected to different heat-treatment temperatures are consistent with trends previously reported in the literature. For example, Hosono and Abe57 demonstrated that in glass systems based on Li2O-CaO-TiO2-P2O5, the crystallization process predominantly yields LiTi2(PO4)3, β-Ca3(PO4)2, and minor traces of TiO2. Likewise, Gimenez et al.54 reported that in titanophosphate glass ceramics, besides the precipitation of the NASICON and Ca3(PO4)2 phases, these species can further react with each other in the solid state. As a result, secondary crystalline products such as β-Ca2P2O7, Li(TiO)PO4, and TiO2 are formed. The TiO2 phase, being insoluble in acidic media, inhibits the isolated formation of the LiTi2(PO4)3 NASICON phase.
Analogously, in the present germanophosphate glass-ceramic system, both heat treatments at 658 and 750 °C resulted in the crystallization of NASICON and Ca3(PO4)2 phases, along with the appearance of additional phases such as GeO2, pyrophosphates, and phosphates. This behavior closely parallels the findings of Gimenez et al.54 and suggests that similar solid-state reactions may occur in the current system. These reactions likely follow the mechanism schematically represented in equation 3, involving the progressive decomposition of phosphate linkages and rearrangement of the structural network. The Raman spectra (Figure 3a) corroborate this interpretation, showing a decrease in the bonding density associated with P-O-Ge and P-O-P vibrations as the temperature increases. Such spectral changes support the hypothesis that the heat treatment promotes depolymerization of the phosphate network and facilitates the formation of GeO2 and pyrophosphate-type crystalline phases.
The parameter x in the proposed solid-state reaction can be interpreted as a quantitative indicator of the reaction extent and direction. A higher value of x reflects a greater consumption of the LiGe2(PO4)3 and β-Ca3(PO4)2 phases, leading to a more pronounced formation of secondary crystalline products. Although x does not reach zero, indicating that a complete conversion into only two crystalline phases is not achieved, its value clearly depends on the thermal treatment. In this context, even a modest increase in temperature, from 658 to 750 °C, promotes a higher x, suggesting that elevated thermal energy enhances the progression of the solid-state reaction and favors the transformation of the primary NASICON and phosphate phases into additional phases such as GeO2, LiCaPO4, and pyrophosphates.
Leaching of glass-ceramic phases in HCl and H3PO4 solutions: characterization of residual phases and monolith structure
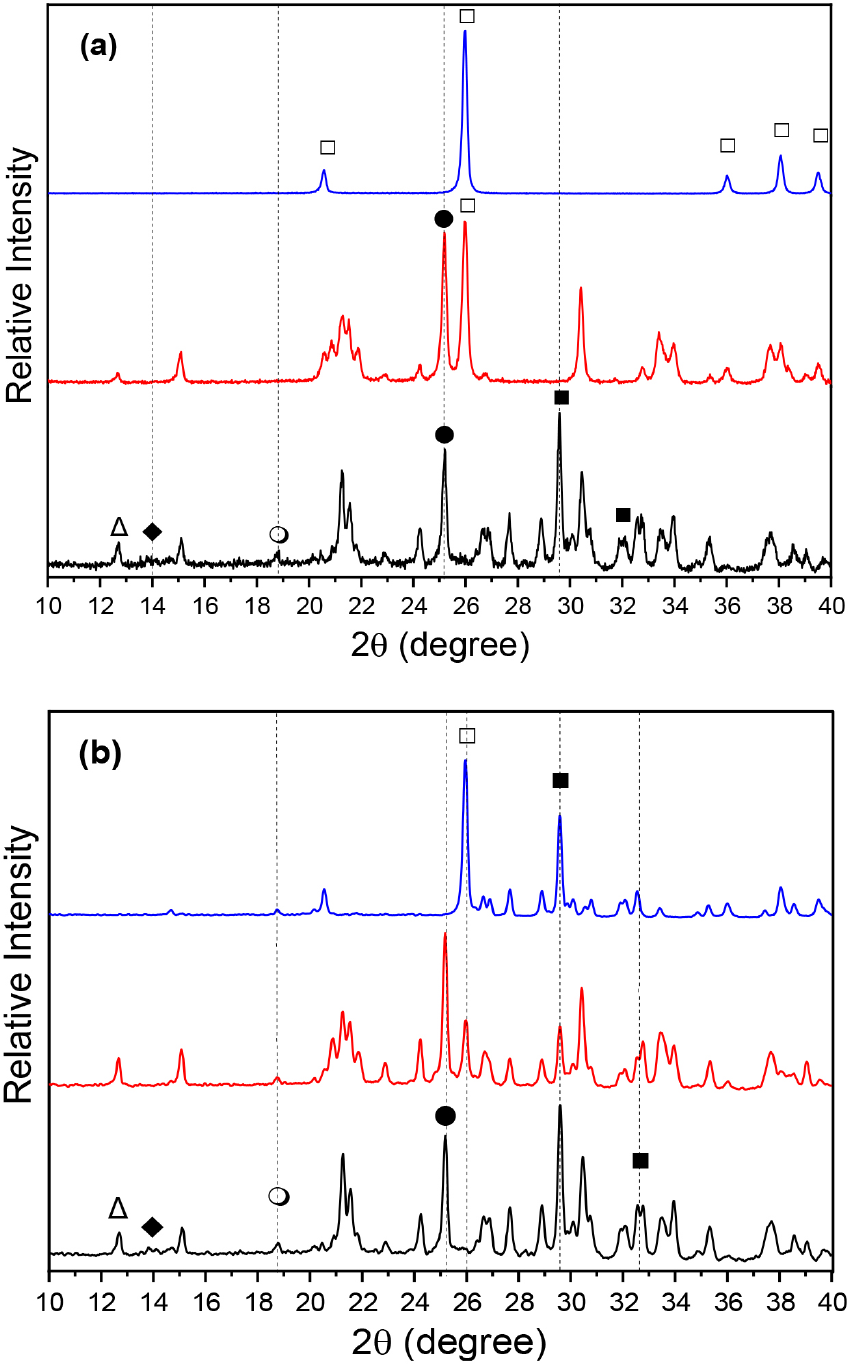
The XRD patterns of the glass-ceramic samples heat-treated at 658 °C, before (gc LGeCP-658) and after acid leaching in aqueous HCl and H3PO4 solutions at 25 and 70 °C, are shown in Figure 4. As seen in Figure 4a, leaching in HCl at 25 °C leads to the dissolution of the β-Ca2P2O7, GeP2O7, and LiCaPO4 phases, while the LiGe2(PO4)3 (NASICON) and GeO2 phases remain, along with residual β-Ca3(PO4)2, which is only partially leached. The latter behavior is evidenced by the attenuation of the diffraction peak at 2θ = 12.6°, whose relative intensity decreases to approximately one-third of that of the 2θ = 15° peak, corresponding to the NASICON phase.
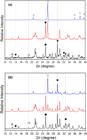
(a) XRD patterns of gc-LGeCP-658 (black line), pgc-LGeCP-658-HCl-25 (red line), and pgc-LGeCP-658-HCl-70 (blue line); (b) XRD patterns of gc-LGeCP-658 (black line), pgc-LGeCP-658-H3PO4-25 (red line), and pgc-LGeCP-658-H3PO4-70 (blue line). The identified crystalline phases are indicated as follows: ∆: β-Ca3(PO4)2; ♦: LiCaPO4; ■: β-Ca2P2O7; □: GeO2; ●: LiGe2(PO4)3; ○: GeP2O7.
It is well established that metaphosphate and pyrophosphate structures are generally more susceptible to acid dissolution than orthophosphates.58 This explains the preferential removal of β-Ca2P2O7 and GeP2O7 and the relative stability of the NASICON phase under mild leaching conditions. In contrast, when the leaching is performed in HCl at 70 °C, a complete dissolution of the NASICON and LiCaPO4 phases is observed, leaving GeO2 as the sole crystalline residue in the monolithic framework, as evidenced by the diffractogram showing only the reflections of the GeO2 phase. As shown in Figure 4b, the diffractogram of pgc-LGeCP-658-H3PO4-25 reveals suppression of the peak at 2θ = 14°, associated with LiCaPO4, indicating the dissolution of this phase. However, the β-Ca2P2O7, GeP2O7, and β-Ca3(PO4)2 phases remain unaffected. This observation suggests that PO43- ions from the phosphoric acid enter the glass-ceramic network, promoting the reprecipitation of phosphate-based crystalline phases at the monolith surface. When leaching is conducted in H3PO4 at 70 °C, the diffraction peaks at 2θ = 12.6° and 25.0°, corresponding to β-Ca3(PO4)2 and LiGe2(PO4)3 (NASICON), respectively, are suppressed. Under these conditions, the remaining crystalline phases in the monolith are GeO2, β-Ca2P2O7, and GeP2O7, indicating that elevated temperature and the phosphate-rich acidic environment favor the stabilization of these phases at the expense of NASICON and orthophosphate species.
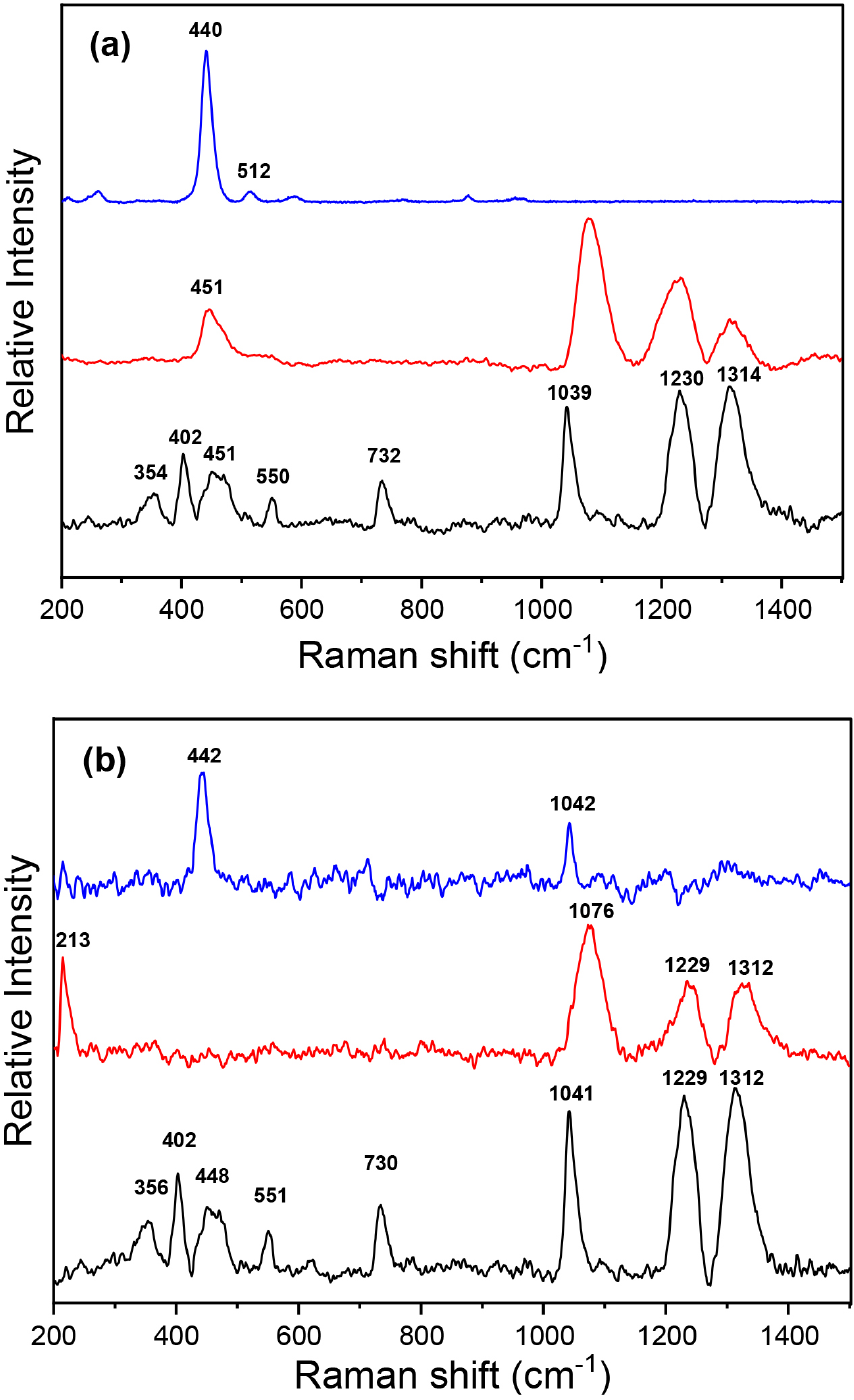
In agreement with the XRD results, the Raman spectra (Figure 5a) of pgc-LGeCP-658-HCl-25 show that the band assigned to the pyrophosphate structure at 732 cm-1 is no longer observed, even at 25 °C. In addition, the bands located at 1039, 1230, and 1314 cm-1 confirm the presence of the LiG2(PO4)3 (NASICON) phase, while the disappearance of the band at 402 cm-1 indicates the dissolution of the β-Ca3(PO4)2 phase. Upon leaching in HCl at 70 °C, the orthophosphate-related bands also vanish completely, evidencing the full dissolution of the NASICON phase under stronger acid and thermal conditions.
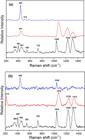
(a) Raman spectra of gc-LGeCP-658 (black line), pgc-LGeCP-658-HCl-25 (red line), and pgc-LGeCP-658-HCl-70 (blue line); (b) Raman spectra of gc-LGeCP-658 (black line), pgc-LGeCP-658-H3PO4-25 (red line), and pgc-LGeCP-658-H3PO4-70 (blue line).
In contrast, the Raman spectra of samples leached in H3PO4 (Figure 5b) reveal that a greater number of vibrational features are preserved at both 25 and 70 °C. The spectra exhibit clear evidence of pyrophosphate and metaphosphate species, characterized by bands at 1076 cm-1 (pyrophosphate) and at 1229 and 1312 cm-1 (metaphosphate structures).59 Furthermore, a characteristic band of crystalline GeO2 appears at 213 cm-1. However, for the sample leached in H3PO4 at 70 °C, the metaphosphate bands are no longer detected, while the intensity of the 442 cm-1 band, attributed to the Ge-O-Ge stretching vibration of GeO2, increases relative to the pyrophosphate band at 1042 cm-1. This intensity change indicates the predominance of the GeO2 phase after high-temperature phosphoric-acid leaching, consistent with the phase evolution inferred from the XRD analysis.
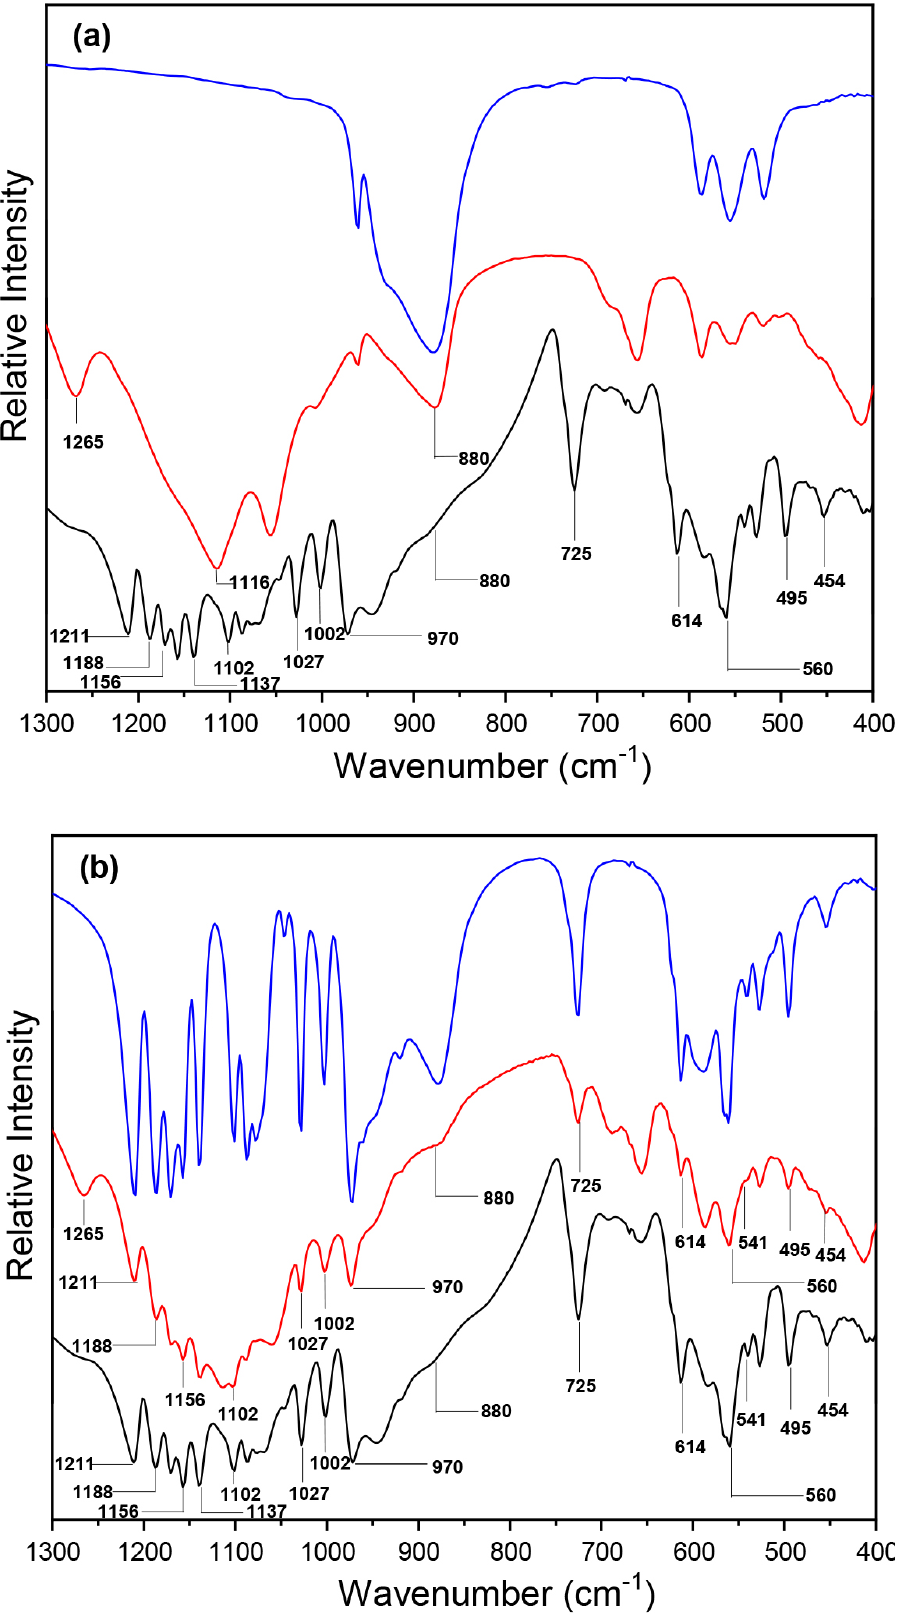
The solubility behavior of the crystalline phases during leaching in aqueous HCl is further confirmed by the FTIR spectra (Figure 6a). Most of the absorption bands in the 1000-1200 cm-1 region, characteristic of the β-Ca2P2O7 and GeP2O7 phases, are strongly suppressed after leaching at 25 °C. More specifically, the dissolution of pyrophosphate species is evidenced by the disappearance of the 725 cm-1 band, while the attenuation of bands at 614, 1027, 1140, 1156, 1188, and 1211 cm-1, associated with orthophosphate units within the NASICON structure, confirms their partial removal. Simultaneously, the enhancement of the bands at 518, 558, 586, 880, and 962 cm-1, attributed to Ge-O stretching vibrations of the GeO2 phase, indicates the relative enrichment of GeO2 after leaching at 25 °C, a trend consistent with the Raman spectra.
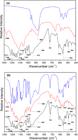
(a) FTIR spectra of gc-LGeCP-658 (black line), pgc-LGeCP-658-HCl-25 (red line), and pgc-LGeCP-658-HCl-70 (blue line); (b) FTIR spectra of gc-LGeCP-658 (black line), pgc-LGeCP-658-H3PO4-25 (red line), and pgc-LGeCP-658-H3PO4-70 (blue line).
At 70 °C, the FTIR spectrum of the HCl-leached sample reveals a complete disappearance of the bands at 1116 and 1265 cm-1, which are diagnostic of the NASICON framework. In contrast, the spectrum displays well-defined absorptions at 880, 614, 560, and 495 cm-1, all characteristic of GeO2. These results confirm that leaching in HCl at 70 °C promotes the dissolution of phosphate-based phases and NASICON domains, yielding a porous glass-ceramic skeleton composed predominantly of GeO2. Similarly, the FTIR spectra of samples leached in aqueous H3PO4 (Figure 6b) corroborate the precipitation phenomena inferred from the Raman data (Figure 5b). Upon leaching at 25 °C, the 880 cm-1 band assigned to GeO2 appears, together with a prominent band at 725 cm-1 and a group of bands between 1100-1200 cm-1, indicative of the coexistence of NASICON, GeO2, β-Ca2P2O7, and GeP2O7 phases in the porous monolith.
Conversely, the FTIR spectrum obtained after leaching in H3PO4 at 70 °C exhibits only the bands corresponding to pyrophosphate and GeO2, with no detectable orthophosphate or metaphosphate bands, suggesting that elevated temperature favors the decomposition of phosphate linkages and the predominance of the GeO2 crystalline framework.
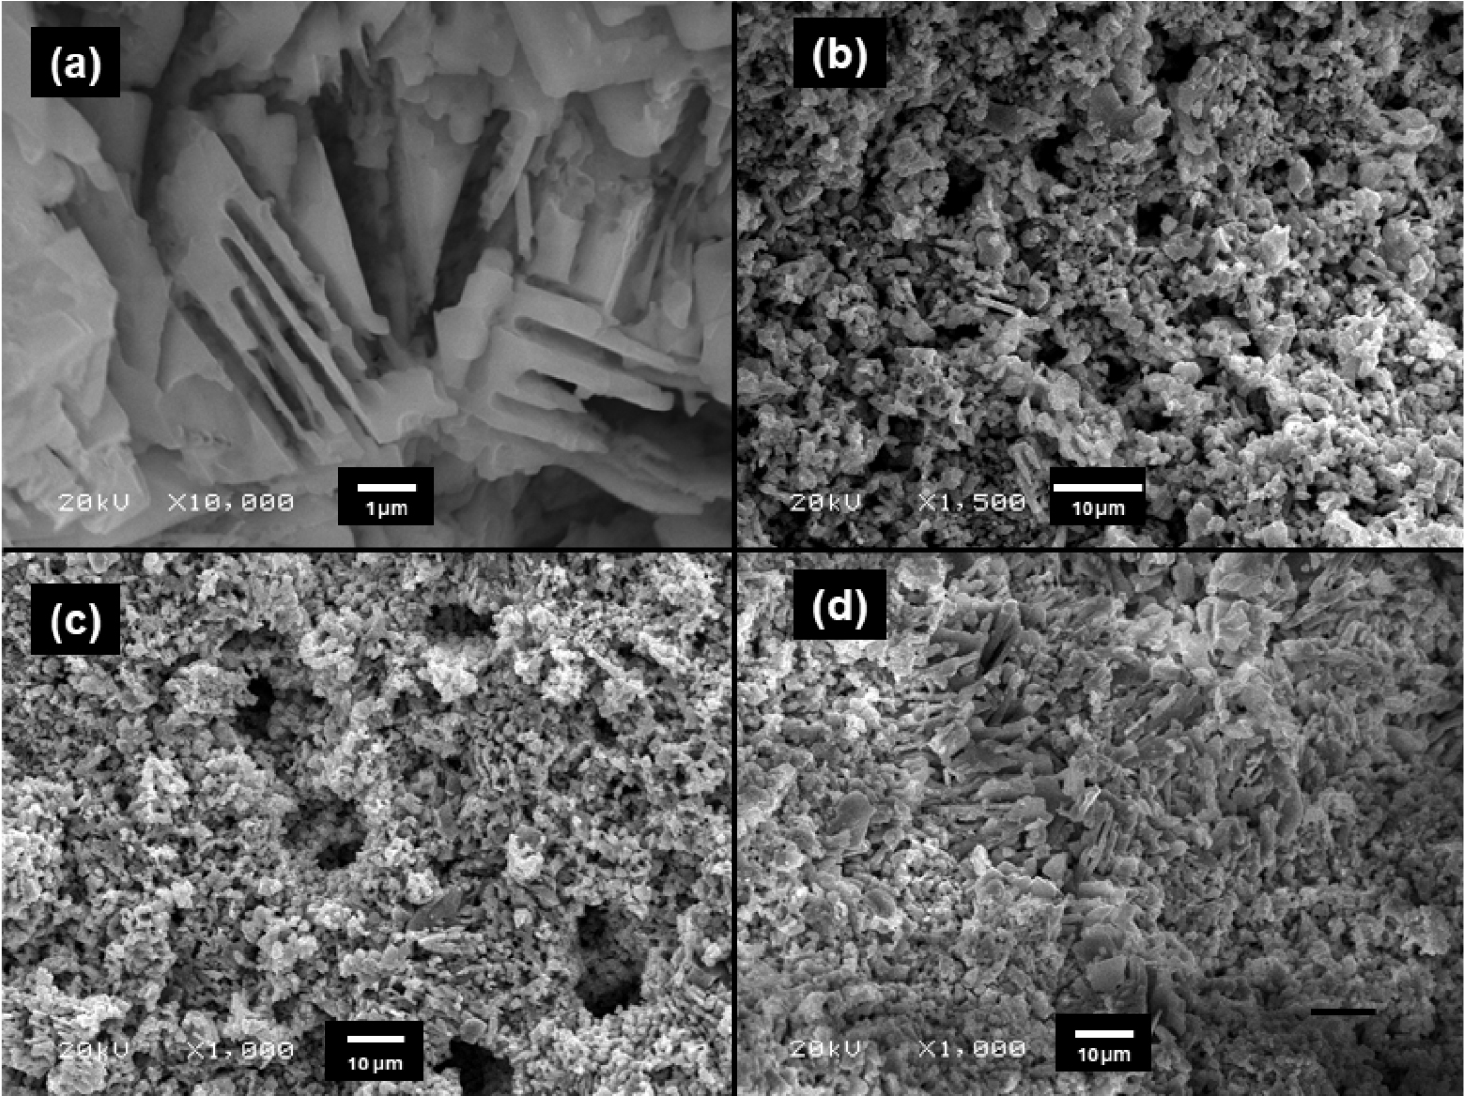
To elucidate the morphological characteristics of the porous glass-ceramic samples, scanning electron microscopy (SEM) analyses were carried out under the different leaching and heat-treatment conditions described above. Figure 7a shows the SEM micrograph of pgc LGeCP 658-HCl-25, which exhibits a compact porous network with an average pore size of approximately 1 μm. In contrast, the monolith obtained from the sample heat-treated at 750 °C and leached under the same HCl conditions (pgc-LGeCP-750-HCl-25, Figure 7b) displays significantly larger pores, with an average size of about 5 μm. This increase in pore size can be correlated with the higher x-coefficient in equation 3, which reflects a greater extent of reaction at 750 °C. The higher thermal energy promotes the formation and subsequent dissolution of pyrophosphate and other soluble phases (β-Ca2P2O7 and GeP2O7), as confirmed by the XRD results (Figure 2), leading to more extensive pore development. The pgc LGeCP-658-HCl-25 sample, on the other hand, exhibits a “pop-stick” morphology typical of surface-driven crystallization processes,60,61 where partial devitrification at the glass surface results in elongated crystalline features embedded in an amorphous matrix.
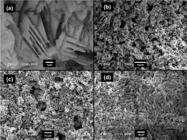
SEM micrographs of (a) pgc-LGeCP-658-HCl-25; (b) pgc-LGeCP-750-HCl-25; (c) pgc-LGeCP-750-H3PO4-25; (d) pgc-LGeCP-750-H3PO4-70. Larger pores are observed when the glass-ceramic samples are leached in H3PO4 solution.
Figure 7c presents the SEM image of pgc-LGeCP-750-H3PO4-25, which reveals a highly porous microstructure with average pores of approximately 10 μm. This morphology indicates that a greater fraction of crystalline phases has been leached, consistent with the dissolution of pyrophosphate species and the reprecipitation of phosphate-rich residues facilitated by PO43- ions from the phosphoric acid solution. These results are in good agreement with the XRD data (Figure 4b), which confirmed the persistence of GeO2, β-Ca2P2O7, and GeP2O7 phases under these conditions.
Finally, leaching in H3PO4 at 70 °C leads to the formation of monoliths with significantly lower porosity, as observed in Figure 7d. This effect arises from the complete dissolution of the NASICON phase and the predominance of the GeO2 framework, with only minor traces of pyrophosphate remaining. The resulting structure is denser and mechanically more stable, indicating that high-temperature leaching in phosphoric acid favors the development of compact GeO2-based porous materials.
Conclusions
This study elucidated the influence of thermal treatment and acid leaching conditions on the phase evolution and morphology of porous NASICON-type glass-ceramics derived from the 6Li2O-24GeO2-39CaO-31P2O5 (mol%) composition. Heat treatment at 658 °C proved to be decisive for the nucleation and stabilization of the NASICON phase, whereas higher temperatures (750 °C) promoted the formation of secondary crystalline species such as GeO2 and LiCaPO4. Among the leaching conditions investigated, phosphoric acid (H3PO4, 1 mol L-1) at 25 °C yielded monoliths exhibiting superior structural integrity, enlarged pores (ca. 10 µm), and enhanced phase selectivity due to the preferential dissolution of soluble metaphosphate and pyrophosphate phases. In contrast, leaching in HCl at 25 °C generated smaller pores (ca. 1 µm) with residual GeO2, while leaching at 70 °C, regardless of the acid, led to the complete dissolution of the NASICON phase. These findings provide new insights into the coupled effects of heat-treatment and chemical leaching parameters, offering valuable guidelines for the rational design of porous glass-ceramics with tunable morphology and high phase purity for advanced applications in energy storage, catalysis, and solid-state sensing.
Acknowledgments
The authors are grateful to CNPq (310131/2020-0, 306073/2024 2 and 165190/2021-3) for financial support.
Data Availability Statement
The authors confirm that the data supporting the findings of this study are available within the text.
References
-
1 Ayaz, M.; Hijji, M.; Alatawi, A. S.; Mansour, A.; Aggoune, E.-H. M.; Energy Technol. 2024, 13, 2400027. [Crossref]
» Crossref -
2 Santos, H. A.; Nano Sel. 2024, 5, e202400088. [Crossref]
» Crossref -
3 Sábio, R. M.; Carvalho, G. C.; Li, J.; Chorilli, M.; Santos, H. A.; Nano Sel. 2024, 5, 2300114. [Crossref]
» Crossref -
4 Ma, J.; Zhang, X.; Huang, X.; Gong, J.; Xie, Z.; Li, P.; Chen, Y.; Liao, Q.; J. Sep. Sci. 2023, 46, 2300205. [Crossref]
» Crossref -
5 Zhao, Y.-L.; Zhang, X.; Li, M.-Z.; Li, J.-R.; Chem. Soc. Rev. 2024, 53, 2056. [Crossref]
» Crossref -
6 Jie, W.; Zhenyu, L.; Xin, H.; Tao, Y.; Mengliang, L.; Qiubai, D.; Khalid, K.; Zhongyuan, L.; Shuzhen, L.; Int. J. Environ. Res. 2021, 15, 681. [Crossref]
» Crossref -
7 Wang, J.; He, T.; Yang, X.; Cai, Z.; Wang, Y.; Lacivita, V.; Kim, H.; Ouyang, B.; Ceder, G.; Nat. Commun. 2023, 14, 5210. [Crossref]
» Crossref -
8 Guan, S.; Lu, J.; Li, Y.; Xie, D.; Zhuang, C.; Zhang, W.; Ceram. Int. 2025, 51, 1172. [Crossref]
» Crossref -
9 Xu, L.; Guo, Y.; Ye, D.; Wu, W.; Qiu, S.; Wu, X.; Powder Technol. 2024, 434, 119335. [Crossref]
» Crossref -
10 Zhu, L.; Xiang, S.; Wang, M.; Sun, D.; Huang, X.; Li, Y.; Tang, Y.; Peng, Z.; Zhang, Q.; Wang, H.; Adv. Mater. 2025, 37, 2408918. [Crossref]
» Crossref -
11 Wang, Z.; Park, S.; Deng, Z.; Carlier, D.; Chotard, J.-N.; Croguennec, L.; Gautam, G. S.; Cheetham, A. K.; Masquelier, C.; Canepa, P.; J. Mater. Chem. A 2022, 10, 209. [Crossref]
» Crossref -
12 Chen, R.; Yao, C.; Yang, Q.; Pan, H.; Yu, X.; Zhang, K.; Li, H.; ACS Appl. Mater. Interfaces 2021, 13, 18743. [Crossref]
» Crossref -
13 Abramchuk, M.; Voskanyan, A. A.; Arinicheva, Y.; Lilova, K.; Subramani, T.; Ma, Q.; Dashjav, E.; Finsterbusch, M.; Navrotsky, A.; J. Phys. Chem. Lett. 2021, 12, 4400. [Crossref]
» Crossref -
14 Samigullin, R. R.; Zakharkin, M. V.; Drozhzhin, O. A.; Antipov, E. V.; Energies 2023, 16, 3051. [Crossref]
» Crossref -
15 He, Y.; Scivally, E.; Shaji, A.; Ouyang, B.; Zeng, Y.; Adv. Energy Mater. 2024, 15, 2403877. [Crossref]
» Crossref -
16 Wang, J.; Kang, J.; Guo, X.; Hu, S.; Tang, Y.; Jin, L.; Wei, X.; J. Alloys Compd. 2024, 988, 174327. [Crossref]
» Crossref -
17 Iordache, M.; Oubraham, A.; Petreanu, I.; Sisu, C.; Borta, S.; Capris, C.; Soare, A.; Marinoiu, A.; Materials 2024, 17, 823. [Crossref]
» Crossref -
18 Salgueiro, T. A.; Veloso, R. C.; Ventura, J.; Danzi, F.; Oliveira, J.; Batteries 2024, 10, 157. [Crossref]
» Crossref -
19 Jian, Z.; Hu, Y.-S.; Ji, X.; Chen, W.; Adv. Mater. 2017, 29, 1601925. [Crossref]
» Crossref -
20 Ahsan, M. T.; Ali, Z.; Usman, M.; Hou, Y.; Carbon Energy 2022, 4, 776. [Crossref]
» Crossref -
21 Goodenough, J. B.; Hong, H. Y.-P.; Kafalas, J. A.; Mater. Res. Bull. 1976, 11, 203. [Crossref]
» Crossref -
22 Iordache, M.; Oubraham, A.; Borta, S.; Ungureanu, G.; Marinoiu, A.; Energies 2024, 17, 5241. [Crossref]
» Crossref -
23 Wang, J.; Gao, Q.; Li, C.; Zhang, J.; Zhang, Q.; Han, Y.; J. Catal. 2024, 436, 115612. [Crossref]
» Crossref -
24 Yan, J.; Zhu, J.; Zhang, L.; Li, Y.; Wang, H.; Wang, L.; Ionics 2023, 29, 2271. [Crossref]
» Crossref -
25 Danilova, M. N.; Pylinina, A. I.; Kasatkin, E. M.; Bratchikova, I. G.; Mikhalenko, I. I.; Yagodovskii, V. D.; Kinet. Catal. 2015, 56, 476. [Crossref]
» Crossref -
26 Tieu, A. J. K.; Mahayoni, E.; Li, Y.; Deng, Z.; Fauth, F.; Chotard, J.-N.; Seznec, V.; Adams, S.; Masquelier, C.; Canepa, P.; J. Mater. Chem. A 2023, 11, 23233. [Crossref]
» Crossref -
27 Jaschin, P. W.; Tang, C. R.; Wachsman, E. D.; Energy Environ. Sci. 2024, 17, 727. [Crossref]
» Crossref -
28 Sharma, P. P.; Mohammed, S.; Aburabie, J.; Hashaikeh, R.; Membranes 2023, 13, 562. [Crossref]
» Crossref -
29 Yu, S.; Xu, Q.; Lu, X.; Liu, Z.; Windmüller, A.; Tsai, C.-L.; Buchheit, A.; Tempel, H.; Kungl, H.; Wiemhöfer, H.-D.; Eichel, R.-A.; ACS Appl. Mater. Interfaces 2021, 13, 61067. [Crossref]
» Crossref -
30 Ma, C.; Hao, X.; Yang, X.; Liang, X.; Liu, F.; Liu, T.; Yang, C.; Zhu, H.; Lu, G.; Sens. Actuators, B 2018, 256, 648. [Crossref]
» Crossref -
31 Pratiwi, V. M.; Wibowo, A. A.; Widyastuti, W.; Purwaningsih, H.; Maulana, F. A.; Mater. Sci. Forum 2019, 964, 168. [Crossref]
» Crossref -
32 Zhang, Y.; Ma, C.; Yang, X.; Song, Y.; Liang, X.; Zhao, X.; Wang, Y.; Gao, Y.; Liu, F.; Liu, F.; Sun, P.; Lu, G.; Sens. Actuators, B 2019, 295, 56. [Crossref]
» Crossref -
33 Shimizu, Y.; Ogawa, T.; Ueda, T.; Kamada, K.; Hyodo, T.; ECS Meet. Abstr. 2021, MA2021-02, 1589. [Crossref]
» Crossref -
34 Tiwari, M. K.; Kanwade, A.; Yadav, S. C.; Srivastava, A.; Satrughna, J. A. K.; Shirage, P. M.; J. Mater. Chem. C 2023, 11, 5469. [Crossref]
» Crossref -
35 Modak, S.; Valle, J.; Tseng, K.-T.; Sakamoto, J.; Kwabi, D. G.; ACS Appl. Mater. Interfaces 2022, 14, 19332. [Crossref]
» Crossref -
36 Moshareva, M. A.; Il’in, A. B.; Zhilyaeva, N. A.; Novikova, S. A.; Yaroslavtsev, A. B.; Nanotechnol. Russ. 2017, 12, 514. [Crossref]
» Crossref -
37 He, L.; Oh, J. A. S.; Watarai, K.; Morita, M.; Zhao, Y.; Sun, Q.; Sakamoto, T.; Lu, L.; Adams, S.; Chem. Mater. 2021, 33, 6841. [Crossref]
» Crossref -
38 Senthilkumar, K. K.; Thiruvengadathan, R.; Raghava, R. B. T. S.; Electrochem 2025, 6, 6. [Crossref]
» Crossref -
39 Mieritz, D.; Davidowski, S. K.; Seo, D.-K.; J. Solid State Chem. 2016, 242, 116. [Crossref]
» Crossref -
40 Amou, M.; Larhrib, B.; Sabi, N.; Srout, M.; Assen, A. H.; Mansori, M.; Dolotko, O.; Oueldna, N.; Martinez, H.; Saadoune, I.; J. Energy Storage 2023, 70, 107889. [Crossref]
» Crossref -
41 Gebi, A. I.; Dolokto, O.; Mereacre, L.; Geckle, U.; Radinger, H.; Knapp, M.; Ehrenberg, H.; ChemSusChem 2024, 17, e202300809. [Crossref]
» Crossref -
42 Edison, E.; Parrilli, A.; Tervoort, E.; Eliasson, H.; Niederberger, M.; ACS Appl. Mater. Interfaces 2023, 15, 32313. [Crossref]
» Crossref -
43 Martínez-Cisneros, C. S.; Pandit, B.; Antonelli, C.; Sanchez, J. Y.; Levenfeld, B.; Varez, A.; J. Eur. Ceram. Soc. 2021, 41, 7723. [Crossref]
» Crossref -
44 Ortiz-Mosquera, J. F.; Nieto-Muñoz, A. M.; Rodrigues, A. C. M.; J. Alloys Compd. 2021, 850, 156670. [Crossref]
» Crossref -
45 Zhang, L.; Liu, S.; J. Non-Cryst. Solids 2018, 500, 366. [Crossref]
» Crossref -
46 Suzuki, M.; Tanaka, T.; High Temp. Mater. Processes 2012, 31, 323. [Crossref]
» Crossref -
47 Zhang, Z.; ACS Phys. Chem. Au 2024, 4, 696. [Crossref]
» Crossref -
48 Mazali, I. O.; Romano, R.; Alves, O. L.; Thin Solid Films 2006, 495, 64. [Crossref]
» Crossref -
49 Zhao, J.; Liu, S.; Ceram. Int. 2024, 50, 1725. [Crossref]
» Crossref -
50 Herzel, H.; Grevel, K.-D.; Emmerling, F.; Dachs, E.; Benisek, A.; Adam, C.; Majzlan, J.; J. Mater. Sci. 2020, 55, 8477. [Crossref]
» Crossref -
51 Sreedharan, O. M.; Athiappan, E.; Pankajavalli, R.; Gnanamoorthy, J. B.; J. Less-Common Met. 1979, 68, 143. [Crossref]
» Crossref -
52 Phani, A. R.; Di Claudio, D.; Passacantando, M.; Santucci, S.; J. Non-Cryst. Solids 2007, 353, 692. [Crossref]
» Crossref -
53 Ivanova, T. N.; Bykov, V. N.; Russ. Metall. (Met.) 2010, 2010, 678. [Crossref]
» Crossref -
54 Gimenez, I. F.; Mazali, I. O.; Alves, O. L.; J. Phys. Chem. Solids 2001, 62, 1251. [Crossref]
» Crossref -
55 Lenz, G. F.; Schneider, R.; de Aguiar, K. M. F. R.; Bini, R. A.; Chaker, J. A.; Hammer, P.; Botteselle, G. V.; Felix, J. F.; Schneider, R.; RSC Adv. 2019, 9, 17157. [Crossref]
» Crossref -
56 Ngo, D. T.; Kalubarme, R. S.; Le, H. T. T.; Park, C.-N.; Park, C.-J.; Nanoscale 2015, 7, 2552. [Crossref]
» Crossref -
57 Hosono, H.; Abe, Y.; J. Non-Cryst. Solids 1995, 190, 185. [Crossref]
» Crossref -
58 Ust’yantsev, V. M.; Tretnikova, M. G.; Kelareva, E. I.; Mangalova, L. I.; Refractories 1978, 19, 317. [Crossref]
» Crossref -
59 Ilieva, D.; Jivov, B.; Bogachev, G.; Petkov, C.; Penkov, I.; Dimitriev, Y.; J. Non-Cryst. Solids 2001, 283, 195. [Crossref]
» Crossref -
60 Mazali, I. O.; Alves, O. L.; J. Braz. Chem. Soc. 2004, 15, 464. [Crossref]
» Crossref -
61 Mazali, I. O.; Alves, O. L.; J. Mater. Sci. Lett. 2001, 20, 2113. [Crossref]
» Crossref