Evaluation of Two Methods for Dyeing Alpaca Fibers Using Synozol Red K3BS and Novacron Navy FN-BN
Abstract
The objective of this research study was to compare the conventional exhaustion method (CN) and the ultrasound-assisted depletion method (US) in the dyeing of alpaca fibers with azo textile dyes Synozol Red K3BS and Novacron Navy FN-BN. The analytical method was validated by UV-Vis spectroscopy, which demonstrated adequate linearity and sensitivity. To optimize US, a 32 factorial design was carried out with temperature factors of 60, 70 and 80 °C, using Baby alpaca, Fleece and Huarizo fibers, which determined that Baby dyeing at 80 °C maximizes exhaustion of the dyes. These parameters were used to compare US with CN using the F-test and t-test, which indicated no statistically significant difference the depletion of the dyes in both methods. Different color fastness tests were performed in both methods using digital images. The paired t-test was also performed, resulting in a p-value greater than 0.05, which shows that US does not compromise the color fastness of the fibers.
Keywords:
alpaca fiber; conventional depletion; color fastness; dye
Introduction
The textile industry is considered to be one of the largest energy consumers worldwide due to the amount of energy required to increase the dyeing temperature.1 This is why it is necessary to implement new methods that permits a production increase without compromising quality while minimizing its environmental impact.2
Ultrasound waves in a liquid medium create negative pressures that form bubbles until they implode, generating “hot spots” of 1000 atm, transient temperatures of 1000 K,3 shock waves and strong shear forces that can break up chemical bonds.4 This phenomenon is called cavitation, also known as “cold boiling” which in the contact zone with a solid surface accelerates the dyeing of fibers by generating “micro-jets” of 110 m s-1 towards the pores of the solid surface.5,6 The dispersion of dye aggregates, degassing of air trapped in the fiber capillaries, diffusion of the dye in the fibers, intense vibration of the liquid medium, destruction of the dye/fiber diffusion layer and the expansion of the polymeric amorphous regions are chemical and physical effects that could explain the positive results in ultrasound-assisted coloring processes.4 Ultrasonic dyed textile fibers include jute, bamboo, lyocell, linen, polyester, goat hair, nylon, sheep wool, acrylic fabrics, silk, cotton and cellulose acetate7-18 with a variety of textile dyes including reactive dyes, disperse dyes, natural dyes and basic dyes.10,12,17
Ultrasound applied to textile pre-treatment processes includes bio-preparation (enzymatic processing of fibers), washing (removal of impurities), bleaching and dyeing. It is also applied in technologies for cutting, welding, sealing and sewing of garments.19 Commercial equipment is ultrasound baths and ultrasonic probes. Ultrasonic baths are stainless steel tanks with transducers at the bottom. Such modern equipment allows you to control temperature, time, amplitude and the applied frequency. Ultrasonic probes are stainless steel or titanium tip devices that transmit sound directly into the medium, exposing it to metallic contamination, erosion, and uncontrolled heat transmission, concentrates ultrasonic power in small volumes and reduces energy losses; these tip devices are replaceable and relatively inexpensive to do so.20
Alpaca fiber is considered a luxury fiber for its lightness, fineness, softness, image and reputation in much the same way as other diverse animal fibers such as mohair, cashmere and angora.21 These fibers are conventionally dyed at high temperatures for a long time due to the dense flake structure and hydrophobic lipid layer on the surface of the fiber.22 Even though these conditions are necessary to increase dye absorption23 and improve color fastness,24 exposure to these temperatures for a long time damages the properties of the fiber such as its brilliance. Therefore, to ensure appropriate energy savings and quality improvement, very high dyeing temperatures should be avoided.23
Artisanal dyeing in Peru has a long history and plays an important role in the culture and economy. Artisans in the region use ancestral techniques and knowledge passed down from generation to generation to achieve vibrant, long-lasting colors in alpaca garments.25 In today’s textile manufacturing industry, it has increasingly been reported that ultrasound can accelerate chemical and physical reactions through the cavitation phenomenon10 allowing a relatively fast and uniform mass transfer (the main objective in the textile dyeing process) which would otherwise require higher temperatures, longer processing times and/or greater consumption of chemical additives.16 In this context, then, the use of ultrasound can help improve the efficiency of the dyeing process, reducing the need for aggressive chemicals and reducing resource consumption without compromising the quality and authenticity of the colors obtained.9 On the other hand, studies report energy savings, more environmentally friendly processes and also higher color yield production compared to conventional dyeing techniques.16,26 Where, the concentration of the dye affects the efficiency of the discoloration processes as well as subsequent effluent treatments.27
To that end, this study intends to compare ultrasound-assisted depletion method (US) and conventional exhaustion method (CN) applied to alpaca fibers, to demonstrate the effect of ultrasound on the absorption of Synozol Red K3BS and Novacron Navy FN-BN dye.
Experimental
Validation of the spectrophotometric method
A spectral scan was performed between 400-700 nm to obtain Synozol Red K3BS (λmax 542 nm) and Novacron Navy FN-BN (λmax 592 nm) readings. We validated a spectrophotometric method, for which stock solutions of 50 and 200 mg L-1 of Synozol Red K3BS and Novacron Navy FN-BN, respectively, were prepared. Standard solutions of 2.5, 5, 10, 20, 30, 40 and 50 mg L-1 were obtained. Absorbance was then recorded in triplicate using distilled water as a blank.
A scatter plot of the dye concentration (mg L-1) and the average absorbance was obtained. The limit of detection (LOD) and quantification (LOQ) of the method was determined using the formula reported by Ortiz and Ramírez.28
Dyeing process
Fiber conditioning
1 kg of tops of 03 qualities of alpaca fibers were acquired; Huarizo, Fleece and Baby from a local company. 30 g of each type of fiber were weighed and washed with 2% Extran® MA 02 neutral detergent for 10 min at 60 °C, then rinsed in a water bath at 40 °C and subsequently, a second rinse with water was applied at 40 °C.
Dyeing stock solution
1.4 and 0.45 g of Synozol Red K3BS and Novacron Navy FN-BN, respectively, were weighed in a 1 L container, leveling and homogenizing it with distilled water. To determine its true concentration, a 100 µL aliquot was transferred to a 10 mL vial, making up to the mark and homogenizing it with distilled water. Its absorbance was then measured in triplicate.
Conventional dyeing
25 mL of the dyeing stock solution was transferred to a flask, alum (potassium aluminum sulfate salt) (8 g L-1) and citric acid (1.33 g L-1) were added and homogenized with distilled water in a water bath at 90 °C for 15 min.
Dyeing was started by completely immersing 1 g of fiber in the 25 mL of the homogenized solution (bath ratio of 1:25) and ended after 30 min. The 3 qualities of alpaca fiber were dyed in triplicate for each dye.
Ultrasound dyeing
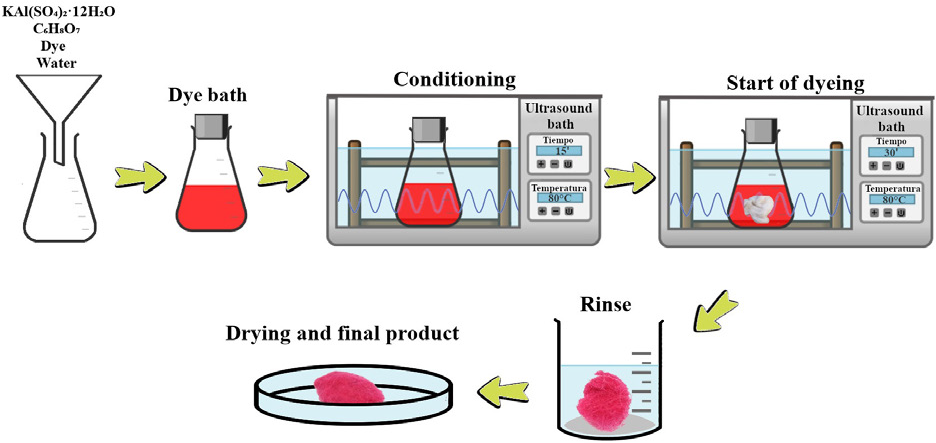
Ultrasound-assisted dyeing was carried out in the ultrasound bath, maintaining the parameters of conventional dyeing except for the temperature. In accordance with what was described by Larik et al.,16 Babar et al.,9 and Islam and Ke,29 who worked at temperatures lower than the conventional process, the temperatures of 60, 70 and 80 °C were selected, as these are the most frequently used in ultrasound processes. Figure 1 shows the ultrasound staining set-up.

During conventional and ultrasound staining, a sample portion of 100 and 200 µL of Synozol Red K3BS and Novacron Navy FN-BN, respectively, was taken every 5 min, transferred to a 5 mL vial, rooted and homogenized with distilled water.
Experimental design
To investigate the effects of the variables that intervene in a depletion process, a three-level factorial design 32 was carried out with three repetitions at each point, as shown in Table 1. The variables to be studied were temperature and fiber quality. In order to establish the response variable, the following equation was used to obtain the percentage of depletion:
Factorial design 32 used to determine percentage depletion of Synozol Red K3BS and Novacron Navy FN-BN dyes in alpaca wool
where C0 is the initial concentration of the dye, and Cf is the final concentration of the dye at the culmination of the dyeing process.
Color fastness
The color fastness tests were carried out comparing the conventional method with the ultrasound method at 80 °C. The following standards: ISO 105-E01;30 ISO 105 E02;31 ISO 105-E08;32 ISO 105-C10;33 ISO 105 E05;34 ISO 105 E0635 and AATCC TM6136 were applied to evaluate color fastness when subjected to water, seawater, hot water, washing with soap, staining with acid, staining with alkali and household washing, respectively. According to the standard, fibers can be cut into any convenient size, so each fiber sample was cut into equal parts, each having a weight of 0.1 g.
The color difference was evaluated using digital images,37 which consisted of taking photos of the dyed fibers under the same light conditions, selecting an area of the capture, averaging the color and calculating the color difference (∆E) of the samples subjected to color fastness tests with the original samples and using Table 2 to determine the degree of fastness. The parameters that were used for the camera were illumination: 600 lux, camera distance: 20 cm, ISO:800, aperture: F8, exposure: +2, and shutter: 1/200.
Results and Discussion
Validation of the spectrophotometric method
The standard solutions were prepared on three different days, and the measurement results are shown in Table 3.
Absorbance measurements to evaluate method linearity of the Synozol Red K3BS and Novacron Navy FN-BN dyes method
The average calibration curves for each dye, presented in Figure 2, were constructed with scatter plots whose X axis is the average concentration of the standards and the Y axis, representing absorbance.
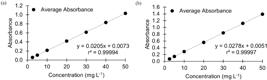
Calibration curve for the determination of Synozol Red K3BS (a) and Novacrom Navy FN-BN (b).
The LODs and LOQs for the dyes were then determined. In the case of the Synozol Red K3BS dye, the LOD was 0.19 mg L-1 and the LOQ was 0.32 mg L-1, for the Novacron Navy FN-BN, the LOD was 0.11 mg L-1 and the LOQ was 0.21 mg L-1.
Dyeing process
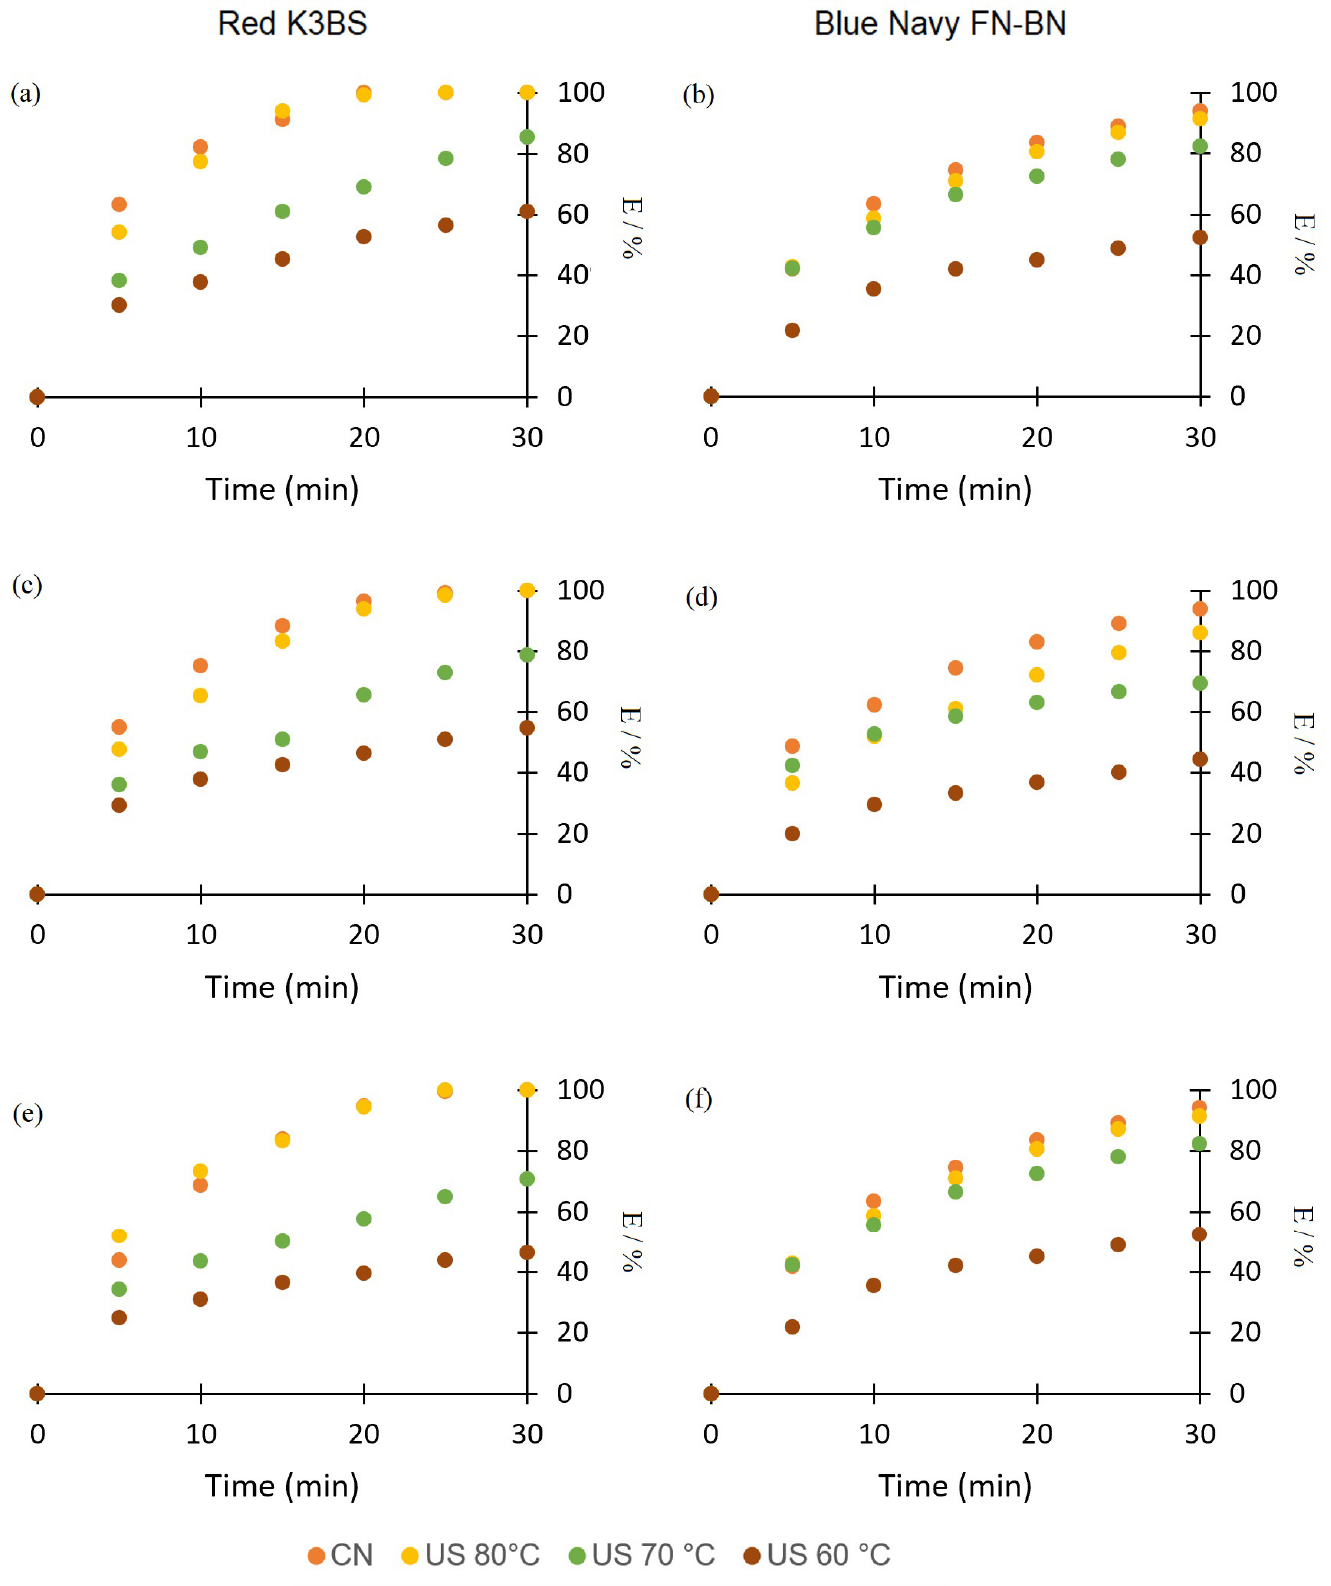
The graphs show the depletion percentage results from the dyeing of Baby, Fleece and Huarizo fibers with Synozol Red K3BS and Novacron Navy FN-BN dyes, applying the conventional process at 92 °C and ultrasound at 60, 70 and 80 °C. In Figure 3, according to the analysis of the factorial design, there are differences in the comparisons between fibers, dyes and the applied methods. When analyzing the effects of the ultrasound process, the general trend of increasing the percentage of depletion as time progressed can be observed, noting that subjectively it can be observed that the fiber and temperature have significant effects. The results of the process are similar to those reported by Udrescu et al.,17 who dyed acetate fibers at 60, 70 and 80 °C by ultrasound and reported a better depletion percentage when working with a temperature of 80 °C. Islam and Ke29 compared ultrasound-assisted and non-ultrasound-assisted staining methods at those same temperatures and also reported better ultrasound staining efficiency at 80 °C.
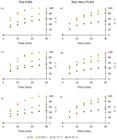
Dye depletion percentages for Baby (a-b), Fleece (c-d), and Huarizo (e-f) alpaca fibers dyed with Synozol Red K3BS and Novacron Navy FN-BN under conventional and ultrasound conditions at various temperatures.
Statistical analysis
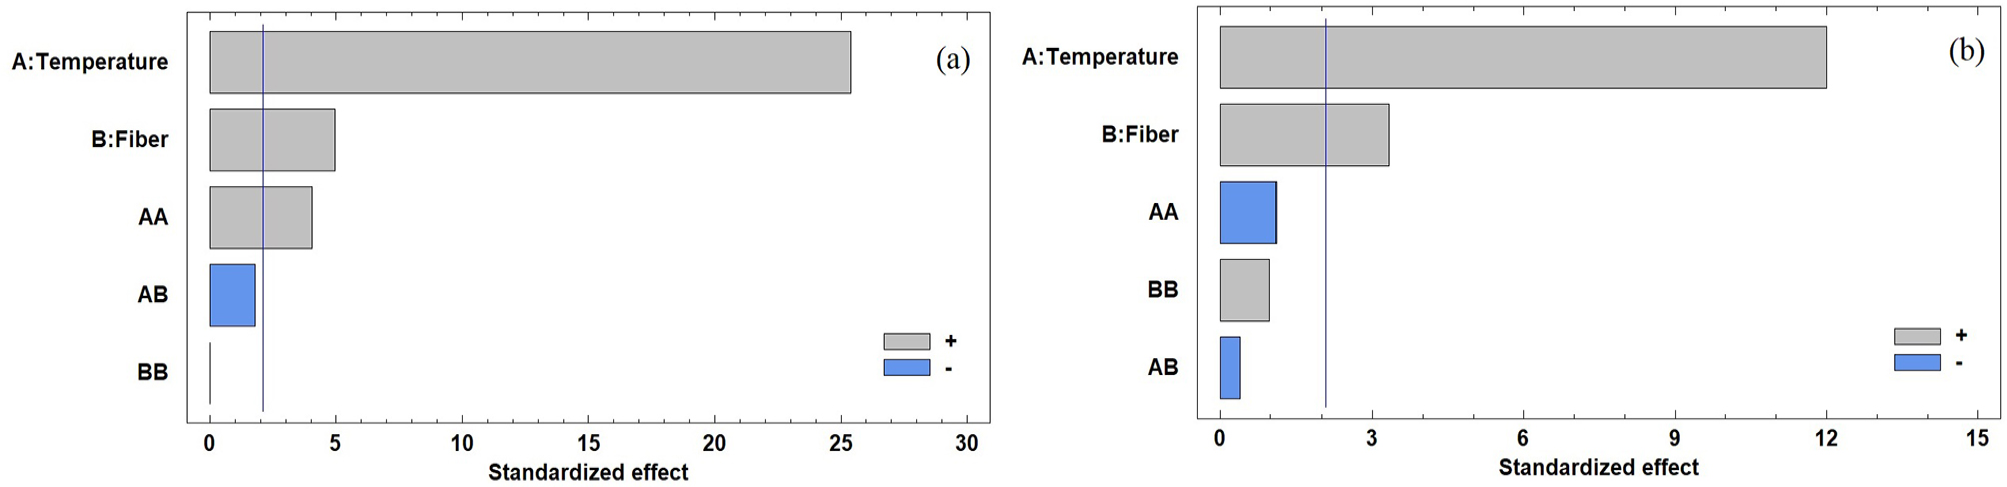
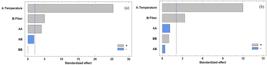
The Pareto chart (Figure 4) shows that temperature, fiber, and the self-interaction of temperature levels have a significant effect on increasing depletion.
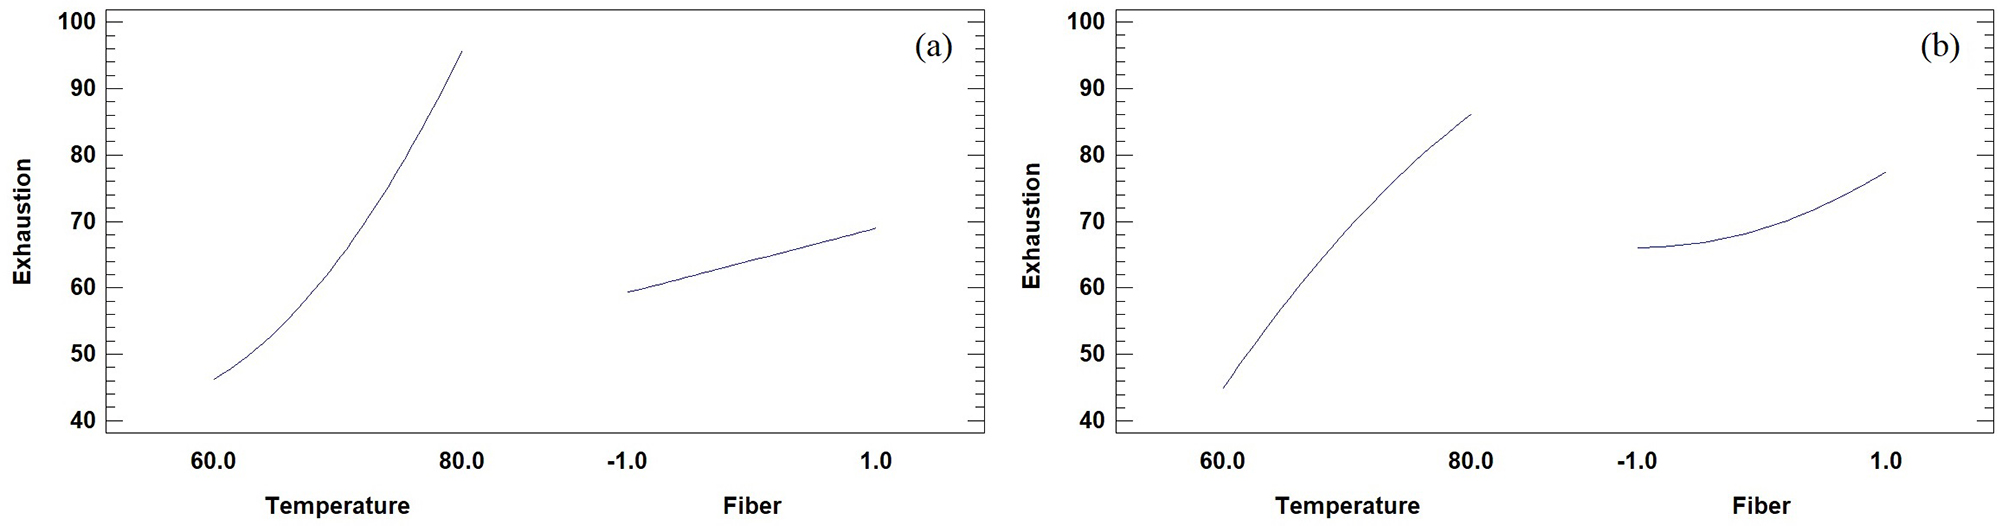
The main effects graph (Figure 5) indicates that temperature is more significant than the increase or difference in fiber fineness.
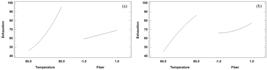
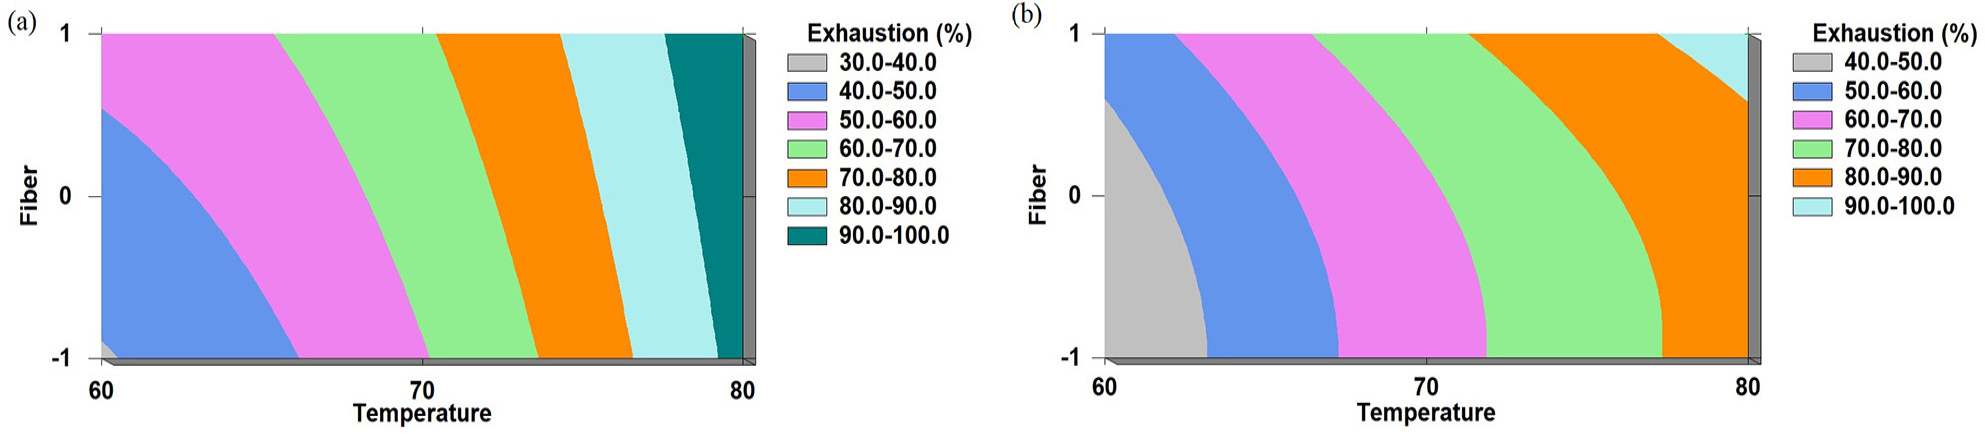
Figure 6 shows the response surface graph obtained in the STATGRAPHICS software38 that represents the mathematical model of the factorial design in which the values of 80 °C for the temperature and quality of Baby fiber are surmised to ascertain the maximum percentage of depletion.
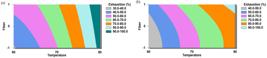
Contour plot of the estimated response surface for the depletion of Synozol Red K3BS (a) and Novacron Navy FN-BN (b).
In order to analyze whether there is a difference between the conventional and ultrasound-assisted methods, the F and t tests were used (Table 4) to evaluate the variance and arithmetic mean between the alpaca fiber dyeing methods. The data from the US process at 80 °C was considered because they were the parameters under which the highest percentage of depletion was obtained. When making the comparison between the ultrasound method and the conventional method in the three different qualities of alpaca fibers, Baby, Fleece and Huarizo, a p-value greater than 0.05 was found in all the statistical tests carried out. This demonstrates that no statistically significant differences in dye concentrations were found between the dyeing methods applied to any of the fiber qualities evaluated.
F-test and t-test at 20 min from the exhaustion of Synozol Red K3BS and at 30 min from Novacron Navy FN-BN
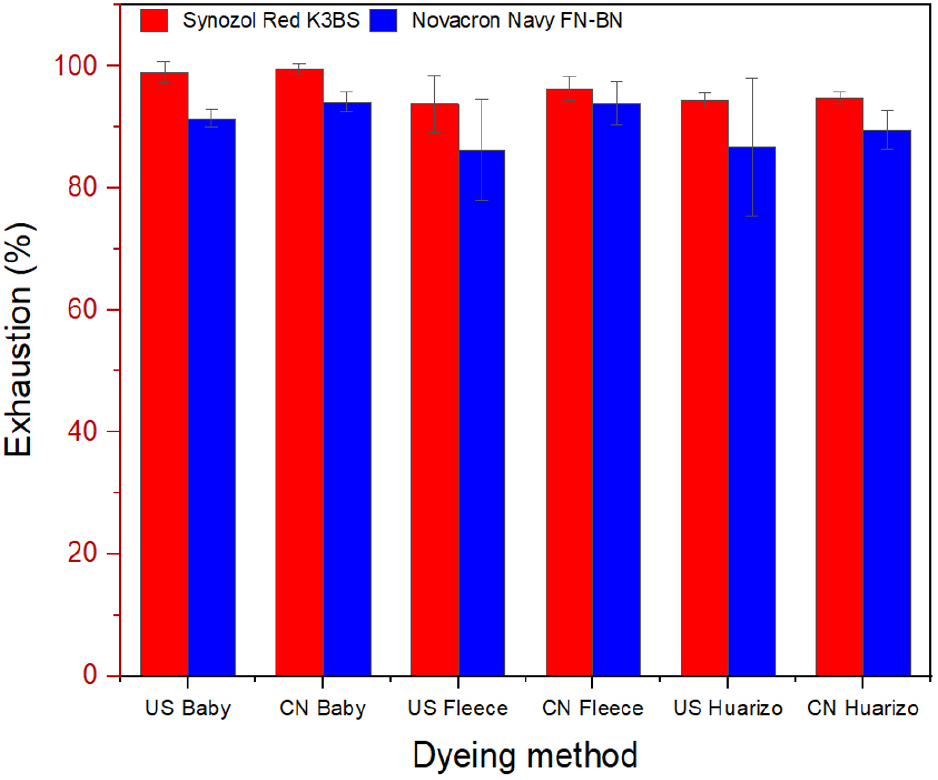
When comparing the two dyes used, it was observed that the Synozol Red K3BS dye showed a greater degree of depletion in all fibers compared to the Novacron Navy FN-BN dye (Figure 7). This suggests that Synozol Red K3BS dye has a greater affinity for alpaca fiber. This tells us, therefore, that temperature is an important factor in the dyeing process and affects the depletion of color in textile fibers. Our findings support this claim and highlight the importance of properly controlling temperature when dyeing alpaca fibers. Although the contribution of fiber quality to the percentage of depletion compared to temperature is relatively minor, fiber quality also had a significant effect. This suggests that, if seeking to optimize the dyeing process in terms of depletion percentage, it is crucial to focus on the selection and control of the fiber as well as the dyeing temperature.
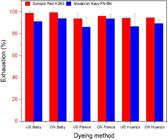
Comparison of the percentage depletion of Synozol Red K3BS and Novacron Navy FN-BN dyes according to the dyeing method (US and CN) in different types of alpaca wool (Baby, Fleece and Huarizo).
Color fastness
When comparing the color fastness results of the conventional process and the ultrasonic dyeing process, we observed that both methods showed overall similar fastnesses (Tables 5 and 6). This indicates that the use of ultrasound as an alternative method for dyeing alpaca fiber does not compromise the color fastness if compared to the conventional process.
Macroscopic evaluation of color fastness in different types of alpaca wool dyed by US and CN methods
Microscopic evaluation of color fastness in different types of alpaca wool dyed by US and CN methods
These results (Table 7) indicate that both the ultrasound method and the conventional method are equally effective in terms of dye depletion in the three different qualities of alpaca fibers evaluated. This may have significant implications regarding the selection of the dyeing method, as both processes can be considered to be viable options for the textile industry working with alpaca fiber.
Conclusions
We were able to validate the analytical method and obtain the calibration curve with the equation of the straight line for the determination of the Synozol Red K3BS dye: y = 0.0205x + 0.0073 with LOD and LOQ of 0.19 and 0.32 mg L-1, respectively, and for the Novacron Navy FN BN dye: y = 0.0278x + 0.0051 with LOD and LOQ of 0.11 and 0.21 mg L-1, respectively. Both dyes showed an r2 value greater than 0.9999, indicating an excellent linear correlation between absorbance and concentration.
The dyed fibers of the three qualities were obtained by the conventional method at 92 °C and ultrasound with temperature values of 60, 70 and 80 °C for a time of 30 min. The experimental design was carried out which allowed us to find the optimal parameters for dyeing with ultrasound, which were: 80 °C temperature and quality of Baby fiber. Likewise, the F-test and t-test was carried out comparing the ultrasound process with the conventional one, which resulted in a p-value greater than 0.05 in all fibers, indicating that there is no significant difference when working with both processes.
Furthermore, it was possible to determine the concentration of both dyes in the different dyeing methods by UV-Vis spectrophotometry, which supports the use of this technique to determine the absorption of color in the fiber. With regard to the depletion of the dyes, there was a difference in both dyeing processes. The Synozol Red K3BS dye reached maximum depletion using a higher concentration of dye in the fibers evaluated, compared to the Novacron Navy FN-BN dye in the optimal conditions, which could be due to a greater affinity of Synozol Red K3BS towards alpaca fibers.
The AATCC method proves to be more accurate in quantification as it allows direct assessment of the dye concentration. However, its main limitation is the specialized instrumentation and its poor representativeness of the visual and functional behavior of the dyeing. The ISO methods used focus on assessing the amount of color released when a textile is exposed to liquid agents.
Finally, the color difference of the fibers was evaluated after subjecting them to various fastness tests. Microscopic analysis showed color disparity in the fibers due to their morphology, so it is not recommendable to evaluate fastness by this means. However, the digital imaging method is applicable to evaluate the color change macroscopically in order to determine the degree of test fastness. In this study, there were no differences in color fastness for the CN and US process at 80 °C, which indicates that US does not impair the fastness of the dyes.
Data Availability Statement
Data will be made available on request.
Acknowledgments
The authors would like to thank the Institute of Renewable Energy of the Technological University of Peru for facilitating the use of the facilities of the Water Quality and Environment Laboratory.
References
-
1 Nunes, L. J. R.; Godina, R.; Matias, J. C. O.; Sustainability 2019, 11, 528. [Crossref]
» Crossref -
2 Sucasaca Quispe, A.; Guevara Garnica, E. D.; Revista de Innovación y Transferencia Productiva 2022, 2, e004. [Crossref]
» Crossref -
3 Adewuyi, Y. G.; Ind. Eng. Chem. Res. 2001, 40, 4681. [Crossref]
» Crossref -
4 Ahmed, N. S. E.; El-Shishtawy, R. M.; J. Mater. Sci. 2010, 45, 1143. [Crossref]
» Crossref -
5 Sun, D.; Guo, Q.; Liu, X.; Ultrasonics 2010, 50, 441. [Crossref]
» Crossref -
6 Wolloch, L.; Kost, J.; J. Controlled Release 2010, 148, 204. [Crossref]
» Crossref -
7 Ahmed, N. S. E.; El-Shishtawy, R. M.; Kamel, M. M.; Pigm. Resin Technol. 2007, 36, 363. [Crossref]
» Crossref -
8 Abadi, S. B. G.; Yazdanshenas, M. E.; Khajavi, R.; Rashidi, A.; Varsei, M.; J. Text. Inst. 2021, 112, 1367. [Crossref]
» Crossref -
9 Babar, A. A.; Bughio, N.; Peerzada, M. H.; Naveed, T.; Dayo, A. Q.; Ultrason. Sonochem. 2019, 58, 104611. [Crossref]
» Crossref -
10 Hassan, M. M.; Saifullah, K.; Ultrason. Sonochem. 2018, 40, 488. [Crossref]
» Crossref -
11 Kamel, M. M.; Helmy, H. M.; Mashaly, H. M.; Kafafy, H. H.; Ultrason. Sonochem. 2010, 17, 92. [Crossref]
» Crossref -
12 Kamel, M. M.; El-Shishtawy, R. M.; Yussef, B. M.; Mashaly, H.; Dyes Pigm. 2005, 65, 103. [Crossref]
» Crossref -
13 Kamel, M. M.; El-Shishtawy, R. M.; Hanna, H. L.; Ahmed, N. S. E.; Polym. Int. 2003, 52, 373. [Crossref]
» Crossref -
14 Khatri, M.; Hussain, N.; El-Ghazali, S.; Yamamoto, T.; Kobayashi, S.; Khatri, Z.; Ahmed, F.; Kim, I. S.; Appl. Nanosci. 2020, 10, 917. [Crossref]
» Crossref -
15 Khatri, Z.; Memon, M. H.; Khatri, A.; Tanwari, A.; Ultrason. Sonochem. 2011, 18, 1301. [Crossref]
» Crossref -
16 Larik, S. A.; Khatri, A.; Ali, S.; Kim, S. H.; Ultrason. Sonochem. 2015, 24, 178. [Crossref]
» Crossref -
17 Udrescu, C.; Ferrero, F.; Periolatto, M.; Ultrason. Sonochem. 2014, 21, 1477. [Crossref]
» Crossref -
18 Gonzalez, V.; Wood, R.; Lee, J.; Taylor, S.; Bussemaker, M. J.; Ultrason. Sonochem. 2019, 52, 294. [Crossref]
» Crossref -
19 Altaş, S.; Pamuk, G.; AATCC Rev 2007, 7, 29. [Link] accessed in June 2025
» Link -
20 Cairós, C.; González-Sálamo, J.; Hernández-Borges, J.; J. Chromatogr. A 2020, 1614, 460511. [Crossref]
» Crossref -
21 Perincek, S.; Bahtiyari, M. Ä.; Körlü, A. E.; Duran, K.; J. Appl. Polym. Sci. 2011, 120, 3119. [Crossref]
» Crossref -
22 Atav, R.; Türkmen, F.; Text. Res. J. 2015, 85, 1331. [Crossref]
» Crossref -
23 Atav, R.; Yurdakul, A.; Ind. Text. 2011, 62, 214. [Link] accessed in June 2025
» Link -
24 Li, Q.; Li, L.; Shao, J.; J. Eng. Fiber Fabr. 2012, 7, 58. [Crossref]
» Crossref -
25 Quispe Peña, E.; Poma Gutiérrez, A.; Purroy Unanua, A.; Revista Complutense de Ciencias Veterinarias 2013, 7, 1. [Crossref]
» Crossref -
26 Babar, A. A.; Peerzada, M. H.; Jhatial, A. K.; Bughio, N.; Ultrason. Sonochem. 2017, 34, 993. [Crossref]
» Crossref -
27 Shahi, Z.; Khajeh Mehrizi, M.; Mehrizi, M. K.; Firoozabad, M.; Progress in Colors, Colorants and Coatings 2024, 18, 99. [Crossref]
» Crossref -
28 Ortiz-Romero, D.; Ramírez-Revilla, S.; J. Chil. Chem. Soc. 2018, 63, 4261. [Crossref]
» Crossref -
29 Islam, G. M. N.; Ke, G.; Fibers Polym. 2020, 21, 1071. [Crossref]
» Crossref - 30 ISO 105-E01: Textiles - Tests for Colour Fastness - Part E01: Colour Fastness to Water; International Organization for Standardization: Geneve, 2013.
- 31 ISO 105-E02: Textiles - Tests for Colour Fastness - Part E02: Colour Fastness to Sea Water; International Organization for Standardization: Geneve, 2013.
- 32 ISO 105-E08: Textiles - Tests for Colour Fastness - Part E08: Colour Fastness to Hot Water; International Organization for Standardization: Geneve, 1994.
- 33 ISO 105-C10: Textiles - Tests for Colour Fastness - Part C10: Colour Fastness to Washing with Soap or Soap and Soda; International Organization for Standardization: Geneve, 2006.
- 34 ISO 105-E05: Textiles - Tests for Colour Fastness - Part E05: Colour Fastness to Spotting: Acid; International Organization for Standardization: Geneve, 2010.
- 35 ISO 105-E06: Textiles - Tests for Colour Fastness - Part E06: Colour Fastness to Spotting: Alkali; International Organization for Standardization: Geneve, 2006.
- 36 AATCC 61: Standard Test Method: Colorfastness to Laundering: Accelerated: American Association of Textile Chemists and Colorists, 2010.
-
37 Luo, M. R.; Cui, G.; Rigg, B.; Dakin, J.; Conference on Colour in Graphics, Imaging, and Vision 2004, 2, 479. [Crossref]
» Crossref - 38 STATGRAPHICS, version 18; StatPoint Technologies, Inc., Warrenton, Virginia, USA, 2017.
Edited by
-
Editor handled this article:
Josué Carinhanha Caldas Santos (Associate)