
 Performance Evaluation of an Aluminum-Acetone Heat Pipe Onboard the Amazonia-1 Satellite
ABSTRACT
The Heat Pipes and TUCA Experiment (an acronym for tubo de calor, which means heat pipe in Portuguese) project, conducted by the National Institute for Space Research, focuses on developing and qualifying a fully Brazilian low-pressure heat pipe technology for satellite thermal control. This initiative builds on research begun in 2003, when INPE demonstrated the feasibility of acetone-based heat pipes as an alternative to ammonia systems supplied internationally. The use of acetone in aluminum heat pipes offers key advantages, including lower toxicity and reduced operating pressure. To support data interpretation, a ground-based replica of the TUCA experiment, named RTUCA, was manufactured and tested before launch. The main objective of this work is to investigate whether non-condensable gases (NCGs) have formed inside the aluminum-acetone heat pipe of the TUCA experiment aboard the Amazonia-1 satellite. This assessment considers the effects of long-term exposure to cosmic radiation since the satellite’s launch on February 28, 2021, while the system remains operational in orbit. Additionally, the study compares the thermal behavior of the heat pipe under microgravity conditions with pre-launch ground tests and with results from the RTUCA setup, which intentionally contains a small amount of NCG. These comparisons contribute to a better understanding of heat pipe performance in the potential presence of non-condensable gases.
Keywords
Heat pipes; Non-condensable gases; Performance limits; Experimental investigation; Space environment; Space telemetry
INTRODUCTION
Heat pipes are highly efficient thermal heat transfer devices, playing a crucial role in various applications, particularly in the space sector, where thermal efficiency and low weight are essential. Their passive operation, requiring no electrical power, makes them ideal for thermal control, ensuring temperature stabilization in satellite structures under vacuum and microgravity conditions. The ability of heat pipes to transfer large amounts of heat while maintaining low temperature gradients is a key factor driving their use in space missions (Brennan and Kroliczek 1979; Peterson 1994).
The operating principle of a heat pipe involves the following main zones: evaporation, adiabatic (optional), and condensation. In the evaporation zone, the working fluid absorbs heat and evaporates; the vapor moves to the condensation zone, where it releases latent heat and returns to the liquid state. The liquid then travels back to the evaporation zone through a wick structure by capillary action, ensuring a continuous thermal transfer cycle. This mechanism stabilizes the temperature along the heat pipe and the equipment coupled to it.
However, the presence of non-condensable gases (NCGs) can degrade heat pipe performance over time. These gases may result from chemical reactions between the working fluid and the pipe material, manufacturing processes (Marcus 1972), cosmic radiation, and partial fluid decomposition. Identifying NCG is crucial to extending the heat pipe’s lifespan, especially in space environments, where maintenance is not feasible. The NCG detection methods include analyzing thermal behavior under steady-state and transient conditions.
The presence of NCG negatively impacts heat pipe efficiency, causing distortions in temperature profiles and reducing overall performance (Reay and Johnson 1976). Figure 1 illustrates how NCG accumulation obstructs the heat pipe, reducing the condenser’s effective length and significantly increasing the temperature gradient. In Enke et al. (2021), a detailed analysis of the transient response of aluminum heat pipes with ammonia and the presence of NCG was conducted. The authors developed a mathematical model to simulate heat pipe performance with and without NCG, validating their findings through experiments with two identical heat pipes. The results indicated that the NCG detection method based on temperature change rate was more sensitive than traditional steady-state temperature profile analysis.

In the study conducted by Hsieh et al. (2014), an experimental investigation was carried out to assess the chemical compatibility between acetone and aluminum alloy 6061 in flat heat pipes. A 2,000-hour life test at 80 °C revealed the generation of NCGs, with a significant reduction in their formation rate, by approximately a factor of 10, after 1,500 hours of operation. This decline was attributed to the gradual formation of a bayerite (Al(OH)₃) layer on the internal surfaces of the heat pipe, which acted as a protective barrier against further chemical reactions between the aluminum and trace amounts of water in the working fluid. However, the study omitted several critical technological details that could considerably influence NCG generation. These include the purity level of the acetone, cleaning procedures of the heat pipe before charging, the type and specifics of the sealing process (welding or brazing), and the rationale for the intentional deposition of copper on specific internal surfaces of the device. Such omissions limit the reproducibility and general applicability of the reported findings.
In contrast, Kopiatkevich et al. (2014) evaluated the long-term thermal performance of sixteen ammonia-filled aluminum heat pipes installed in the radiator system of the International Space Station’s Service Module after 14 years of continuous orbital operation. The primary objective was to investigate the potential generation of NCGs resulting from the radiolysis of ammonia under prolonged exposure to space radiation. The authors analyzed steady-state orbital temperature telemetry and compared it with baseline data obtained from ground-based thermal-vacuum tests. Within the accuracy limits of the employed method, no evidence of NCG formation was found. Furthermore, the study reported a notable improvement in the thermal resistance of the heat pipes under microgravity conditions, suggesting that space environments may actually enhance their thermal performance compared to terrestrial conditions.
In the Brazilian context, the development of national space technologies is a strategic priority aimed at reducing dependency on imported components and strengthening technological autonomy. The corresponding research programs for the development of heat pipes for space applications were first established at the Universidade Federal de Santa Catarina (UFSC), in Florianópolis, and later expanded through activities conducted at the Department of Aerospace Science and Technology (Departamento de Ciência e Tecnologia Aeroespacial [DCTA]), including the Institute for Advanced Studies (Instituto de Estudos Avançados [IEAv]) and the Aeronautics Institute of Technology (Instituto Tecnológico de Aeronáutica [ITA]), in São José dos Campos. UFSC has developed a strong research tradition in heat pipe technology, with studies covering mathematical modeling of heat transfer processes and the development of mini copper-water heat pipes. The operational performance of these devices was successfully verified under microgravity conditions during suborbital flights and on the orbital station during the Centennial Mission (Paiva et al. 2015). In addition, extensive research has been conducted on capillary pumped loops (CPL) and loop heat pipes (LHPs), mainly for terrestrial applications, as well as on porous structure manufacturing technologies. The operation of an aluminum–water CPL without a porous structure was also successfully demonstrated in microgravity during the centennial mission.
As part of the China-Brazil Earth Resources Satellite (CBERS) program, researchers at the National Institute for Space Research (Instituto Nacional de Pesquisas Espaciais [INPE]) have been developing domestically manufactured aluminum-acetone heat pipes as alternatives to aluminum-ammonia ones supplied by CAST. This development program has reached a high level of maturity in space qualification of developed technology, with issues of detailed drawings, progress, test reports, and configured technical documentation.
Prior international research (Reay and Johnson 1976) had already explored aluminum–acetone heat pipes, identifying the formation of diacetone alcohol under elevated temperatures of about +90 °C. Acetone-aluminum mini heat pipes are commercially available for applications in electronic cooling with an operational limit of +85 °C. No orbital flight long-term data for aluminum-acetone HP has been published to the present.
The TUCA experiment, however, marks the first in-orbit qualification of a fully Brazilian heat pipe using aluminum and acetone. This represents a significant milestone in the country’s capability to develop advanced thermal control systems. Its operation in space enables long-term monitoring of thermal behavior by permanent telemetry streaming of TUCA temperatures and allows direct investigation of performance under microgravity and cosmic radiation conditions that cannot be fully replicated on Earth.
From its conception in 2014 to its integration into the satellite in 2019 and launch in 2021 aboard the Amazonia-1 (AMZ1), TUCA has demonstrated stable operation both on the ground and in orbit, confirming acetone as a viable alternative to ammonia due to its lower toxicity and operating pressure (Bertoldo et al. 2014).
The objective of this work is to investigate the possible formation or not of NCGs in the aluminum-acetone heat pipe of the TUCA experiment throughout its multi-year orbital operation aboard the AMZ1 satellite, which was launched in 2021 and is still operational in orbit. The orbital telemetry data were analyzed for the orbital period of almost 4 years. Two different methods were used to try to detect any trace of NCG formation along the mission. In addition, this study compares the thermal behavior of the heat pipe in microgravity (0G) with pre-launch ground test data and with its laboratory replica of the TUCA experiment, named RTUCA.
METHODOLOGY
Two methods of NCG detection
There are two known methods of NCG detection in heat pipes by indirect measurements: the steady-state method, which identifies NCG through temperature profile analysis under constant operating conditions, and the transient method, which detects NCG by evaluating the heat pipe’s dynamic thermal response during heating and cooling phases.
The steady-state method is widely used to identify the presence of NCG in heat pipes by analyzing the temperature profile along their length after extended operation during life tests (Anderson et al. 2013; Lobanov 1991). A temperature decrease at the end of the condenser can indicate the presence of gas and may help identify the diffuse front between gas and vapor (Marcus 1972). Figure 2 illustrates the method, highlighting the temperature drop at the end of the condenser caused by its partial blockage by NCG in the vapor core.

Illustration of the steady-state method: typical temperature profile of HP without NCG (left) and with NCG (right).
However, Fig. 2 is largely didactic; in practice, the effects of NCG can be more challenging to detect and interpret. First, temperature drops at the end of the condenser may occur even in the absence of NCG due to extra cooling from the end cap, particularly when the condenser is located on the same side as the filling tube, a phenomenon known as the “end effect.” Second, the high thermal conductivity of the pipe wall can significantly smooth the temperature profile, making it difficult to precisely identify the vapor-gas front, if present. Third, the formation of a liquid meniscus at the end of the condenser can occur in microgravity or horizontal orientations, especially in small-diameter heat pipes, partially blocking the condenser and mimicking the presence of NCG. Fourth, the magnitude of the temperature drop may be very small when the condenser is well thermally coupled to the heat sink (i.e., has a high heat transfer coefficient), potentially falling within the uncertainty of temperature sensors. Fifth, the diffusion front may extend over a significant portion of the heat pipe length, particularly in short heat pipes. Finally, as a hypothesis, for low-pressure fluids with a large amount of introduced NCG, an anomalous mode of heat pipe operation may occur when the vapor pressure remains lower than the NCG pressure along the entire pipe. In this scenario, the heat pipe operates under low heat load with degraded performance, and vapor flow is slow because the primary driving force is the vapor concentration gradient; no distinct gas-vapor front can be defined.
Therefore, careful interpretation of thermal variations is crucial to avoid misleading conclusions.
The second method of NCG detection is a recently developed transient one. The basic idea of this method is based on small distortions in the temperature rise curve during startup (Saad et al. 2012; Smirnov et al. 2009). Anomalies in temperature behavior during start-up have also been observed in other two-phase heat transfer devices with NCG: thermosyphons (Mantelli et al. 2010) and loop heat pipes (He et al. 2013). Recently, a more advanced version of this method was developed. It analyzes the thermal behavior of the heat pipe during initial heating and cooling phases (startup and shutdown) by evaluating the rates of temperature change (Bertoldo 2017; Enke 2020). Initially, the time delay between the temperature rate peaks in the evaporator and condenser is examined. Subsequently, possible distortions in the condenser’s rates are analyzed, as their values depend on the concentration of NCG (Enke 2025). The presence of this gas increases the system’s response time and causes variations in the response thermal rates of the condenser, enabling its identification. Figure 3 illustrates the transient method, showing the delay between the temperature rate peaks in the evaporator and condenser, as well as distortions in the condenser’s rates caused by the presence of NCG.

On the left, the delay in rates between the evaporator and condenser (Enke 2020). On the right, rate distortions in the condenser due to the presence of NCG.
TUCA and RTUCA description
TUCA is a technological experiment developed to assess the possible performance drift of an acetone-aluminum heat pipe operating under orbital conditions for a long period. The primary objective of the experiment is to qualify the domestically developed manufacturing technology of this type of heat pipe for space applications. All associated processes and procedures were developed, tested, and documented at INPE, ensuring the repeatability and reliability of the production methodology.
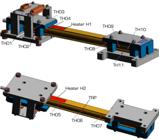
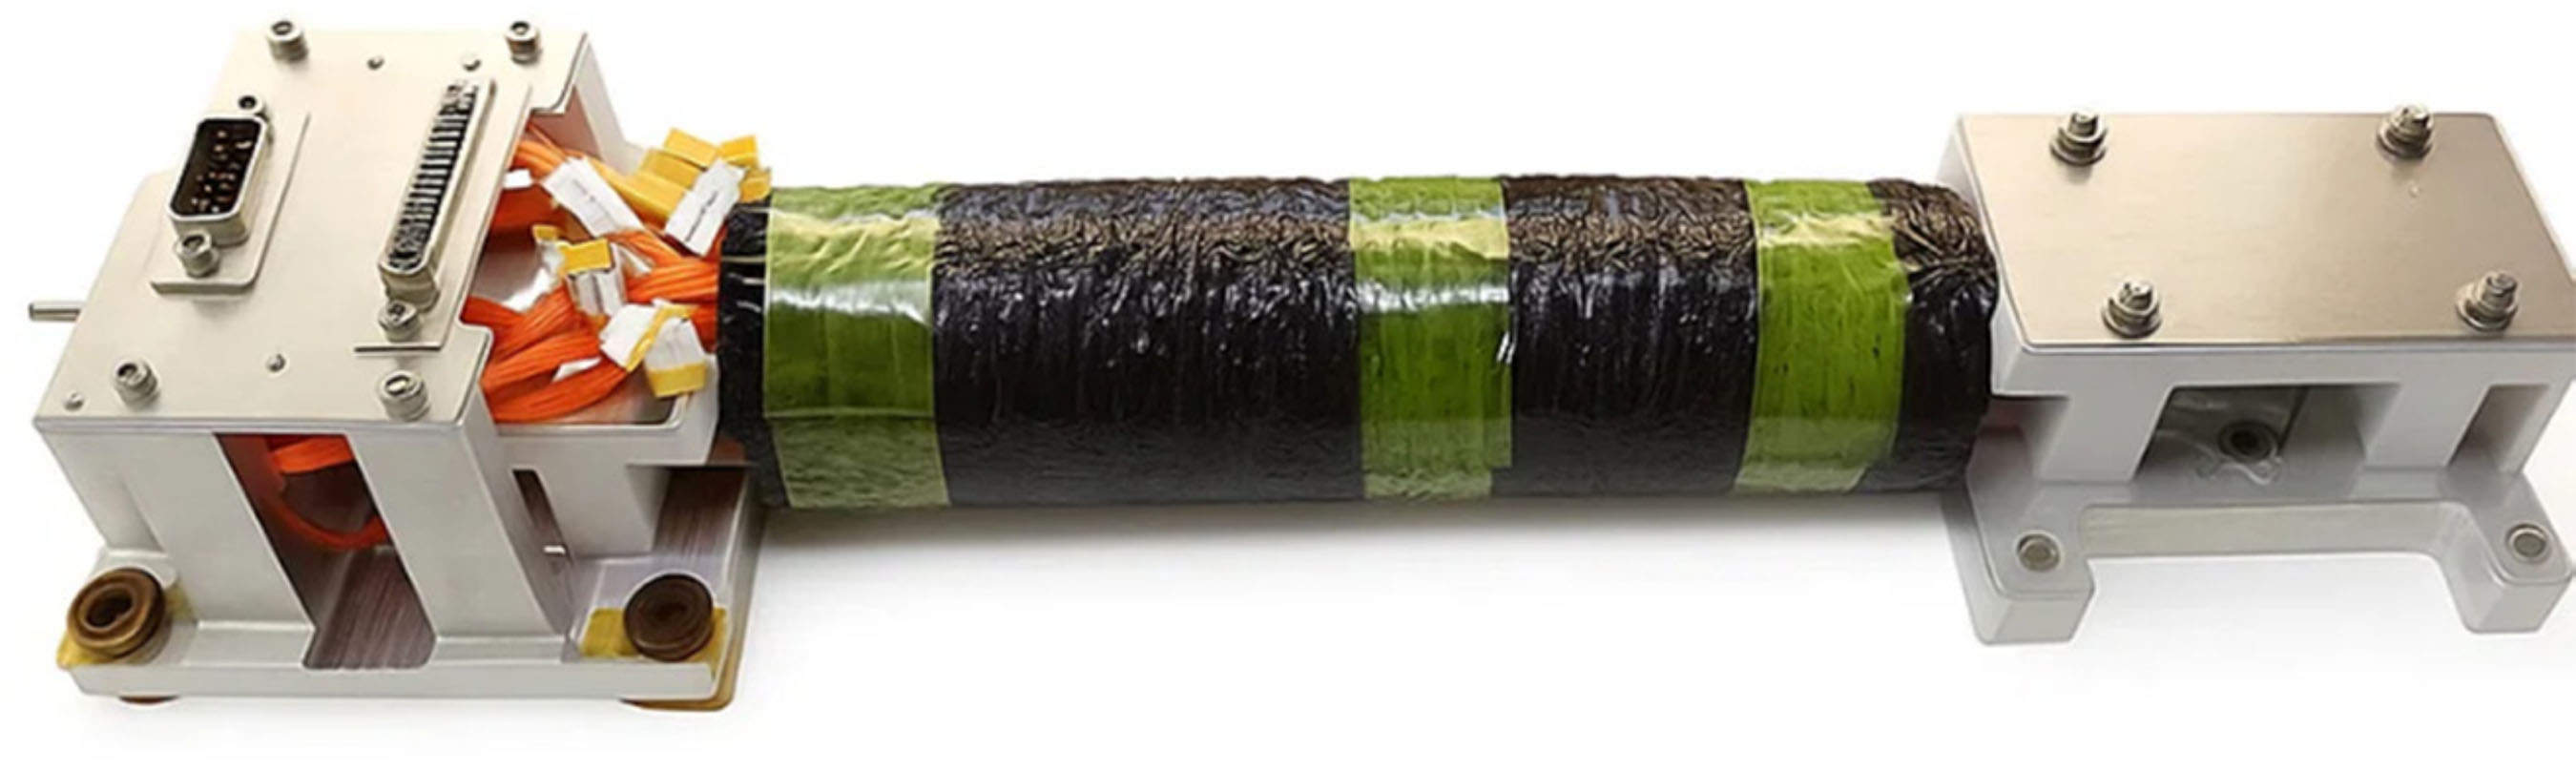
The TUCA experimental assembly consists of a heat pipe, thermo-mechanical interfaces (referred to as “saddles”), and a thermal insulation system based on multi-layer insulation (MLI) blankets. The heat pipe is charged with 12.16 grams of acetone, and the total mass of the integrated system is 1,456 grams. Figure 4 shows the assembled TUCA experiment without MLI and wiring.
TUCA has the following characteristics. To mount the experiment onto the satellite, various materials qualified for vacuum and space applications due to their low outgassing characteristics were employed:
Clamps, fabricated from Teflon, ensure secure fixation with high thermal and chemical resistance.
Mechanical interfaces and support structures, machined from aluminum alloy 6063, were selected for their favorable strength-to-weight ratio and good machinability.
Thermal insulation bushings and inserts, made of FR4 fiberglass and Torlon, provide efficient thermal isolation and protect components from extreme temperature variations.
Fasteners, constructed from stainless steel, ensure mechanical integrity during launch and orbital operation.
Vacuum thermal insulation, implemented using MLI blankets composed of alternating layers of aluminized Mylar and woven Nylon mesh, effectively reduces radiative heat transfer in the space environment.
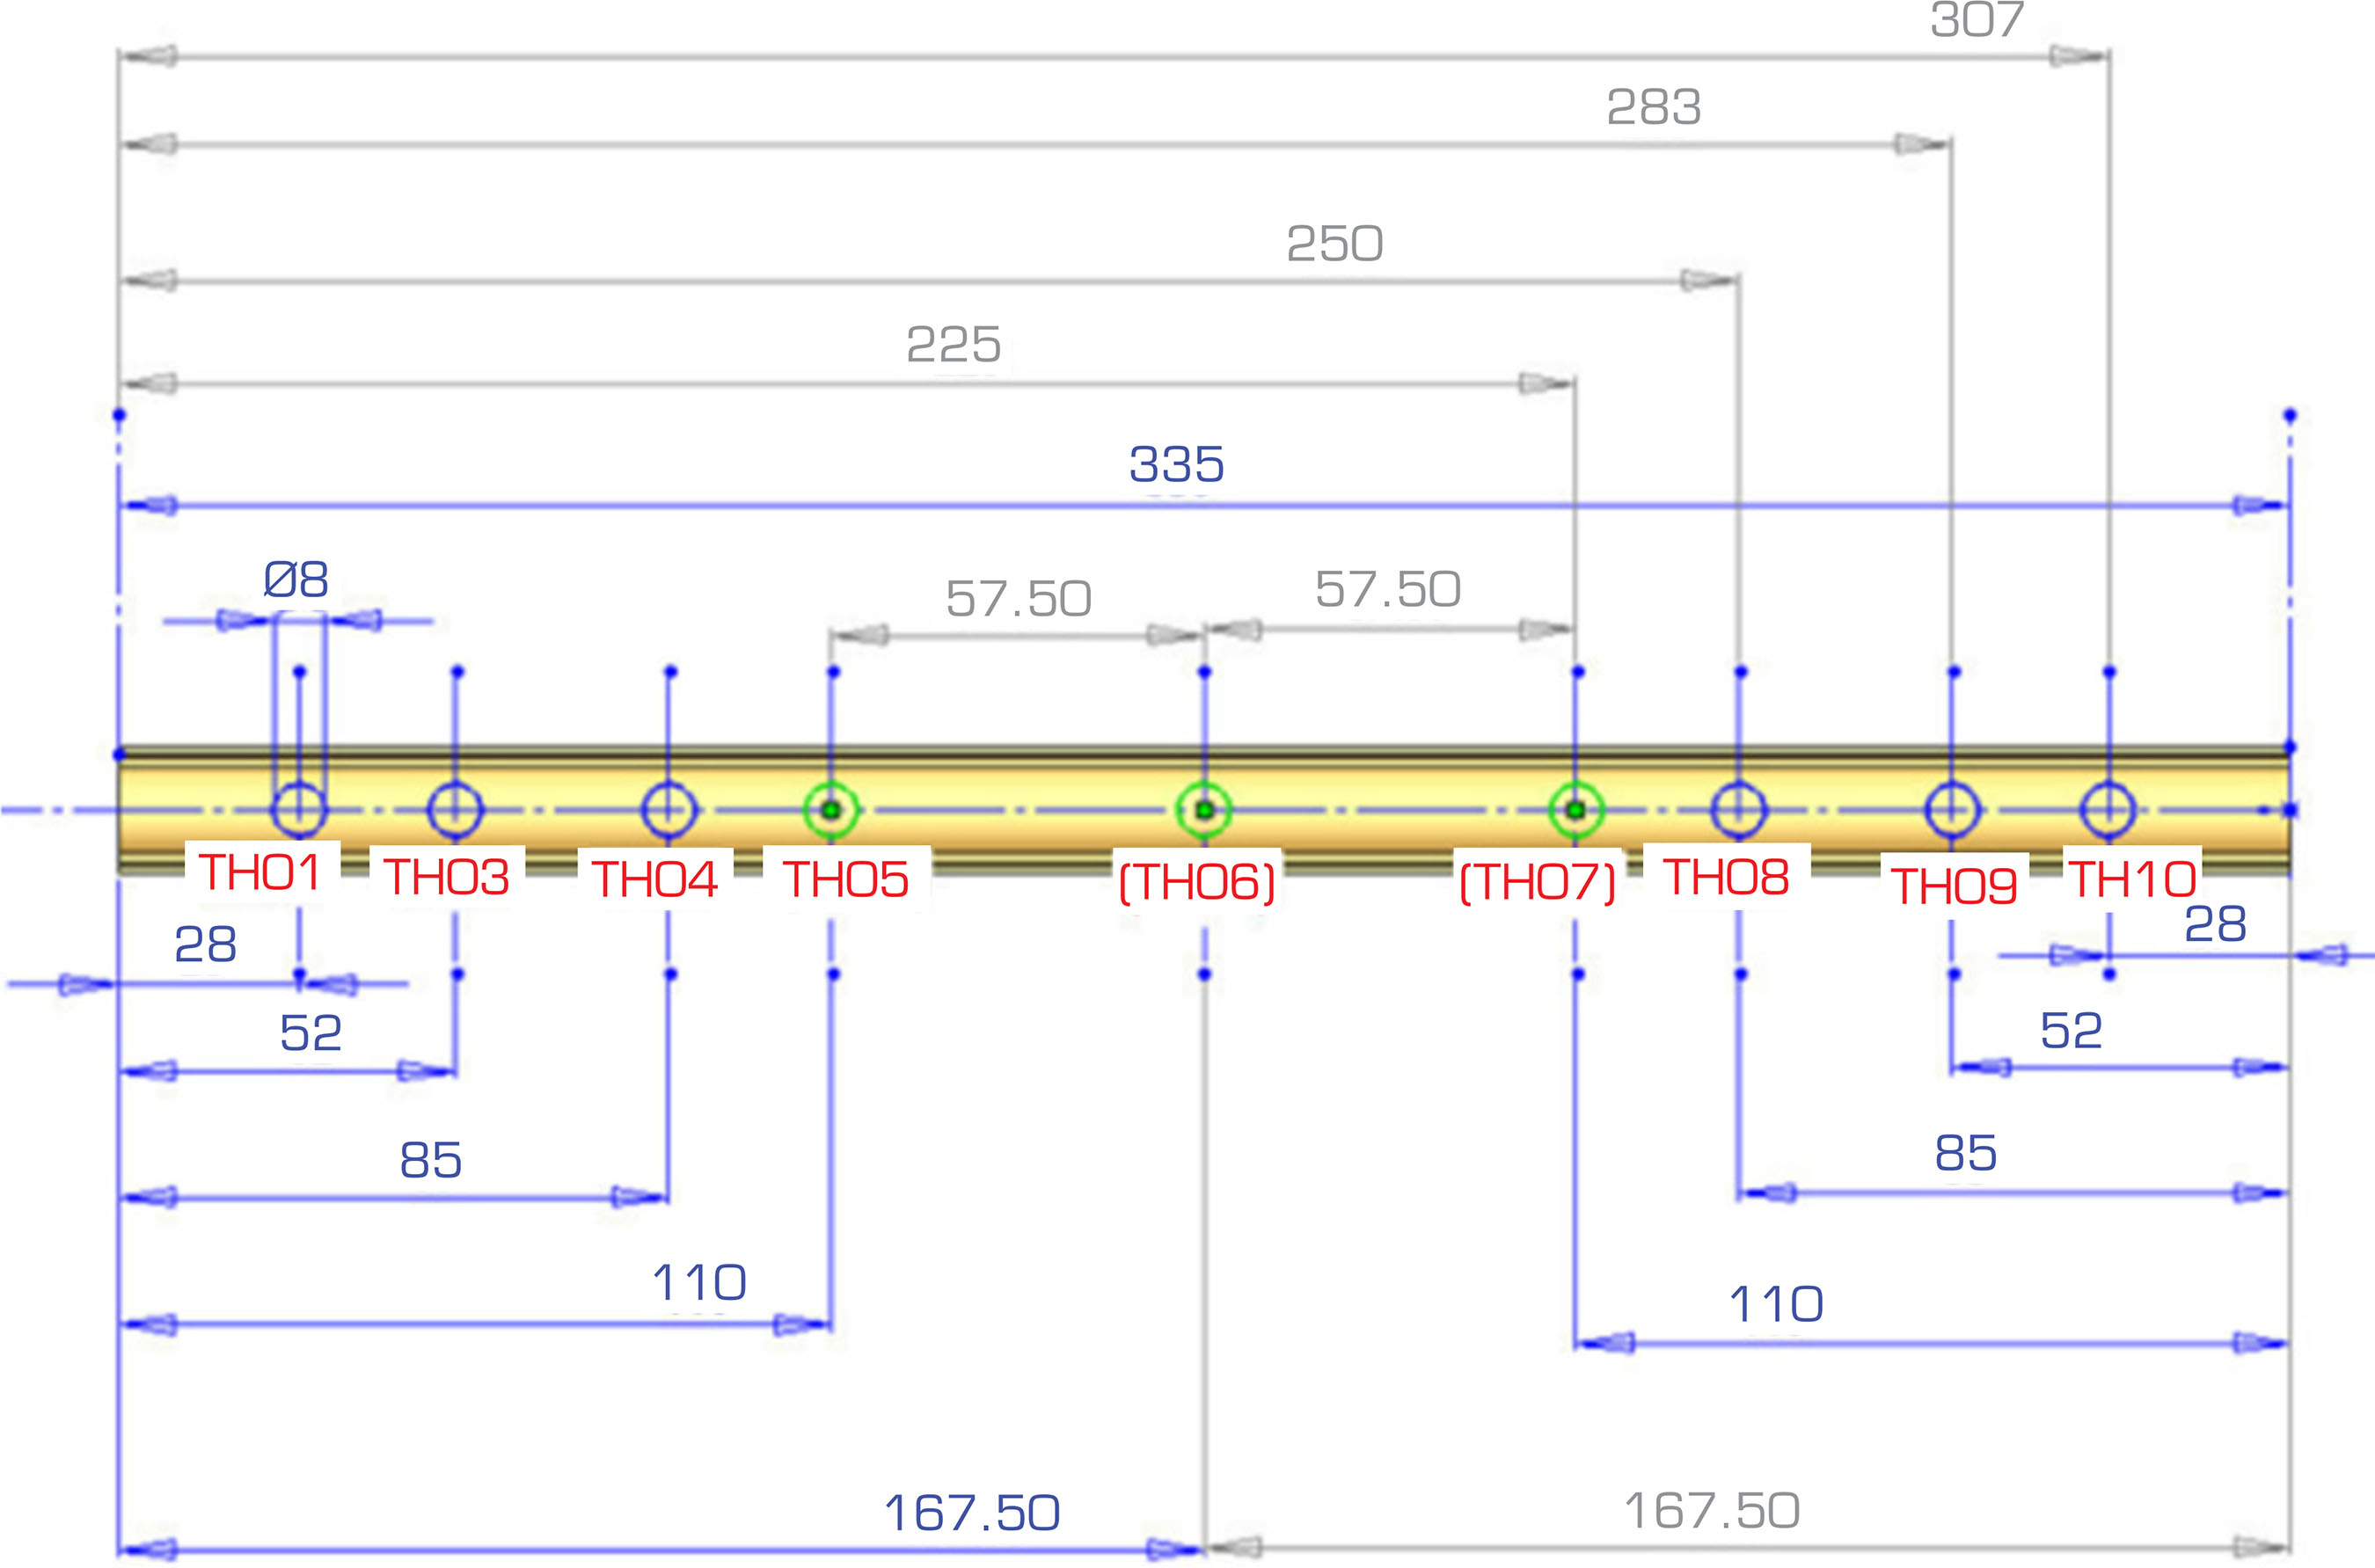
The heat pipe is instrumented with eleven space-qualified thermistors, each with a nominal resistance of 10 kΩ. Nine thermistors are mounted along the heat pipe: three in the evaporator section (TH01, TH03, TH04, TH05), two in the adiabatic section (TH06 and TH07), and three in the condenser section (TH08, TH09, and TH010). The remaining two thermistors (TH02 and TH011) are installed on the structural support saddles to monitor interface temperatures. All thermistors were bonded to the heat pipe body and saddles using a space-qualified epoxy adhesive, ensuring strong mechanical fixation and effective thermal coupling between the sensors and the surfaces being monitored.
Heating is provided by two skin heaters, each measuring 12.7 mm × 129.5 mm, connected in series to yield a total resistance of 112.5 ohms. The system includes both a primary and a redundant heater to ensure reliable thermal control throughout the mission.
Figure 5 illustrates the thermistors’ positioning dimensions, TUCA and RTUCA.

The TUCA heat pipe profile was manufactured via extrusion by the Brazilian company Prolind Industrial Ltda, using aluminum alloy 6063. Its capillary structure consists of 22 longitudinal rectangular micro-grooves, which facilitate internal liquid return through capillary action. The main geometric characteristics of the heat pipe are listed in Table 1. For better understanding, the parameters Le, La, Lc, OD, ID, and VD presented in Table 1 are illustrated in Fig. 1, while the parameters Wf, w, δp, δc, and δw are depicted in Fig. 6. On the right side of Fig. 6, the cross-sectional view of the heat pipe and its internal grooves is shown, while the left side illustrates the detailed geometric parameters of the capillary structure.

On the left: cross-sectional view of the extruded heat pipe profile showing the internal axial grooves. On the right: internal geometric characteristics of the heat pipe.
The RTUCA was also built for ground-based testing to aid in the interpretation of orbital data. The replica was specifically designed to reproduce the thermal conditions encountered in space, but it also contains a small uncontrolled amount of air to simulate the degradation of the heat pipe’s performance in case NCG is generated in TUCA. It retains the same physical characteristics and the thermistor temperature sensor configuration as the flight model (FM), ensuring consistency and reliability in comparative tests.
The materials selected for the replica closely follow the specifications of the flight hardware. However, due to the controlled nature of laboratory conditions, commercially available equivalents were used for certain components, such as thermistors, electrical connectors, and thermal insulation, as they do not alter thermal characteristics.
Maintaining the correct orientation of the heat pipe during testing was critical. Even slight inclinations can introduce two detrimental effects: the pooling phenomenon and dry-out. Pooling refers to the accumulation of working fluid in a specific region of the pipe due to gravity, which disrupts circulation and reduces thermal efficiency. Dry-out, on the other hand, occurs when the fluid depletes from the evaporator section, typically the heating zone, interrupting the heat transfer cycle. This condition may arise from excessive heat input or unfavorable inclination angles that cause fluid migration toward the condenser. Both effects significantly impair heat pipe functionality and can lead to failure in thermal regulation systems (Rosa and Vlassov 2023).
To eliminate such issues and ensure proper test conditions, a custom tilt-support structure was designed to hold the replica TUCA (RTUCA) in a perfectly horizontal position (0° inclination). This precaution was essential to ensure that gravity-related disturbances did not affect heat transfer behavior, thus enabling a valid comparison with the space-based operation. The support system was developed in collaboration with the Space Mechanics Division (Divisão de Mecânica Espacial e Controle [DIMEC]) and INPE’s mechanical workshop team. Figure 7 shows the fully assembled laboratory test setup, fully instrumented and equipped with MLI-1. Figure 8 shows the experiment installed on the heat dissipation plate and coupled with MLI-2.


The heat flow within the heat pipe is illustrated in Fig. 9 and proceeds as follows: heat is supplied by a space-qualified skin heater installed on the pipe’s outer wall. Upon activation, the heated region acts as the evaporator region. The applied thermal energy vaporizes the liquid contained in the wick in this region. The resulting increase in vapor pressure drives the vapor through the pipe’s core toward the cooler section, where the vapor condenses and releases its latent heat of vaporization. As evaporation depletes the liquid in the evaporator, menisci form within the wick structure, generating capillary pressure. This capillary action transports the condensed liquid from the condenser back to the evaporator, thereby sustaining a continuous and passive heat transfer cycle. In the condenser region, the absorbed heat is dissipated either to the satellite’s thermal control panel (in the flight configuration) or to an aluminum plate that serves as a thermal sink (in the RTUCA ground configuration).

TUCA and RTUCA heat pipe operation limits
With the geometric properties defined and the working fluid selected, it is possible to determine the operational limits of the heat pipe. These limits are defined by different physical phenomena that constrain the heat transport capacity, namely: capillary limit, sonic limit, entrainment limit, viscous limit, and boiling limit. Each of these limits will be described in the following.
The viscous limit is reached when viscous forces dominate the vapor flow, which usually occurs when operating conditions approach the freezing temperature of the working fluid. The maximum axial heat flow Qv,max through the vapor core can be determined by the expression (Faghri 1995):
Where Avap is the vapor region area, Dv is the vapor region diameter, λ is the latent heat of vaporization, ρv is the vapor density, pv is the vapor pressure, μv is the vapor dynamic viscosity, and Leff is the effective length of the heat pipe, defined as:
Where Le is the evaporator length, La is the adiabatic zone length (if present), and Lc is the condenser length.
The sonic limitation occurs when a heat pipe operates at low vapor densities and/or high vapor velocities. This phenomenon is particularly problematic in heat pipes using liquid metal as a working fluid, where the vapor can reach supersonic speeds due to typically high heat loads, exceeding the speed of sound for the given temperatures.
Chi (1976) presented an equation for the maximum heat transfer rate at the sonic limit Qs,max:
Where Avap is the vapor region area, ρv is the vapor density, λ is the latent heat of vaporization, γv is the ratio of specific heats of vapor, Rv is the gas constant of vapor, and Tv is the vapor temperature.
The entrainment limit occurs when the vapor flow reaches sufficiently high velocity. Inside a heat pipe, the liquid and vapor flows have opposite directions, so when the vapor velocity is high enough, the shear force can pull small liquid droplets into the vapor flow. This phenomenon prevents the liquid from returning from the condenser to the evaporator, limiting the heat pipe’s transport capability.
The maximum heat transfer rate at the entrainment limit Qe,max is given by (Chi1976):
Where Avap is the vapor region area, λ is the latent heat of vaporization, σ is the surface tension of the fluid, ρv is the vapor density, and rp, is the effective radius of the pore, taken as equal to w, the microchannel width.
The capillary limit is reached when the pumping ability of the wick structure is insufficient to sustain the required liquid flow. If the evaporation rate exceeds the wick’s ability to replenish the liquid, the wick may dry out due to a lack of liquid supply. Additionally, in a gravitational field, the maximum fluid transport capacity varies with pipe orientation: it decreases when the condenser is positioned below the evaporator (unfavorable inclination) and increases when the evaporator is lower than the condenser (favorable inclination) (Enke 2020).
The capillary limitation for heat transport, Qc,max is given by Faghri (1995):
Where Fl and Fv are the friction coefficients for liquid and vapor, respectively, defined as:
In these equations, σ is the surface tension of the fluid, reff is the effective pore radius of the wick structure, ρl is the liquid density, g is the gravitational acceleration, LHP is the total length of the heat pipe, and ϕ is the pipe inclination angle relative to the gravity field. Other parameters include μl (liquid dynamic viscosity), Awick (cross-sectional area of the wick structure), K (wick permeability), λ (latent heat of evaporation), f (drag coefficient for vapor flow), Re (Reynolds number of vapor), μv (vapor dynamic viscosity), Avap (vapor region area), and ρv (vapor density).
The boiling limit differs from other operational constraints as it restricts the radial heat flux within the evaporator rather than the axial heat flux along the heat pipe. When the radial heat flux exceeds a critical value, boiling bubbles can form inside the wick structure, leading to localized overheating (hot spots) and potentially blocking fluid circulation within the wick. This phenomenon can significantly reduce the heat pipe’s performance. The maximum heat transfer rate for the boiling limit, Qb,max, is expressed as (Chi 1976):
where is the length of the evaporator, is the effective thermal conductivity of the wick structure, is the vapor temperature, is the surface tension of the fluid, is the latent heat of evaporation, is the vapor pressure, is the capillary pressure, is the inner radius of the pipe, is the vapor core radius, and is the boiling nucleation radius.
Exceeding this limit can cause phase instability within the wick, disrupting the working fluid circulation and diminishing the overall efficiency of the heat pipe. Proper thermal management is necessary to ensure reliable operation within safe radial heat flux conditions.
For the calculations, the thermophysical properties of acetone at 40 °C were considered. The operational limits of the heat pipe are presented in Table 2.
Therefore, it is demonstrated that the design heat load of 9.5 W does not exceed any operational limit of the TUCA heat pipe. This value was conservatively defined based on safety considerations: in the event of a complete failure of the heat pipe, the heat input should not cause excessive temperature rise in the evaporator region, thereby protecting the integrity of the experiment and surrounding components.
TUCA telemetry data processing
The telemetry data received from TUCA onboard the AMZ1 satellite exhibits resolution limitations due to the analog-to-digital signal conversion process. The temperature monitoring system employs thermistors, and the acquired signals are quantized into 256 discrete levels (8-bit resolution), resulting in an approximate temperature resolution of 0.4 °C. Due to the high rate of temperature acquisition and the relatively slow variation of the signal, this resolution error introduces discontinuities into the recorded data. The result is a signal that resembles a staircase, which can be seen in Fig. 10.

Consequently, direct numerical processing of the temperature data does not allow for accurate calculation of temperature derivatives, which are essential for transient thermal analysis. The raw derivative values tend to alternate between 0 and infinity, preventing meaningful interpretation of temperature change rates. This limitation is illustrated in Fig. 9.
To address this issue, an algorithm was developed to process the telemetry data of TUCA’s temperature sensors. A Visual Basic for Applications (VBA) script was implemented within a Microsoft Excel spreadsheet to filter redundant temperature readings caused by quantization. The algorithm systematically removes consecutive identical values, thereby enabling more accurate thermal analysis.
The code executes a series of macros specifically designed to optimize data interpretation under quantized conditions. Figure 11 presents a block diagram illustrating the processing flow of the algorithm.

Block diagram of the telemetry data processing algorithm developed for TUCA. The process includes acquisition, filtering, temperature rate calculation, graphical visualization, and results analysis.
Using MS Excel, the LINEST function was employed to calculate the coefficients a, b, and c of the polynomial. With the obtained coefficients, the derivative of the polynomial was calculated to determine the temperature variation rates over time. This experimental method provides an effective approach to mitigate the effects of data quantization, enabling more accurate rate analysis.
Several numerical tests were conducted to achieve stable and smooth derivative estimation using this methodology. The best results were obtained with , employing one forward point, one reference point, and two backward points.
RTUCA analysis methodology
Data collection was carried out using data acquisition systems (DAS), which accurately recorded the measurements from the sensors installed in the experiment. Additionally, the software provided by the sensor manufacturer was used for data acquisition and monitoring, ensuring reliability in the records. Temperature variation rates were determined using the traditional method, subtracting the previous temperature from the future temperature and dividing by the corresponding time interval.
Measurement uncertainty in TUCA and RTUCA thermal telemetry
In the TUCA experiment, the uncertainties associated with the temperature telemetry channel are less than ± 0.5 °C. The thermistors employed, qualified for space applications, have an intrinsic measurement error of ± 0.2 °C. However, the method of attachment introduces an additional uncertainty, estimated at ± 0.85 °C based on previous studies, leading to a total combined uncertainty of approximately ± 1.55 °C.
This level of uncertainty is considered negligible for long-term thermal analysis, as it remains consistent throughout the mission lifetime, which is expected to range from 10 to 15 years. Moreover, these uncertainties have a limited impact when analyzing temperature trends or performing relative comparisons over time using the same experimental setup. Since the primary sources of uncertainty, such as sensor accuracy and mounting effects, remain constant across measurements, their influence tends to cancel out when data are compared under equivalent conditions. As a result, the effective uncertainty in detecting thermal variations or performance degradation over the mission duration is significantly lower than the absolute measurement uncertainty.
In the RTUCA configuration, commercial thermistors (NFC MF52, 3 mm) were used, with a nominal accuracy of ± 1 °C, in combination with a data acquisition uncertainty of ± 0.1 °C. The attachment method contributes an additional uncertainty of ± 0.85 °C, resulting in a total estimated uncertainty of ± 1.95 °C.
RESULTS
TUCA operation lifetime
The TUCA project began on January 20, 2014, with the manufacturing and charging of a heat pipe for the TUCA experiment. After several functional tests at the DIMEC Thermal Laboratory, TUCA was integrated into the AMZ1 satellite in 2019, where it remained until its launch into orbit in February 2021. Since then, the satellite has been operating at an altitude of 752 km in a Sun-synchronous orbit, collecting data for environmental monitoring.
The data in Table 3 show that TUCA has accumulated approximately 110 days of active operation and 3,381 days in standby, demonstrating its robustness and reliability over more than a decade.
Main results of NCG analysis obtained by the steady-state method
This section presents the results obtained from the thermal analysis, focusing on a comparative evaluation of TUCA’s temperature profiles under different conditions. The data acquired over several years in orbit are analyzed alongside the results from the thermal balance test (TBT), conducted during the qualification campaign for the AMZ1 satellite.
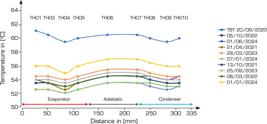
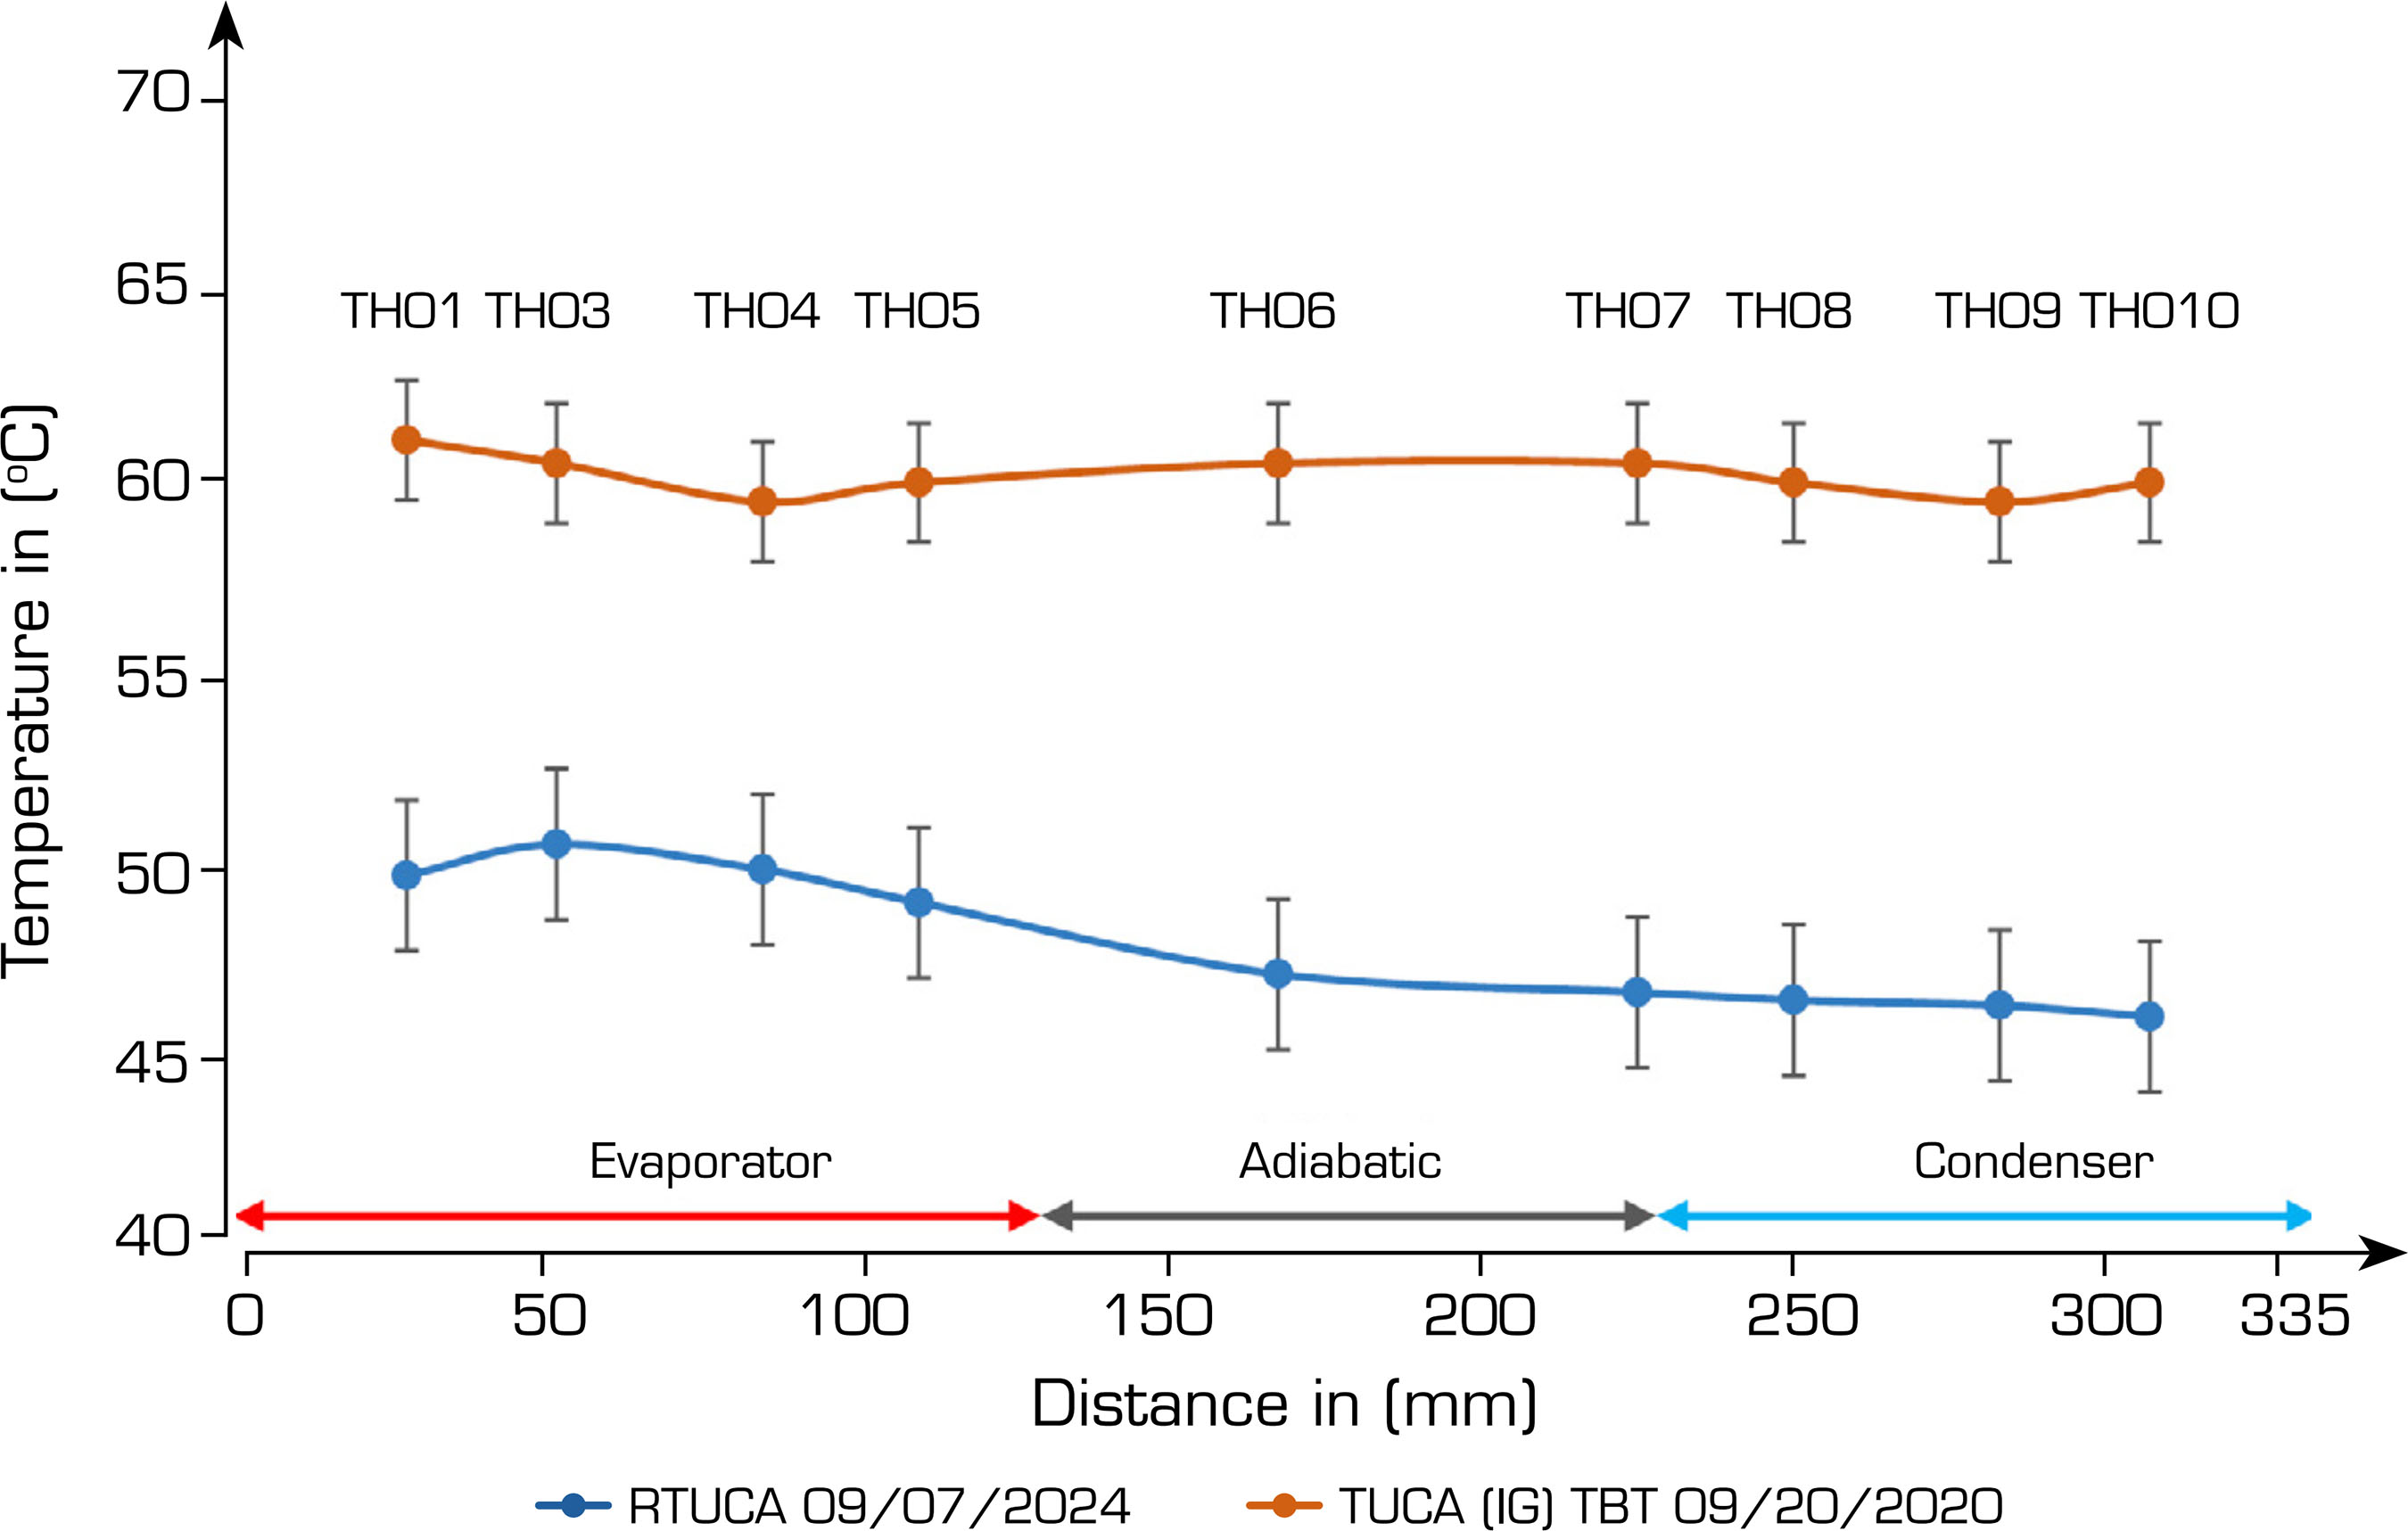
The TBT served as a critical validation step for the TUCA experiment before launch. Although TUCA was already integrated into its flight configuration, the contact plate interfacing with the condenser was not the same as the one used onboard the satellite; it was adapted specifically for the test setup. The primary objectives of this ground-based test were to ensure that all components were functioning correctly and to verify whether any NCGs were already present in the heat pipe before launch. Figure 12 shows the temperature distribution obtained during the TBT, which serves as a reference for comparison with the orbital temperature profiles.
The TBT provided valuable data under well-controlled boundary conditions, enabling refined thermal modeling and equipment calibration, as it minimized measurement noise due to improved ambient control and isolation from external thermal influences.
Beyond the verification of NCG presence, the comparison between 1 g (TBT) and 0 g (orbital) conditions also reveals intrinsic differences in the thermal performance of the heat pipe. Under terrestrial gravity, liquid tends to accumulate at the bottom of the condenser due to buoyancy forces, producing the so-called “pool effect,” which can reduce the effective condensation area and degrade heat transport capability. In microgravity (0 g), however, this phenomenon does not occur, and the liquid distribution becomes more uniform along the inner walls. As a result, the evaporation and condensation processes tend to be more homogeneous. These differences are reflected in the temperature gradients observed in Fig. 12 and are essential for understanding TUCA’s thermal behavior in orbit compared to ground testing.
Analyzing Fig. 12, it is possible to observe small variations in TUCA’s steady-state temperatures over the years of in-orbit operation. These fluctuations are mainly influenced by the satellite’s orbital position; at certain points, it is more exposed to direct solar radiation. Additionally, the time at which the measurements were taken may affect the thermal environment.
Another relevant factor is the thermal load distribution on the satellite’s structure. The plate that receives heat from TUCA’s condenser also serves as a dissipation interface for other onboard components. When TUCA is powered on, simultaneous operation of nearby systems can elevate the temperature of this shared surface, thereby influencing TUCA’s local thermal behavior.
Moreover, when analyzing the temperature profiles across different segments of TUCA, it is observed that the temperature in the adiabatic region, and occasionally even in the condenser, is higher than that in the evaporator, which is not the expected behavior. Ideally, the heater (evaporator) should present the highest temperature. This discrepancy arises due to uncertainty in thermistor bonding, which can affect the accuracy of temperature localization. Importantly, this atypical behavior was already identified during the TBT and remained consistent throughout the in-orbit measurements, reinforcing the hypothesis that the effect stems from sensor placement rather than real thermal anomalies.
As a result of this uncertainty, the condenser temperature occasionally appears higher than the evaporator temperature, preventing a reliable calculation of the heat pipe’s effective thermal conductivity using the relation , as the necessary temperature gradient Te _ Tc is obscured.
Nevertheless, for comparative purposes, particularly when evaluating steady-state profiles to detect the presence of NCGs, this uncertainty is considered negligible, as it does not significantly alter trend-based interpretations.
The formation of NCGs introduces thermal resistance within the condenser region, acting as a barrier to effective heat transfer. As illustrated in Fig. 1, this accumulation shifts the condensation front, leading to a noticeable temperature drop near the condenser, as shown in Fig. 2. This thermal behavior is one of the key indicators used to infer the presence of NCGs within the heat pipe during long-term operation.
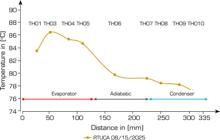
Now, in Fig. 13, comparing the results obtained between TUCA and TUCA (1 g) TBT, a minimal temperature drop can be observed at the end of the condenser of the RTUCA.

During the charging process, a small intentional air contamination was introduced, so the presence of NCG was already expected. At the power level of 9.5 W, the gas presence cannot be detected by analyzing the steady-state temperatures. This occurs because, at these temperatures, the acetone vapor pressure is low and not sufficient to compress the gas at the tube end to the point of causing a significant temperature drop in that region. However, in tests performed at 26 W, a slight temperature decrease can be observed at the last thermistor, as shown in Fig. 14. This decrease is expected since, in this temperature range, the acetone vapor pressure is high enough to concentrate the gas in the colder region of the tube.
Main results of NCG analysis obtained by the transient method
The results for the transient regime are presented below. We compared the response delay of the temperature change rate of the TUCA during rapid transients that occur in the first few seconds after turning on the heater (start-up) and at the moment of turning it off (shut-down). In theory, changes in the delay of the responses could indicate the generation of NCG in the TUCA during the AMZ1 mission. This transient method is more sensitive than the steady-state method. The time delays and response amplitudes of temperature change rates were analyzed based on telemetry from the beginning of the orbital phase (March 2021) and under current conditions (September 2024) in an attempt to detect any trends in changes in the response characteristics. During this period, the TUCA temperature telemetry underwent several changes, including adjustments in the time recording format, decimal precision, and reading intervals (from 8 to 1-second intervals). In the data processing, priority was given to the 1-second interval during the heating and cooling phases. Over the 45 months in orbit, small variations in the delay between the evaporator and condenser regions were observed: from 7 to 10 seconds during the heating phase and from 9 to 12 seconds during the cooling phase, with no noticeable trend of increase or decrease over time, as shown in Table 4.
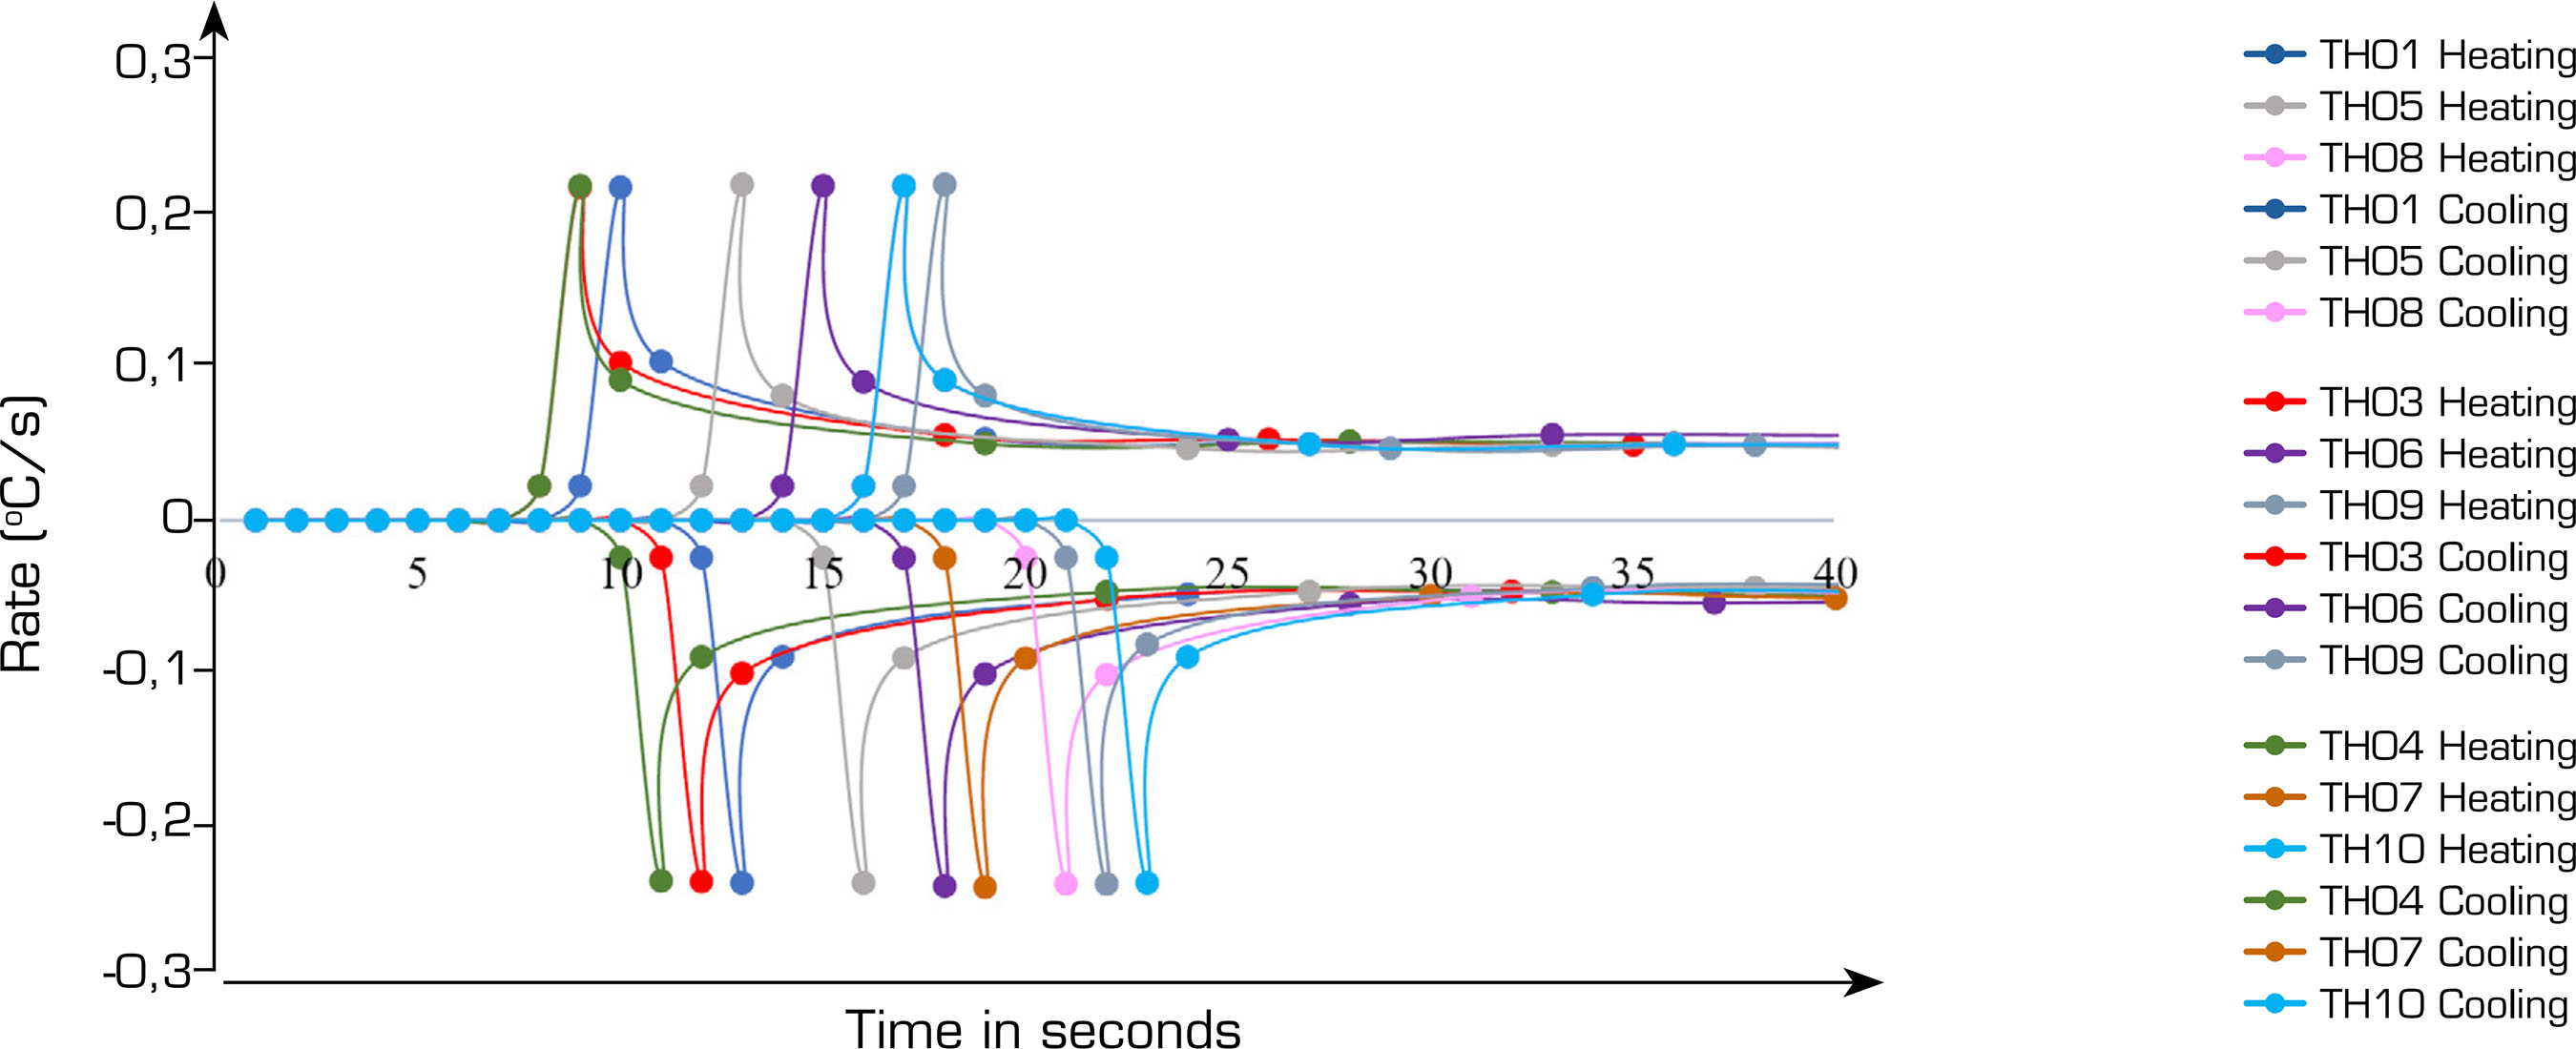
Figure 15 presents a general graph illustrating the thermal response of the TUCA during the transient heating and cooling phases, in terms of temperature change rate. The corresponding delay can be observed in the figure as the interval between the derivative peaks from sensor TH03 (beginning of the evaporator) and TH10 (end of the condenser). As displayed in Table 4, the graph in Fig. 15 was derived from data collected on multiple dates, showing minimal variation in response time and no distortion. No differences in rate amplitudes between the evaporator and condenser were observed. Furthermore, no changes in these amplitudes were detected over more than 3 years of the mission. All of this confirms that, using the transient method, which is more accurate than the steady-state method, there is no presence of NCG in the TUCA.

Thermal response profile of TUCA during the transient heating and cooling phases, highlighting the delay between peaks at the evaporator and condenser (TH03 and TH10).
In Fig. 16, the heating rate behavior between the evaporator and the condenser is illustrated. By analyzing the TH10 response, it is possible to identify an initial rise (due to the heat supplied by the skin heater), followed by a slight drop, and then another rise until stabilization is reached. This transient behavior is characteristic of heat pipes in the presence of NCGs, as previously illustrated in Fig. 3. Similar responses have also been reported in the literature, where the accumulation and redistribution of NCGs along the condenser region lead to delayed temperature rise and localized cooling effects, reinforcing the sensitivity of transient analysis for detecting small gas concentrations in heat pipes (Enke et al. 2021).

When analyzing the thermal behavior of TUCA and its laboratory replica RTUCA, it is important to consider the differences in experimental setups, which can influence some aspects of performance evaluation. While all configurations aimed to replicate the same heat pipe geometry and thermal instrumentation, variations in boundary conditions, heat dissipation paths, and gravitational environment introduce factors that must be considered when interpreting results.
One of these differences is related to the thermal dissipation plate used during TUCA’s TBT, which differs from the satellite panel employed in the space mission, the current setup where TUCA continues to operate, and from the aluminum heat sink used in the RTUCA configuration. These structural differences affect how heat is removed from the condenser region, potentially altering steady-state temperature gradients. Additionally, TUCA operates in a microgravity environment (0G), which eliminates gravitational effects such as fluid pooling and dry-out in the capillary structure, phenomena that are present in the 1G condition of RTUCA. Such effects can increase thermal resistance and affect efficiency on the ground, particularly in the condenser zone.
Furthermore, telemetry limitations in the TUCA experiment, specifically the 8-bit quantization used for temperature signal conversion, introduce a “staircase effect” that complicates derivative-based analyses. To address this, a dedicated algorithm was developed to process telemetry data, allowing for the recovery of meaningful transient information from quantized measurements.
Another important consideration involves the uncertainties associated with sensor attachment. In TUCA, the use of space-qualified thermistors combined with adhesive bonding contributes to an estimated uncertainty of ± 1.55 °C. In RTUCA, using commercial thermistors and a similar attachment method, this value is approximately ± 1.95 °C. While these levels are acceptable for trend analyses, they may influence the interpretation of subtle differences in steady-state conditions.
Despite these variations, it is essential to highlight that the methodology used to detect the presence of NCGs is fundamentally independent of the external test setup. The identification of NCGs is based on the internal thermal response of the heat pipe itself, such as delays in temperature rate peaks or distortions in the condenser’s thermal rates, which are directly associated with the physical behavior of the system and not with the mounting, orientation, or thermal interface.
In this context, while the differences between TUCA, RTUCA, and TBT setups may affect absolute efficiency comparisons, they do not compromise the validity or robustness of the NCG detection process. The transient method, in particular, proved to be highly sensitive and reliable for identifying internal performance degradation, being able to detect small amounts of NCG in RTUCA at lower power levels than in steady-state conditions.
Finally, it is worth emphasizing that the primary objective of this study is to assess the thermal performance of the TUCA heat pipe under extended microgravity (0G) conditions and to determine whether NCGs have formed over time as a result of exposure to thermal and cosmic radiation in space. The long-term telemetry analysis supports this investigation and contributes to the qualification of acetone-aluminum heat pipes for future orbital applications. In this context of TUCA in orbit, a direct comparison across different dates is allowed, since the setup remains unchanged over the years, and all materials involved are qualified for space missions.
CONCLUSION
The main outcome of these studies indicates that no NCG appears to have formed in the heat pipe of the TUCA technological experiment aboard the AMZ1 satellite during approximately 3.5 years in orbit. TUCA’s temperature telemetry data were thoroughly analyzed using two different methods. In the laboratory replica (RTUCA), the presence of NCG was identified as significant. This circumstance provided the basis for an indirect comparison between the performance of TUCA and RTUCA, allowing a detailed assessment of the behavior of a pipe with the same geometric characteristics but affected by gas.
For future work, it is recommended to continue monitoring TUCA in flight to verify the potential formation of NCG over time, to extrapolate the obtained orbital results of the acetone heat pipe for future longer missions of 10 to 12 years. This monitoring is crucial to ensure the proper functioning of the heat pipe throughout the mission and its qualification for applications in future satellites. Additionally, it is suggested to conduct new tests on the RTUCA by recharging with no NCG, allowing a direct comparison between TUCA (in a microgravity environment, 0G) and RTUCA (in a terrestrial gravity environment, 1G). This comparison is important to evaluate how gravity impacts the system’s efficiency, considering that in a 1G environment, phenomena such as the formation of liquid phase pools in the lower grooves and partial drying of upper grooves occur, which can influence the heat pipe’s performance.
ACKNOWLEDGEMENTS
The special thanks are addressed to DIMEC INPE colleagues and the TUCA team, who have participated in the project since 2009 and carried out the TUCA from the design to the orbital flight.
-
DECLARATION OF USE OF ARTIFICIAL INTELLIGENCE TOOLS
Artificial intelligence was not used.
-
FUNDING
Conselho Nacional de Desenvolvimento Científico e TecnológicoGrant No: 157709/2023-0
-
Peer Review History:
Single Blind Peer Review.
DATA AVAILABILITY STATEMENT
All data sets were generated or analyzed in the current study.
REFERENCES
- Anderson WG, Kroliczek EJ, Brennan PJ (2013) Intermediate temperature heat pipe life tests. Paper presented 2013 International Conference on Environmental Systems. American Institute of Aeronautics and Astronautics; Vail USA.
-
Bertoldo Junior J (2017) Estudo do desempenho de tubos de calor de alumínio ranhurados na presença de gás não condensável durante testes ambientais (doctoral thesis). São José dos Campos: Instituto Nacional de Pesquisas Espaciais. In Portuguese. Available at http://urlib.net/sid.inpe.br/mtc-m21b/2017/06.05.20.36
» http://urlib.net/sid.inpe.br/mtc-m21b/2017/06.05.20.36 -
Bertoldo Junior J, Vlassov VV, Genaro G (2014) Desempenho de tubos de calor com ranhuras axiais e seções transversais semelhantes carregados com amônia e acetona para aplicação espacial. Paper presented 2014 VIII Congresso Nacional de Engenharia Mecânica. ABCM; Uberlândia: Brasil. http://plutao.sid.inpe.br/attachment.cgi/sid.inpe.br/plutao/2014/12.01.12.57.22/doc/bertoldo_desempenho.pdf
» http://plutao.sid.inpe.br/attachment.cgi/sid.inpe.br/plutao/2014/12.01.12.57.22/doc/bertoldo_desempenho.pdf - Brennan PJ, Kroliczek EJ (1979) Heat pipe design handbook. Maryland: B & K Engineering, Inc.
- Chi SW (1976) Heat pipe theory and practice: a sourcebook. Washington: Hemisphere.
-
Enke C (2025) Improvement of noncondensable gas detection in heat pipes through modeling and optimization (doctoral thesis). São José dos Campos: Instituto Nacional de Pesquisas Espaciais. http://urlib.net/8JMKD2USNRW34T/4D8NR6S
» http://urlib.net/8JMKD2USNRW34T/4D8NR6S -
Enke C, Bertoldo Júnior J, Vlassov V (2021) Transient response of an axially-grooved aluminum-ammonia heat pipe with the presence of non-condensable gas. Appl Therm Eng 183:116135. https://doi.org/10.1016/j.applthermaleng.2020.116135
» https://doi.org/10.1016/j.applthermaleng.2020.116135 -
Enke C (2020) Numerical modeling of a heat pipe transient modes (master’s thesis). São José dos Campos: Instituto Nacional de Pesquisas Espaciais. Available at http://urlib.net/sid.inpe.br/mtc-m21c/2020/02.11.12.10
» http://urlib.net/sid.inpe.br/mtc-m21c/2020/02.11.12.10 - Faghri A (1995) Heat pipe science and technology. Washington: Taylor & Francis.
-
He J, Lin G, Bai L, Lu W, Miao J, Zhang H, Wen D (2013) Effect of non-condensable gas on startup of a loop thermosyphon. Int J Therm Sci 72:184-194. https://doi.org/10.1016/j.ijthermalsci.2013.05.009
» https://doi.org/10.1016/j.ijthermalsci.2013.05.009 - Hsieh JC, Lin DTW, Huang HJ, Yang TW (2014) An experimental study on the compatibility of acetone with aluminum flat-plate heat pipes. Heat and Mass Transfer 50:1525-1533.
- Kopiatkevich R, Gulia V, Goncharov K, Basov A (2014) Analysis methods of operation ability of radiation heat exchangers with heat pipes applied for Russian module of International Space Station. Paper presented 2014 International Conference Heat Pipes for Space Applications. Lavochkin Association; Moscow: Russia.
-
Lobanov AD (1991) Life tests of aluminium axial groove heat pipes with acetone as working fluid. Paper presented 1991 European Symposium on Space Environmental Control Systems. European Space Agency; Florence: Italy. https://ui.adsabs.harvard.edu/abs/1991secs.conf..583L/abstract
» https://ui.adsabs.harvard.edu/abs/1991secs.conf..583L/abstract -
Mantelli MBH, Ângelo WB, Borges T (2010) Performance of naphthalene thermosyphons with non-condensable gases: theoretical study and comparison with data. Int J Heat Mass Transf 53:3414-3428. https://doi.org/10.1016/j.ijheatmasstransfer.2010.03.041
» https://doi.org/10.1016/j.ijheatmasstransfer.2010.03.041 - Marcus BD (1972) Theory and design of variable conductance heat pipes. California: NASA.
-
Paiva KV, Mantelli MBH, Slongo LK (2015) Experimental testing of mini heat pipes under microgravity conditions aboard a suborbital rocket. Aerosp Sci Technol 45:367-375. 2015. https://doi.org/10.1016/j.ast.2015.06.004
» https://doi.org/10.1016/j.ast.2015.06.004 - Peterson GP (1994) An introduction to heat pipes: modeling, testing and applications. New York: Wiley.
-
Reay DA, Johnson MP (1976) The formation of diacetone alcohol during life tests on acetone heat pipes constructed using aluminum and stainless steel. Paper presented 1976 2nd International Heat Pipe Conference. ESA; Bologna, Italy. https://ui.adsabs.harvard.edu/abs/1976hepi.rept..393R/abstract
» https://ui.adsabs.harvard.edu/abs/1976hepi.rept..393R/abstract - Rosa RG (2025) Avaliação do desempenho do experimento tecnológico nacional do tubo de calor de acetona a bordo do satélite Amazonia 1: eficiência e desafios na detecção de gases não condensáveis (undergraduate thesis). São José dos Campos: Instituto Federal de Educação, Ciência e Tecnologia de São Paulo. In Portuguese.
-
Rosa RG, Vlassov V (2023) Estudo experimental e teórico sobre o efeito da inclinação no desempenho de tubos de calor com ranhuras axiais. Paper presented 2023 Workshop Em Engenharia E Tecnologia Espaciais. Instituto Nacional de Pesquisas Espaciais; São José dos Campos, Brazil. http://urlib.net/ibi/8JMKD3MGPDW34R/4AG9AM8
» http://urlib.net/ibi/8JMKD3MGPDW34R/4AG9AM8 -
Saad SMI, Ching CY, Ewing D (2012) The transient response of wicked heat pipes with non-condensable gas. Appl Therm Eng 37:403-411. https://doi.org/10.1016/j.applthermaleng.2011.11.058
» https://doi.org/10.1016/j.applthermaleng.2011.11.058 - Smirnov HF, Kochetkov A, Tretjakov SV (2009) Express control method of heat pipe performance. Paper presented 2009 Heat Pipes for Space Application. Lavochkin Association; Moscow: Russia.
Edited by
-
Section editor:
Marcia Mantelli https://orcid.org/0000-0002-6276-8993

 Source: Retrieved from
  Source: Retrieved from
  Source: Adapted from
  Source: TUCA project of DIMEC/CGCE/INPE, 2024.
 Source: TUCA project of DIMEC/CGCE/INPE, 2024.
 Source: Adapted from
  Source: Elaborated by the authors.
 Source: Elaborated by the authors.
 Source: Retrieved from
  Source: Elaborated by the authors.
 Source: Elaborated by the authors.
 Source: Elaborated by the authors.
 Source: Elaborated by the authors.
 Source: Elaborated by the authors.
 Source: Elaborated by the authors.
 Source: Elaborated by the authors.