
 Climate change coverage at the intersection of environmental and data journalism
Abstract
This study investigated the characteristics of environmental journalism in conjunction with data journalism, analyzing news articles and reports on climate change published between 2022 and 2023 by InfoAmazonia and ((o))eco. Based on an exploratory approach without predefined hypotheses, the research aimed to identify the specificities of this intersection, assess existing guidelines, and understand the challenges involved. Through content analysis, the study examined the relevance of these practices in the context of climate emergencies, considering their impact on the production of more in-depth and comprehensible reporting. The findings revealed that temporal and geospatial visualizations are crucial for addressing complex topics, although the choice of visualization formats must be aligned with communication objectives and the available data.
Keywords
Data Journalism; Environmental Journalism; Climate Change; InfoAmazonia; OEco
Resumo
Este estudo investigou características do jornalismo ambiental em interface com o jornalismo de dados, analisando notícias e reportagens sobre mudanças climáticas publicadas entre 2022 e 2023 nos veículos InfoAmazonia e ((o))eco. Com base em uma abordagem exploratória e sem hipóteses predefinidas, a pesquisa buscou identificar particularidades dessa junção, avaliar diretrizes existentes e compreender os desafios envolvidos. Por meio da análise de conteúdo, a pesquisa explorou a relevância das práticas no contexto das emergências climáticas, considerando o impacto na produção de reportagens mais aprofundadas e compreensíveis. Os resultados revelaram que as visualizações temporais e geoespaciais são cruciais para tratar de temas complexos, embora a escolha dos formatos de visualização precise estar alinhada aos objetivos de comunicação e aos dados disponíveis.
Palavras-chave
Jornalismo de Dados; Jornalismo Ambiental; Mudanças Climáticas; InfoAmazonia; OEco
Resumen
Este estudio investigó las características del periodismo ambiental en interacción con el periodismo de datos, analizando noticias y reportajes sobre el cambio climático publicados entre 2022 y 2023 en los medios InfoAmazonia y ((o))eco. Basado en un enfoque exploratorio y sin hipótesis predefinidas, la investigación buscó identificar las particularidades de esta convergencia, evaluar las directrices existentes y comprender los desafíos implicados. A través del análisis de contenido, el estudio examinó la relevancia de estas prácticas en el contexto de las emergencias climáticas, considerando su impacto en la producción de reportajes más profundos y comprensibles. Los resultados revelaron que las visualizaciones temporales y geoespaciales son fundamentales para abordar temas complejos, aunque la elección de los formatos de visualización debe estar alineada con los objetivos comunicativos y los datos disponibles.
Palabras clave
Periodismo de Datos; Periodismo Ambiental; Cambio Climático; InfoAmazonia; OEco
Introduction
In the field of communication, the development of Information Technologies (ICTs), boosts innovation in journalism. It’s from the internet, for example, that web journalism is born, opening fresh opportunities for producing and sharing news. Throughout the development of web journalism, the use of databases, which helped this journalistic practice evolve over time. The internet also ramped up the amount of information circulating out there. Now, all sorts of players—governments, organized civil society representatives, private organizations, and others—got involved in generating and sharing this information and data. During the 1990s and 2000s, there was a global push for freedom of information and government transparency, advocating for public data to be easily available to everyone.
Before a scenario of abundance of big volumes of data, the practice of data journalism transforms all this informational load into clear, objective and comprehensible stories. Assimilating this function to people who do not have enough knowledge to interpret the information contained in databases. Data Journalism (DJ) is a practice that has as raw material great data volume (Araújo, 2016). Although journalism already uses data, verify information in digital files, DJ differs by the level of digital information worked, in volumes that escape human comprehension without the help of other technologies (Träsel, 2017). It is through the processes carried out in this practice that data becomes intelligible to the public.
This article focuses on investigating characteristics of Environmental Journalism (EJ), in interface with JD, studying the news reports about climatic changes of InfoAmazonia and ((o))eco. The research problem that drives this work can be summarized as: which particularities are presented in DJ in interface with EJ? To drive this investigation methodological procedures of content analysis were used.
The crossover between Environmental and Data Journalism
The growth in participation in initiatives which promote public information transparency, such as the federal law 12.527/2011, better known as the access to information law allows the use of practices such as Data-Driven Journalism (DDJ)1. The database connected to environment was one of the categories which data availability increased. Therefore, it is possible to consider that this data reinforcement has also enhanced, or may enhance, the EJ.
Environmental Journalism is a specialization of the journalistic activity consolidated in the last quarter of the 20th century (Belmonte, 2015). Between the 1970s and the 1980s, was observed an increase in the volume of information about the environment and a bigger presence of scientific sources (Barros e Lima, 2012). As indicated by Giardi, Loose and Silva (2018), in Brazil, since 1960, news reports focused on the environment are found, even in a time where such news reports were not recognized as a journalistic specialization but rather approached from the perspective of scientific journalism.
Reflecting about the reasons connected to the low execution of the EJ in journalistic vehicles, Belmonte (2015, p.70) says that the work frequency of EJ “depends almost exclusively on the initiative and of the professional commitment of journalists who recognize the importance of the socio-environmental fight to promote planetary quality of life”. But the researcher also recognizes that, with the changes in Brazilian newsrooms resulting from budget and staff cuts, the opportunities and conditions and execution of relevant news reports about socio-environmental themes are also reduced. This context is similar to the conjecture in which DJ has developed. Grandin (2014, p. 91) points out that the practice appears in the context of financial and structural crisis of journalistic organizations, in which journalism sought to innovate and create new means to attribute more economic value to its work (Picard, 2009).
Belmonte (2017, p. 122) showed that EJ “can and should be potentialized with contemporary verification techniques, such as journalism guided by data” in the people mobilization process facing environmental challenges. Following the argument of Vecchio-Lima e Lira (2023, p. 03), when reflecting about the possibility of intersection between two journalistic practices, it is possible to realize that “two modalities can intertwine in certain moments or production practices”. Thus, it is understood that environmental journalism and data journalism can merge, that is, a journalistic production can present both EJ and DJ characteristics, receiving the label of both fields or of ‘environmental data journalism’.
Träsel (2013) points out some projects that stood out in the development of JGD in Brazil. To that end, we highlight two related to environmental journalism: InfoAmazônia and Ecolab from ((o))eco, a Laboratory of Innovation in Environmental Journalism. According to Faleiros (2013), InfoAmazonia was created in June 2012 through a partnership between ((o))eco and Internews (a North American organization) that received financing from the International Center for Journalists (ICFJ). At the time, InfoAmazônia used satellite images of the National Aeronautics and Space Administration (NASA) and from the National Institute for Space Research (INPE) to monitor deforestation and fires in the Legal Amazon and associate the data with news reports related to mining, fires, conservation, among other topics (Faleiros, 2013).
The journalist César López Linares (2022) points out that currently DJ is one of the practices that is being used by Latin American journalists to develop productions about social and environmental conflicts in the Legal Amazon. Linares highlights vehicle production from three countries: Venezuela, Brazil and Colombia. A series of reports entitled “Secret Corridors”2, published between January and February 2022 in the Venezuelan portal Armando info and the Spanish El País, is an example. According to the journalist, the reports stood out for data visualization work in maps and cartography.
Throughout the six articles, the geolocated data are contrasted with other layers of information, such as irregular groups (Colombian guerrillas, gold mafia and other Brazilian criminal groups) present in the Venezuelan Amazon, as well as the relation of these groups with the indigenous communities in the area. “Secret Corridors” demonstrated how technology can help to overcome the dangers of doing journalism in the Amazon (...)
(Linares, 2022, unpaged).
Other example is the Brazilian production published on the site The Intercept, between September 2021 and February 2022, titled “The runways of destruction”3. Both reports used a computer vision analysis algorithm for satellite imagery that was programmed to detect images similar to aerial captures of mines and runways. The data obtained was georeferenced and contrasted in maps (Linares, 2022).
Linares (2022) also highlights the production ‘El ganado acorrala a la Amazonía’4 (‘Cattle are cornering the Amazon’), published in 360-grados.co which addresses how the production chains of large industries benefit from deforestation to carry out extensive livestock farming. This report was created using data obtained through requests for access to public information, which were subsequently georeferenced and cross-referenced with other databases of deforestation, soil degradation, and satellite imagery. Right after, they were analyzed and presented by visualizations that contrast cattle movement with the points most affected by deforestation.
In these examples pointed out by Linares (2022), it is possible to observe that the journalists created databases to cross-reference with other databases. Furthermore, there are different types of organizations and distinct performances which contribute by creating environmental databases. In Brazil, a social groups exploratory mapping that produce and circulate data on climate change, territorial protection, and inequalities, realized by Open Knowledge Brasil, identified 182 actors (Brazil, 2023). Ryan (2024) points out that the work with data journalism can make it easier for people who do not understand to comprehend better climatic changes, through analysis, visualizations and data-based narratives:
Data journalists use graphs, tables, maps and other visual resources to help the reader to understand climate data. These graphic illustrations can describe changes, associations and structure in climate information, which help in the explanation of advanced information for the crowd
(Ryan, 2024, unpaged).
Morini, Eschenbacher, Hartmann, Dörk (2024) point out some challenges for the data visualization applied in climate journalism:
-
Multidimensionality - Data about heterogeneous climate (spatial, temporal, multivariate etc.) and demand the application of a diversity of visualization techniques.
-
Multilevel - Climate changes unfold in many levels, from global to local, from structural to individual. Due to the scarcity of local data, it is challenging for the reader to understand the impacts of climate change on their daily life.
-
Multichannel – Considering the different types of readers, to reach a big and different group, it is necessary to distribute the visualizations of the climate changes in different types of media.
Morini, Eschenbacher, Hartmann, Dörk (2024) also indicate five ambitions to the designing data visualizations to serve constructive climate journalism: a) Incentive hope – to use visualization to incentive hope and to mitigate climate anxiety on the readers; b) Offer a comprehensible data analysis – the information should be delivered in a comprehensible form and followed by clear explanations; c) Relevant visualizations – to use personally relevant information, such as local or regional information considering social and cultural influences as an important part of the data selection; d) Support for sharing views on the visualization - The datasets don't speak for themselves, readers should be capable to exchange thoughts in the context of visualizations; e) Presence in different platforms – the projects should attract readers with a widely varied news consumption habits, therefore it is crucial to be in different platforms.
As the use of DJ as an EJ interface is already identified, it is important to highlight that the practices share common challenges for their consolidation. Despite this, DJ seems to be a practice that can potentialize the narratives presented on EJ (Linares, 2022). Although the use of open data is not exclusive to the journalistic field, communication vehicles are one of the main actors that use information produced by open data initiatives, considering that “means of communication, or the press, are often mentioned by the initiatives as a intermediate user to reach a bigger public and, above all, access decision makers” (Vello, et. al. p.27, 2020).
Methodological procedures
This research aims to investigate how environmental journalism, in conjunction with data journalism, addresses climate change in news reports and/or articles. This way, the defined methodology is geared towards analyzing journalistic content present in the portals InfoAmazonia and ((o))eco. Due to the qualitative-quantitative nature of the research, the main methodological contribution is the content analysis based on a blending of the studies of the French sociologist Laurence Bardin (2011) and of the Brazilian researchers Rafael Cardoso Sampaio e Diógenes Lycarião (2021).
The collection of the corpus for content analysis, in both communication vehicles, occurred in some steps of a sample process. The corpus worked in the research are news reports and articles published in InfoAmazonia and ((o))eco. Both communication vehicles act in web journalism and are considered specialized vehicles in environmental journalism. The choice of the sites occurred because of the auto-declaration of the vehicles when they were referred to in academic research in the EJ field.
The period for collecting published material was delimited between 1st January 2022 and 31st December 2023. From these definitions, a data scraping technique that makes up the corpus and registers them on a spreadsheet was performed. The technique consists of collecting web content, selecting elements from the site, transforming them into a table. A data scraping tool with a graphic interface called Web Scraper was used. The scraper collected the following data from the material: slug, title, abstract, data, and access URL.
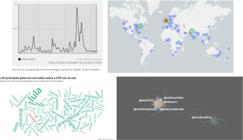
The next phase of corpus delimitation was about delimitation of material with the topic of climate change. This delimitation happened from the analysis of the spreadsheet columns with information about slug5, title and the summary of the material. In this process, starting from an understanding of the terms used by journalism on this topic, it was verified the presence of keywords: ‘climate change’, ‘climate emergency’, ‘climate crisis’, ‘climate goals’, climate alteration’, ‘climate alterations’. These keywords were defined from the comprehension that these expressions constitute the variations used in communication to refer to climate changes. The final phase of delimitation was to remove material that did not identify with news reports.
After the delimitations described, the ((o))eco portal presented 28 materials in 2022 and 30 in 2023. InfoAmazon presented five pieces of material in 2022 and 18 in the following year. Facing this material difference between the two portals, a simple random sampling technique was applied, in which the number of materials was drawn from a list containing all the units. Thus, in 2022, five materials from InfoAmazonia and 7 of the 28 materials from ((o))eco were collected. In 2023, 19 materials from InfoAmazonia and 19 from 30 materials from ((o))eco were collected. This way, for the corpus of this research, 47 materials were delimited. From the total of coded materials, 26 were identified as ‘News’ and the other 21 as ‘News Reports’.
From the composition of the corpus, methodological procedures of Content Analysis (CA) based in models proposed by Bardin (2011) and Sampaio and Lycarião (2021) were applied. Considering the nature of the corpus presented in the web, it was defined that the sample unit from this CA is composed of news and news reports, which are available in online communication vehicles (physical unit). In the analysis unit were selected the news/reports complete text and the data visualization presented or not in the material. The coding system of the research was composed from a bibliographic referential in the fields of environmental and data journalism and other existent theoretical and practical content. Thus, this article presents five analysis categories:
a) Information on current solutions
The category was created considering whether the material, apart from bringing information to the readers, also contributed to the presentation of information related to the adaptation of the modifications imposed by climate changes. This category is inspired by the Mini manual for climate change journalistic coverage (Amaral, Loose e Girardi, 2020). Thus, the following codes were defined: Adaptation, Mitigation, and Not present.
b) Information proximity
In connection with the previous category, this category was created to analyze the geographic level treated in the information presented in the materials. The objective is to observe the frequency level of the climate changes coverage, data use and information distributed in the dimension of the exposed reality in the codes: Biome, Local, State, Regional, National, Continental and Global. It can be estimated, or not, that there is a tendency to favor the coverage for one of these levels worked.
c) Sources plurality
This category was elaborated to analyze the information sources demanded in the material, checking if there is a plurality of voices based on the material. The creation of this category was primarily aimed at understanding whether the voices of people impacted by climate change were being heard in the development of this material. It considered different types of voices: people, government bodies, institutions, Community, business, political, judicial, scientific, institutional based NGOs. However, such perspective was hierarchical according to the number of voices demanded in the material, resulting in the following codes: Not present, Low level of plurality, Medium level of plurality and High level of plurality.
d) Types of data visualization
This category was created to previously verify if, in the analyzed material, there was a presence of a data journalism practice expressed in a data visualization. Considering the different types of data visualization created from different objectives and data format, the following codes were defined to classify the present data visualization (or not) of the materials: Temporal, Hierarchical, Network, Multidimensional, Geospatial, Table and Not present.
e) Used data sources
Created to classify and verify the origin of data used in data visualizations of the material. It was considered, via code frequency, to show the origin of the most demanded data in the material. It was defined the codes: Own creation Institutional, Network, Academic, Social Movement, NGO, Trade Union and Not Present/ Not Applicable.
It was, however, realized the treatment of the obtained results and the interpretation and realization of data interference.
Results and analysis
The category Information on current solutions presented an expressive result of the code ‘Not present’, being around 60% of the occurrences, followed by the code ‘Mitigation’ with 34% and the code ‘Adaptation’ with 6%. These results presented by the communication vehicles show an interpretation that diverges of the educational dimension of the EJ (Bueno, 2007) of explaining causes and solutions to overcome environmental problems such as the climate changes impact. Furthermore, at the heart of JA's work lies the responsibility of contributing to a change in mindset, encouraging citizens to act in favor of environmental justice. (Loose; Girardi, 2017).
In the cases where this kind of information was registered, it was identified a predominance of long-term solutions, that is, a mitigation of climate change impacts. Therefore, the results of this category bring an indication of the limitation of the journalistic material related to information about combat to climate changes. It can be considered that the approach of the agenda related to the theme, without supplying the need of the reader who searches in journalism to comprehend the theme and for information about what they can do about this as a citizen. In the mitigation code were presented, mostly, cases about the strengthening and the creation of public politics for the fight against climate changes, that is, long-term solutions in evidence.
In the category Information proximity, the results showed a bigger occurrence of the code ‘National’, representing around 36%, followed by the code ‘Biome’, with approximately 23%. These performed approximately double the average of other codes that classified a relative number of occurrences: Local’ (5), ‘State’ (5) and ‘Global’ (7). The rest of the codes of this category resulted in low occurrences: Continental’ (2) and ‘Regional’ (0).
Thus, the category demonstrated a predominance of information focused on specific countries and biomes. In the case of countries, it was highlighted, in number of occurrences, the materials that dealt with the agenda in Brazil, although occurrences in other countries were also registered. Although the code ‘Biome’ encompasses various types of biomes, the Amazon biome and the Legal Amazon region stood out in terms of the number of occurrences. This highlights the priority attributed to these territories when approaching agendas about climate changes in the Brazilian geographic context, and also the relevance of Legal Amazon in the debates about the theme. Despite being from Brazilian communication vehicles, it is important to highlight that, when discussing the Amazon biome, the approach extends not only to Brazil and the Brazilian states that make up the Legal Amazon, but also countries that are part of the delimitation of the biome, of Pan-Amazon, like Peru, Bolivia and Colombia.
In the category Sources plurality, the code ‘Not present’ represented 21% of the material, the code ‘Low degree of plurality’ 38%, ‘Medium degree of plurality’ 32%, and ‘High degree of plurality’ just 8%. It was possible to observe that the high diversity of all types of sources, presented in the code ‘High degree of plurality’ characterized by 5 or more types of voices, presented the lowest number of occurrences in the material. Even with the category considering the citations of information from voices in testimonies, notes, data, etc., the complexity of the climate changes theme maybe is not, in most cases, seen in the creation of journalistic materials. It is worth highlighting that according to Loose and Girardi (2017), the plurality of voices is one of the bases of EJ, encompassing different legitimacies, such as scientific, business, and political.
Therefore, it is identified by the percentage of 70% of the adding of the codes that registered the biggest occurrences (Low degree of plurality’ and ‘Medium degree of plurality’) The indication of the use of two to four types of voices as a standard in the materials. Scientific, institutional and governmental types of voices are the most requested and presented in the materials.
In the category Types of data visualizations, 76% of the material did not present data visualizations, one of the units of corpus analysis. It was not registered the occurrences of the codes ‘Hierarchical’, ‘Network’ and ‘Table’. Of the materials that presented data visualization, most (6) were coded as ‘Temporal’, followed by the code ‘Geospatial’ and “Multidimensional’ as an occurrence.
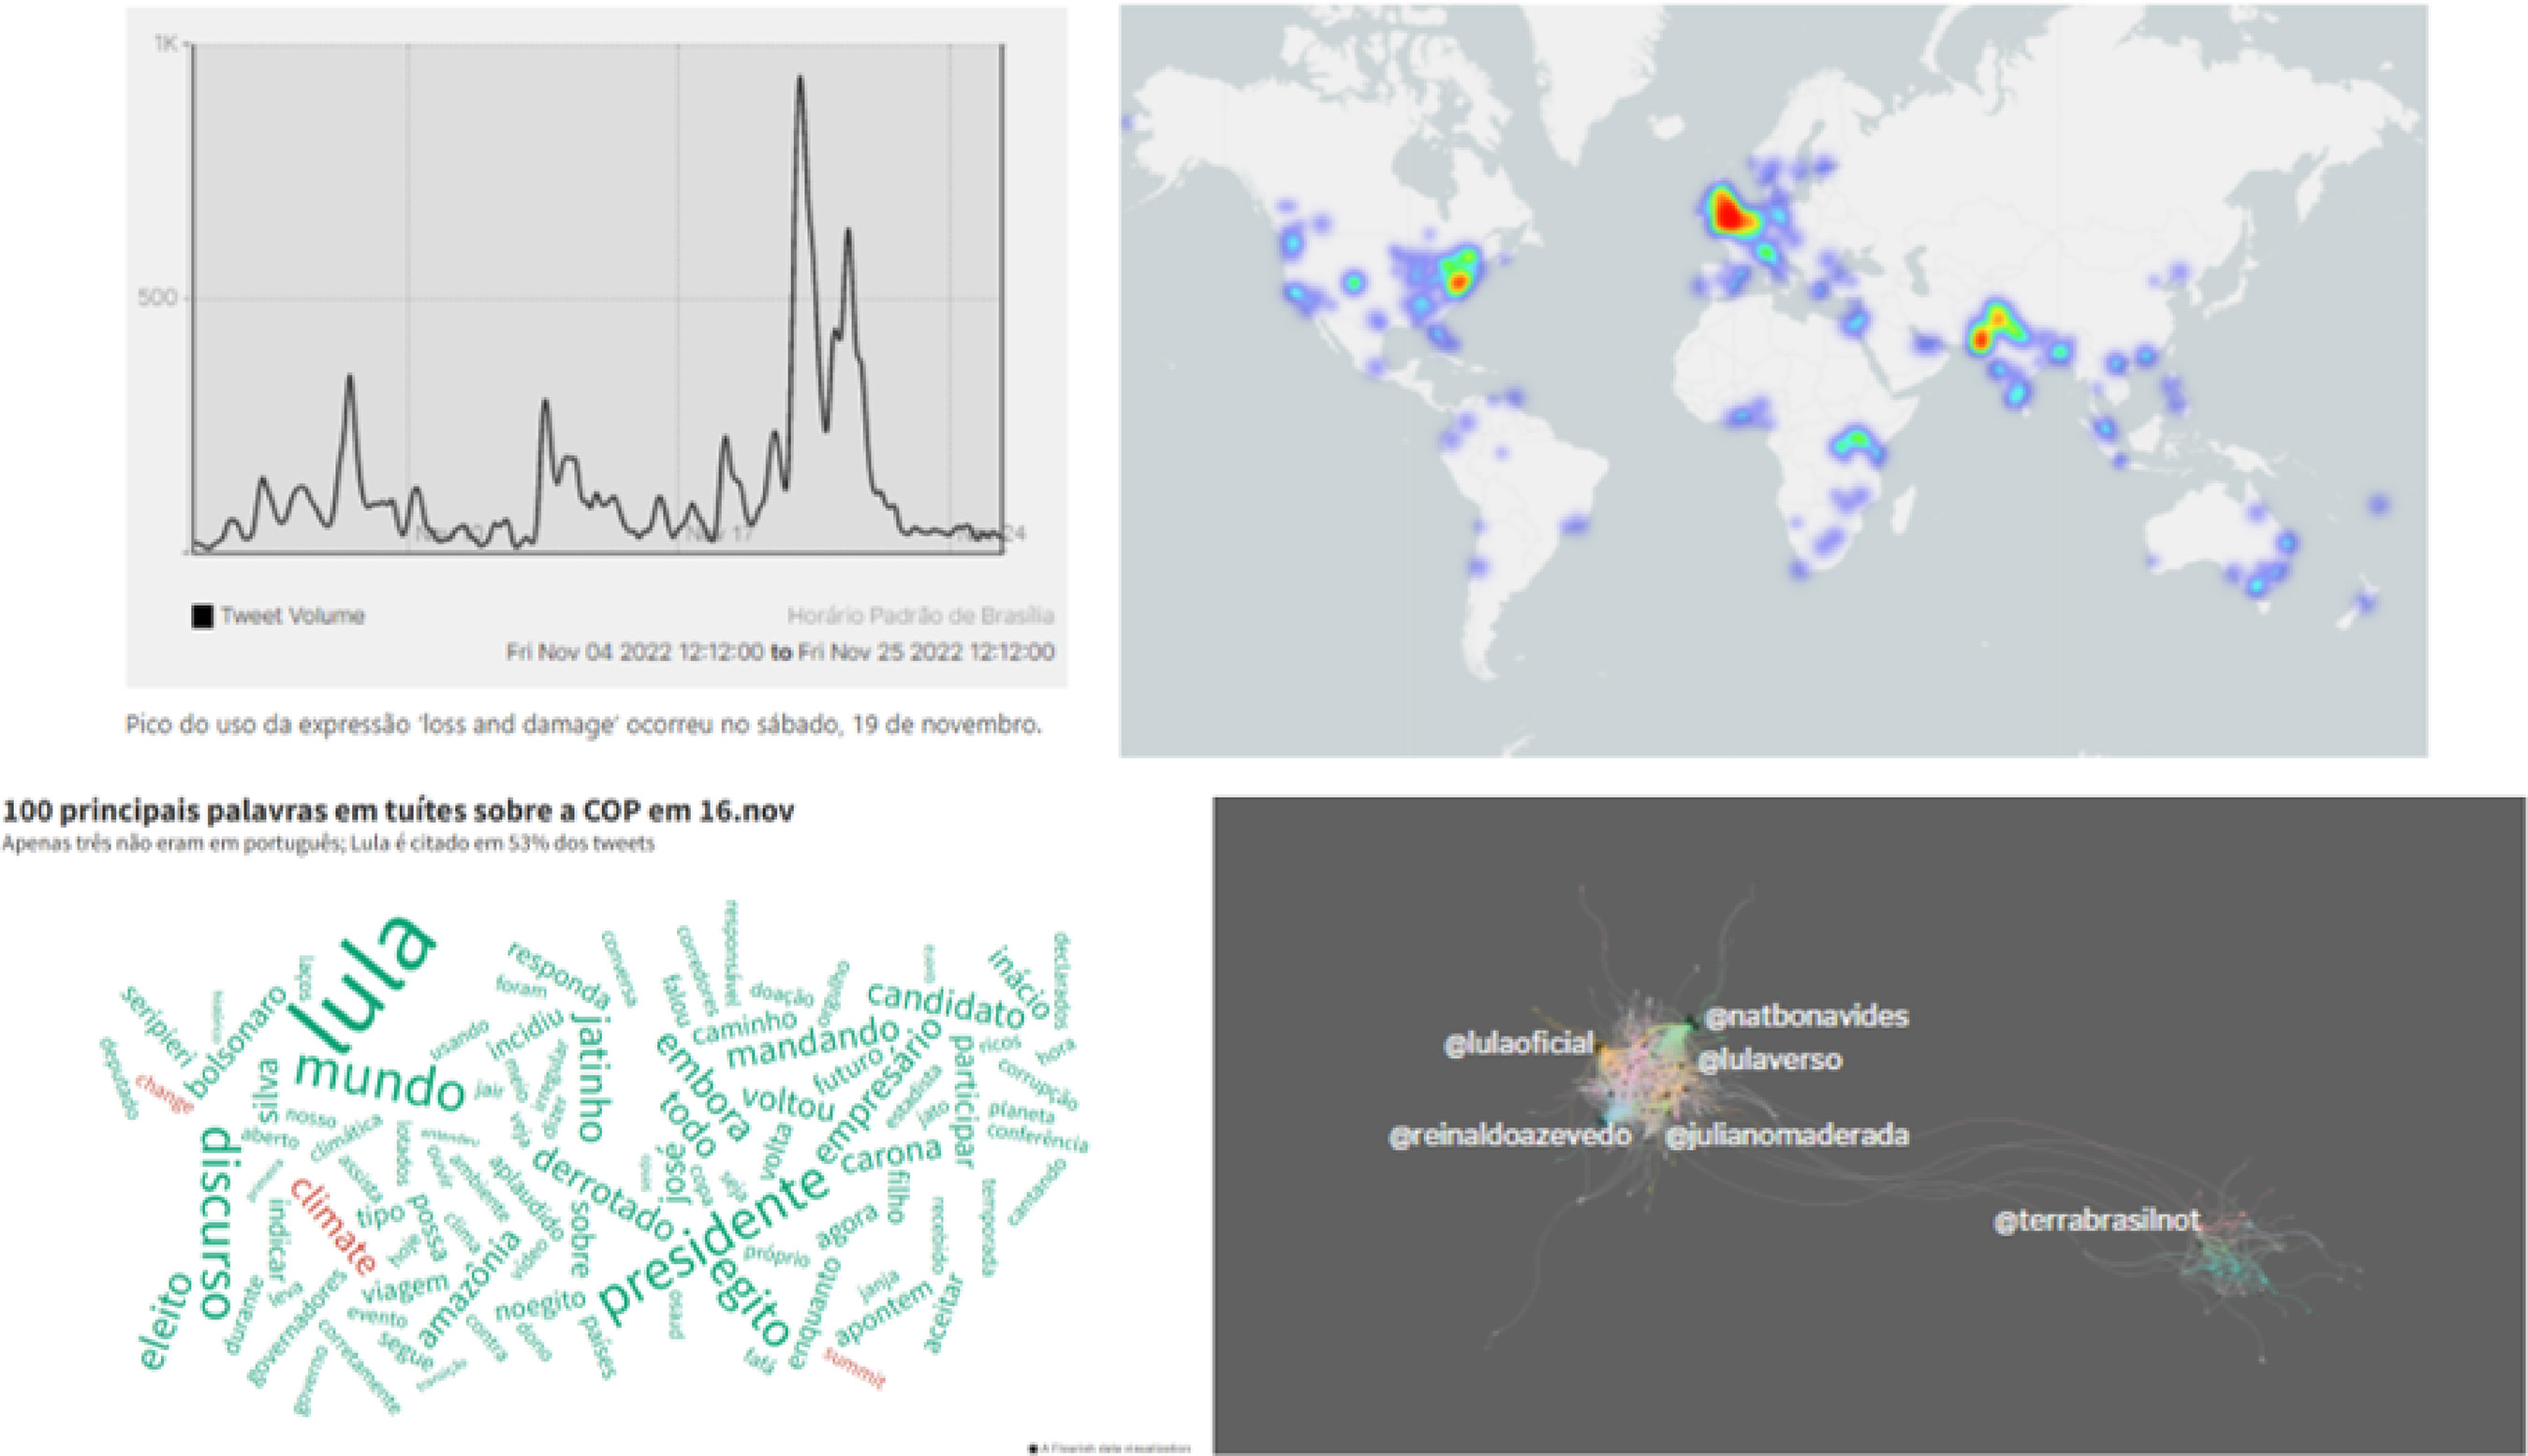
Although the category does not present results that indicate a diversity of data visualizations – which, according to Sousa (2020), are characterized by a range of different formats. Still, it’s considered that the materials have presented a greater diversity, which was not captured due to the categorization rules of the research codebook. As was the case with the material “In Brazil, debate about climate emergency at COP27 is ‘kidnapped’ by political arguments and the presence of Lula”6, which presented four different types of data visualization. But it was inserted in the code ‘Temporal’ of the category.
This greater diversity can be noticed upon verifying all the visualizations presented in the analyzed materials. The work with data journalism plays an important role in the climate change agenda, as pointed out by Ryan (2024). According to the author, working with analyses, visualizations, and data-driven narratives makes it easier for people who are not experts on the subject to understand this environmental problem.
The category Used data sources yielded the following results: 81% of the material was coded as ‘Not Present/Not applicable’. This percentage also converges with the category of Data Visualization, which showed that 76% of the material did not present data visualization. However, it is noted that in the percentage of this category, there were also identified material which have presented data visualization but did not provide the source of the released data (both cases). In the results, it was also identified that most of the data sources for the visualizations are from the ‘Institutional’ code (5), but there are also occurrences in the code ‘Own creation’ (2), ‘Network’ (1), and ‘Academic’ (1).
In the codes ‘Social Movement’, ‘NGO’ and ‘Union’ there were no identified occurrences. That indicates that public or private bodies and institutions play an important role in DJ’s work, a tendency that aligns with the context of publicizing data by governments and organizations, in face of the open data policies progress (Gehrke, 2020). Therefore, we emphasize that it is necessary to consider the existence of the self-interests of these institutions in the creation of the databases offered, since data is human construct (Costa et al., 2020) that represent complex phenomena of reality. This way, it’s noteworthy how much effort professionals put into creating their own databases used in this practice, something that brings an even more independent aspect to the construction of journalistic materials.
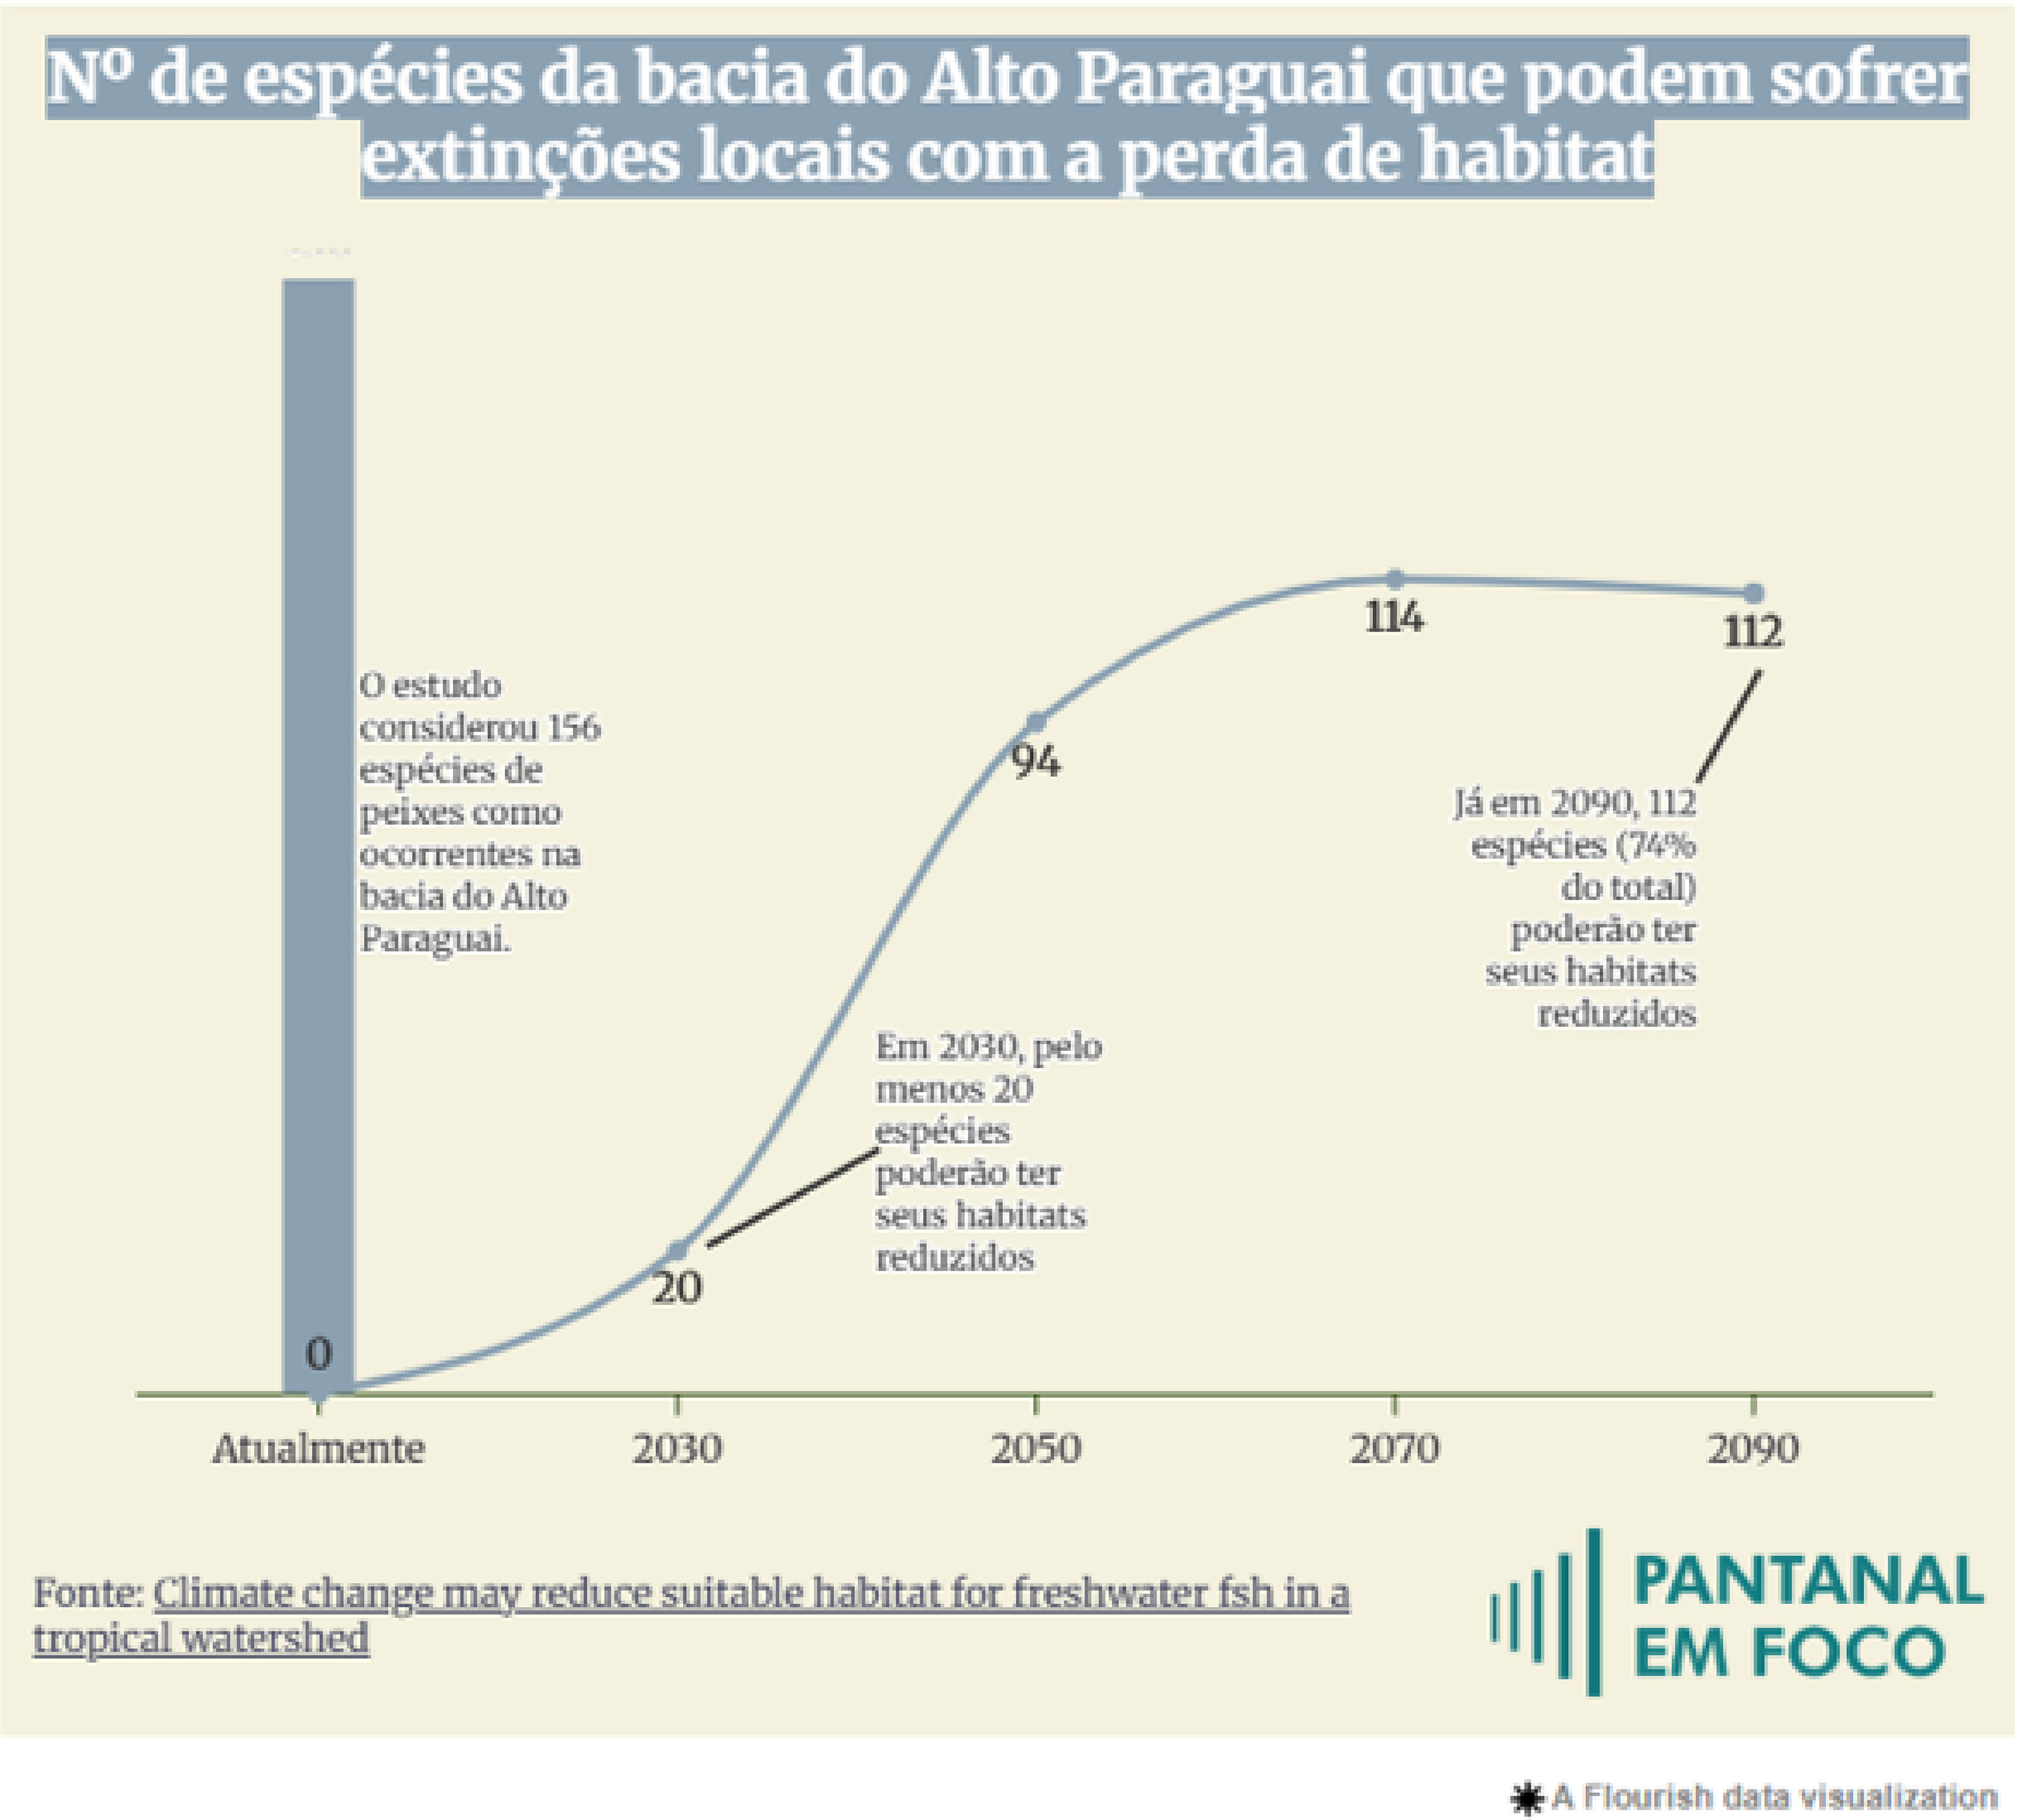
Another characteristic presented in the results was the high number of materials which addressed scientific publications related to climate change. Despite the expressive quantity, only one coded data source material was characterized as academic. This case highlights a potential lack of use of data produced by the scientific community in journalistic productions. One example of this potential is the material titled “Climate change threatens fish in the Upper Paraguay basin.”7 from the vehicle ((o))eco. This material addresses a study developed by Brazilian researchers about the climate changes impact in aquatic animals in the Prata and Upper Paraguay basins.
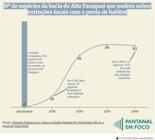
The results were published as an article in an international science magazine, and the data present in the article were used in the creation of data visualization. Roughly 76% of the corpus did not detect the presence of a data visualization, resulting in 11 materials with the presence of data journalism, highlighting an isolated analysis of this cut. From the total, only one material is from ((o))eco, and the other ten are from InfoAmazonia. This difference is meaningful, considering that InfoAmazonia is defined as an independent vehicle that uses data, maps and geo-located reports to tell stories about the biggest continuous rainforest in the planet, whilst ((o))eco presents itself with the proposal of producing journalistic and opinion content, addressing environmental themes.
In the category Proximity, the highest frequency was of the code Biome, that is, in the materials that presented information addressing some biome, like the Amazon. This shows a certain effort from the vehicles that covered topics threatening to Brazilian biomes. We infer that the highest frequency of the Amazon biome occurs due to the global importance when thinking about climate regulation, and also the fact that, constantly, environmental crime scenarios, that is, a risky environment that attracts news coverage. In this geographical level, on which there are many territorial particularities, where there is a need for a more precise orientation for the residents. This is one of the challenges for data visualization applied in climate journalism, according to Morini, Eschenbacher, Hartmann, Dörk (2024). The low volume of local data is an obstacle to the comprehension of the readers of the climate changes impacts on their daily life. And we must also consider the difficulty that independent vehicles must accomplish broad coverage, focused on local level, which leaves them at the mercy of being more 'unsupported' by journalism.
Seven out of 11 materials present, along with identifying the authorship of the material, information about the journalist, clarifying whether the funded news story or report is part of a series of reports or a project, or a partnership with some institution. This information may indicate that the consolidation of a work routine addressed to data journalism in the newsrooms, including the specialized ones, is still difficult, even though this approach has a positive influence on the professionals.
With more than half of the occurrences on temporal visualization codes, it is inferred that this type of visualization is well requested when talking about climate changes, as it is an artifice to visually demonstrate a worsening of climate changes throughout a period of time. Furthermore, the presence of geospatial visualizations also highlights the potentiality connected to climate changes, as these types of visualizations can present data related to the real world, allowing a clearer understanding of the reader on how they are being affected by this context.
However, the types of data visualizations are associated with a specific communication objective to be defined, besides being connected to the types of data available to the conclusion of their work. Thus, the definition of the type of visualization is crucial to allow the reader to comprehend the data. For instance, we understand that, facing an objective of highlighting standards in geographical data, the best option is to use a heat map and not a bar chart.
Some considerations
This work sought to investigate characteristics of environmental journalism, in interface with data journalism, in news and reports that focused on climate change, aiming to outline characteristics which can be guiding principles for the merger of the two practices. Through described methodological procedures, focusing on content analysis methodology, we achieved results that allowed the realization of deductions about the relation between the two practices when addressing climate changes.
Data journalism as an interface of environmental journalism presented characteristics such as the use of data visualization of a temporal and geospatial type and the use of data of an institutional origin. Still, the choice of this type of visualization is a challenge that should be always in-line with the communication objective and to the types of available data, aiming to make it easier for the public to understand.
The comparisons between practices made it possible to verify the challenge of linking the two areas, obtaining a higher efficacy in vehicles with a direct proposal to invest in applying data journalism. The results indicate that this investment in the junction of these practices is characterized by the financing of the reports by institutions, initiatives, projects and production of public notices, many times connected to the protection of the environment. Besides, it was possible to conclude that data journalism still faces significant challenges for its consolidation in newsrooms, and even in specialized journalism newsrooms. Thus, we affirm that the results of the research demonstrate that there is a promising interface between environmental and data journalism, generating complementary insights that enhance narratives on globally relevant topics, such as climate change.
How to cite:
Inclusive Language:
Plagiarism Check:
Funding:
XML Editing and Markup:
1
2
5
Data Availability:
All data supporting this article are contained within the body of the text.
References
- AMARAL, Márcia Franz; LOOSE, Eloísa Beling; GIRARDI, Ilza Maria Tourinho (Org.). Minimanual para a cobertura jornalística das mudanças climáticas. Santa Maria/RS: FACOS-UFSM, 2020. 52 p.
- ARAÚJO, Lucas Vieira. A web e o jornalismo de dados: mapeamento de conceitos chave. Dispositiva, Minas Gerais, n.°5, v.2, p.144-163, ago. 2016.
- BARDIN, Laurence. Análise de conteúdo. Lisboa: Edições 70, 2011.
-
BARROS, Antonio Teixeira; LIMA, Maria Érica de Oliveira. A eficácia do jornalismo ambiental: dinâmicas e possibilidades. In: X Encontro Nacional de Pesquisadores em Jornalismo, 2012, Curitiba. Anais ... Curitiba: SBPJor, 2012. Disponível em: < https://conferencias.unb.br/index.php/ENPJor/XENPJOR/schedConf/presentations >. Acesso em: 24 fev. 2025.
» https://conferencias.unb.br/index.php/ENPJor/XENPJOR/schedConf/presentations - BELMONTE, Roberto Villar. A construção do discurso da economia verde na revista Página 22. Dissertação (Mestrado em Comunicação e Informação). Porto Alegre, Universidade Federal do Rio Grande do Sul, 2015.
- BUENO, Wilson da Costa. Jornalismo Ambiental: explorando além do conceito. Desenvolvimento e Meio Ambiente, n. 15, p. 33-44, jan./jun. 2007. Editora UFPR.
- COSTA, Adriano Belisário Feitosa da et al.Fluxo do trabalho com dados [recurso eletrônico]: do zero à prática Organização: Open Knowledge Brasil. São Paulo: Open Knowledge Brasil, 2020.
- DEL VECCHIO DE LIMA, Myrian Regina; OLIARI LIRA, Arthur. REPORTAGENS INVESTIGATIVAS E COBERTURA DIÁRIA: requisitos para a busca de qualidade no jornalismo ambiental: requirements for the quality in environmental journalism. Comunicação & Inovação, [S. l.], v. 24, p. e20238933, 2023.
- FALEIROS, Gustavo. InfoAmazônia: o diálogo entre jornalismo e dados geográficos. In: BOUNEGRU, Liliana; CHAMBERS, Lucy; GRAY, Jonathan (Org.). Manual de Jornalismo de Dados São Paulo: O'Reilly Media, European Journalism Centre e Open Knowledge Foundation, 2023.
- GERKE, Marília. As fontes acionadas no Jornalismo Guiado por Dados durante a cobertura da Covid-19. In: Seminário de Pesquisa em Jornalismo Investigativo, VII, 2020, Anais eletrônicos. p. 1-19.
- GIRARDI, I. M. T.; LOOSE, E. B.; ALMEIDA DA SILVA, J. O jornalismo ambiental na concepção de quem o faz: estudo com jornalistas da América Latina, Caribe, Portugal, Espanha e países africanos de língua portuguesa. Aturá Revista Pan-Amazônica de Comunicação, v. 2, n. 2, p. 48-66, 2018.
- GRANDIN, Felipe Rodrigues. A contribuição do jornalismo guiado por dados para a criação de valor nas organizações jornalísticas. Dissertação (Mestrado em Comunicação) Universidade do Estado do Rio de Janeiro, Centro de Educação e Humanidades, Faculdade de Comunicação Social. Rio de Janeiro, 2014.
- LAGE, Nilson. Estrutura da notícia. São Paulo: Ática, 1993.
- LINARES, César López .Com inteligência artificial, geojornalismo e jornalismo de dados, jornalistas contornam alguns dos perigos de cobrir a Amazônia. LatAm Journalism Review, 2022. Disponível em: LatAm Journalism Review.
- LOOSE, Eloisa Beling; GIRARDI, Ilza Maria Tourinho. O Jornalismo ambiental sob a ótica dos riscos climáticos. Revista do Programa de Pós-Graduação em Comunicação e Linguagens - Universidade Tuiuti do Paraná Curitiba, PR: UFPR, v. 22, n. 2, jul./dez. 2017, p. 154-172.
- MORINI, Francesca; ESCHENBACHER, A.; HARTMANN, J.; DÖRK, M. From Shock to Shift: Data Visualization for Constructive Climate Journalism. IEEE Transactions on Visualization and Computer Graphics, v. 30, n. 1, 2024, p. 1413-1423.
-
OPEN KNOWLEDGE BRASIL.Um ecossistema de dados na Amazônia: investigações preliminares: mudanças climáticas, proteção territorial, desigualdades São Paulo: Open Knowledge Brasil, 2023. Disponível em: https://ok.org.br/wp-content/uploads/2023/04/Ebook_EcossistemaDeDados.pdf
» https://ok.org.br/wp-content/uploads/2023/04/Ebook_EcossistemaDeDados.pdf -
RYAN, Mimosa. The Role of Data Journalism in Covering Climate Change. Adriana Lacy Consulting Blog, 25 jul. 2024. Disponível em: https://blog.adrianalacyconsulting.com/data-journalism-covering-climate-change/ .
» https://blog.adrianalacyconsulting.com/data-journalism-covering-climate-change/ - SAMPAIO, Rafael Cardoso; LYCARIÃO, Diógenes. Análise de conteúdo categorial: manual de aplicação. Brasília: Enap, 2021.
- TRÄSEL, Marcelo. Jornalismo Guiado por Dados: características definidoras e uma proposta de formulação do conceito In: ENCONTRO NACIONAL DE PESQUISADORES EM JORNALISMO, 15°, 2017, São Paulo - SP: SBPJor – Associação Brasileira de Pesquisadores em Jornalismo, 1-16.
- TRÄSEL, Marcelo. O jornalismo guiado por dados numa perspectiva brasileira. In: GRAY, Jonathan; CHAMBERS, Lucy; BOUNEGRU, Liliana (Orgs.). Manual de jornalismo de dados: como os jornalistas podem usar dados para melhorar suas reportagens. São Paulo: Abraji/European Jornalismo Ambiental em bases de dados 36 Journalism Centre, 2013.
-
VELLO, Bruno; MORGADO, Renato Pellegrini; BEZERRA, Marcelo Hugo de Medeiros; SIQUEIRA, Leandro; SILVA, Julia Campos.O uso de dados abertos na prevenção, no monitoramento e no controle do desmatamento: relatório de pesquisa São Paulo: Imaflora, nov. 2020. Disponível em: <https://admin.imaflora.org/public/media/biblioteca/dados_abertos_desmatamento_final.pdf>.
» https://admin.imaflora.org/public/media/biblioteca/dados_abertos_desmatamento_final.pdf - LAGE, Nilson. Estrutura da Notícia 6ª ed. São Paulo: Ática, 2006.
- PICARD, Robert. Why Journalists Deserve Low Pay. Presentation to the Reuters Institute for the Study of Journalism, RISJ Seminar Series, University of Oxford, 6 de Maio, 2009.
-
BELMONTE, Roberto Villar. Uma breve história do jornalismo ambiental brasileiro. Revista Brasileira de História da Mídia, São Paulo, v. 6, n. 2, p.110-125, 2017. Disponível em: <http://www.ojs.ufpi.br/index.php/rbhm/article/view/6656>.
» http://www.ojs.ufpi.br/index.php/rbhm/article/view/6656

 Source: Prepared by the author
 Source: Elaborated by the author
 Source: