 Rational use of energy and photovoltaic generation: sustainable strategies for northern Brazil
Abstract
Abstract Concern about energy efficiency and renewable energy has emerged during the global energy crisis. This issue is particularly relevant in Roraima, a state in northern Brazil, due to its dependence on isolated electrical systems. Boa Vista, the capital, has high average annual temperatures and the country's highest average residential electricity consumption, which creates an opportunity for sustainable solutions. Given the abundant availability of solar radiation in the region, photovoltaic energy has emerged as a promising alternative for meeting energy demands sustainably and economically. In this work, case studies in three homes and on a university campus in Boa Vista made it possible to analyze the energy infrastructure and challenges and propose solutions to increase energy efficiency in the state and the region. The novelty of this work lies in integrating academic perceptions about energy efficiency and photovoltaics with practical initiatives implemented on campus. The study contributes to the theoretical-scientific discourse by exploring innovative strategies to increase energy efficiency and the use of photovoltaics, helping to advance the state of the art in this field. The managerial-applied contribution guides authorities in formulating policies for technological development and the rational use of energy.
Keywords:
Energy efficiency; Distributed photovoltaic generation; Photovoltaic energy; Sustainable energy supply
Resumo
Resumo A preocupação com a eficiência energética e a energia renovável ganhou destaque durante a crise energética global. Isso é particularmente relevante em Roraima, um estado no norte do Brasil, devido à sua dependência de sistemas elétricos isolados. Boa Vista, a capital, tem altas temperaturas médias anuais e o maior consumo médio de eletricidade residencial do país, o que cria uma oportunidade para soluções sustentáveis. Dada a abundante disponibilidade de radiação solar na região, a energia fotovoltaica surgiu como uma alternativa promissora para atender às demandas de energia de forma sustentável e econômica. Neste trabalho, estudos de caso realizados em três residências e em um campus universitário de Boa Vista permitiram analisar a infraestrutura e os desafios energéticos e propor soluções para aumentar a eficiência energética no estado e na região. A novidade deste trabalho está na integração das percepções acadêmicas sobre eficiência energética e energia fotovoltaica com iniciativas práticas implementadas no campus. O estudo contribui para o discurso teórico-científico ao explorar estratégias inovadoras para aumentar a eficiência energética e o uso de energia fotovoltaica, ajudando a avançar o estado da arte nesse campo. A contribuição gerencial aplicada fornece orientação às autoridades na formulação de políticas para o desenvolvimento tecnológico e o uso racional de energia.
Palavras-chave:
Eficiência energética; Geração fotovoltaica distribuída; Energia fotovoltaica; Fornecimento de energia sustentável
1 Introduction
Contemporary society is increasingly aware of the need to adopt practices that promote rational and sustainable electricity usage. This imperative arises from the urgency of mitigating the impacts of the greenhouse effect and preserving the planet's natural resources (Sun et al., 2019). The rational use of energy has two crucial dimensions: reducing costs and minimizing environmental damage. These dimensions involve a holistic approach encompassing energy conservation, efficiency, and effective management. Energy conservation is linked to consumption habits and patterns and the use and consumption framework, including ownership, operation, and equipment maintenance. Efficiency refers to the relationship between the output and input of energy in a system or piece of equipment. Generally, improving this efficiency involves replacing or modifying equipment and processes to achieve the same result with lower energy consumption. In fact, among the various factors that can increase electricity costs are the use of obsolete machinery and high tariffs at certain times (Menezes et al., 2024). Finally, energy management goes beyond behavioral, organizational, and technological approaches in promoting the rational use of energy since its administration demands continuous conservation and efficiency efforts (Filippo, 2018). These measures together improve energy performance and contribute to increasing energy efficiency (EE), which implies reducing energy consumption to achieve the desired result (Martins et al., 2022).
In many developing nations, the high electricity consumption and cost in private buildings and public institutions are urgent concerns (Opoku et al., 2020). Despite this, Brazil still invests less in EE than other countries (ACEEE, 2022). However, the country has great potential to improve EE during its continued economic growth through policies targeting the residential, industrial, and transportation sectors (Brasil, 2018a; EPE, 2024). The state of Roraima, located in the far north of Brazil, operates an isolated electricity system, being the only state not integrated into the National Interconnected System (SIN), a sizeable hydrothermal system for producing and transmitting electricity in the country. Currently, the generation in the SIN goes beyond hydrothermal systems and includes wind and solar power. As a result, Roraima faces significant energy supply challenges, justifying the importance of studying this issue. In this state, energy consumption is highly concentrated in the residential sector (51.1%), followed by the commercial sector (22.2%), the public sector (10.8%), and the public service sector (3.0%), the rest being distributed among other sectors. In 2022, Roraima's residential sector's average monthly electricity consumption was 295 kWh, while the national average was 173 kWh/month. Despite the 2.4% reduction compared to the previous year, Roraima has the highest average residential consumption of any state in the country. By comparison, the state of São Paulo recorded an average residential consumption of 188 kWh/month in the same year (EPE, 2024).
In Boa Vista, homes, businesses, services, and public institutions depend on electricity mainly for lighting, operating industrial machinery and equipment, refrigeration and air conditioning systems, and other essential activities. Implementing strategies at all local community levels to promote efficient energy use and overcome regional supply challenges is necessary. One strategy is generating renewable energy through distributed photovoltaic micro- and mini-generation. The rational use of energy, combined with distributed photovoltaic generation (DPVG) and effective energy management, can mitigate supply problems and prevent disturbances in the electricity grid. In this context, the implementation of DPVG in Roraima is justified by its many benefits, including postponing investments in transmission and distribution network expansion, reducing technical losses, and diversifying the energy matrix. Moreover, DPVG leverages the region's abundant solar irradiation, which averages 4.9 kWh/m2 per day (CRESESB, 2018).
The literature analysis on EE and DPVG revealed the research of some authors in this field of study. Opoku et al. (2020) conducted a case study on sustainable EE and solar energy measures to reduce electricity costs in public higher education institutions in Kumasi, Ghana. The results showed a significant electricity savings opportunity of 163,400 kWh/month, or approximately 5%, with renovations to the administrative buildings' air-conditioning units, lighting systems, and fans. Almushaikah & Almasri (2021) investigated various EE measures and the prospects for solar energy for the residential sector in central Saudi Arabia. The results indicated that applying thermal insulation to walls, roofs, and windows should be prioritized to promote energy conservation. These measures reduced energy consumption by approximately 27% for walls, 14% for roofs, and 6% for windows. Grande-Acosta & Islas-Samperio (2020) analyzed four solar energy options across the residential, commercial, and public sectors. Their findings indicate that, by 2030, the proposed mitigation measures could reduce greenhouse gas emissions by 23.5 million tons of carbon dioxide equivalent (MtCO2e) compared to the projected emissions trend. The reductions are distributed as follows: 19 MtCO2e in the residential sector, 2.6 MtCO2e in the commercial sector, and 1.9 MtCO2e in public services. Hafaifa et al. (2020) developed a mechanism to optimize the use of photovoltaic panels in power generation. Due to the non-linear nature of the panels' energy production, which varies according to light intensity and temperature, the proposed mechanism uses a fuzzy control of the photovoltaic system and an algorithm to search for the optimum power point, allowing maximum energy to be extracted from the panels. Li et al. (2021) proposed a method for evaluating the EE of photovoltaic systems using hierarchical analysis and fuzzy evaluation. It analyzes the factors that influence system efficiency and establishes an evaluation system with three categories: static index, dynamic index, and loss index. Hierarchical analysis determines the weight of each index, and fuzzy calculation defines the level of energy efficiency. Validation was carried out using a photovoltaic station in northwest China, showing that the method objectively reflects the actual efficiency of the system, serving as a reference for similar evaluations.
These studies provide a crucial contribution to the study. However, Popkova & Sergi (2021) highlight a research gap in developing energy EE management strategies, especially in developing countries. Al-Shahri et al. (2021) reinforce this need and stress the importance of further exploring solutions for the transition to renewable energy, such as photovoltaics (PV). They point out that there is still a gap in creating optimal designs for hybrid power generation systems, and more research is needed to validate models using different load profiles. Therefore, the research question that motivated this work is: How can Roraima's energy performance, particularly in Boa Vista, be improved to optimize energy consumption, achieve cost savings, and promote sustainable alternatives in the far north of Brazil? This study addresses the research question by proposing solutions to improve energy efficiency in Roraima based on case studies conducted in private homes and on a university campus in Boa Vista.
Following this introduction, Section 2 briefly overviews the theories on EE and DPVG and examines energy consumption in Roraima. Section 3 outlines the research method. Section 4 presents and discusses the case studies. Section 5 details the proposed solutions. Section 6 concludes the work, addressing the contributions, implications, and indications for future research. Finally, the references are listed at the end of the manuscript.
2 Theoretical framework
2.1 Energy efficiency and photovoltaic power generation
The quest for EE and DPVG is an environmental imperative and a catalyst for technological innovation and sustainable development. Countries that excel in this endeavor mitigate the adverse impacts of climate change and position themselves as leaders in the research and implementation of advanced energy solutions. Hartwig et al. (2017) consider EE one of the fastest and most cost-effective contributions to a sustainable, secure, and affordable energy system. They cite that the so-called non-energy benefits, co-benefits, or multiple benefits of EE are receiving increasing interest from policymakers and the scientific community. In response to concerns about pollution and global warming from electricity generation, photovoltaic sources have emerged as a leading alternative for producing clean energy (Ayub et al., 2014). The adoption of EE and DPVG aligns with the new world energy order philosophy. The Brazilian government aims to save 10% in final electricity consumption by 2030 through the National Energy Plan (Brasil, 2007). Addressing this challenge requires promoting the transition to cleaner and more sustainable energy sources, including solar, wind, and hydroelectric power. Incentives for research, development, and implementation of low-carbon technologies and effective climate policies are essential to reduce the carbon footprint associated with electricity generation globally. In this sense, ANEEL's Energy Efficiency Plan (EEP), launched in 1998, plays a crucial role since it aims to promote the efficient use of electricity, reduce waste, and involve various projects to optimize energy consumption in different sectors (Brasil, 2024b).
2.2 Characterization of energy consumption in the state of Roraima
The state of Roraima has peculiar characteristics regarding electricity distribution concessions, especially as it is the only concession electrically isolated from the SIN. Between 2001 and 2019, Roraima's primary energy source was Venezuela's Simón Bolívar hydroelectric plant, also known as Guri. With a capacity of 10,200 MW, it is one of the largest hydroelectric plants in the world (Brasil, 2018a). The considerable distance from the generating source and a drought that reduced Venezuela's generating capacity by 70% and led to energy rationing were crucial factors contributing to the precarious energy supply in Roraima. Two 60 MW thermoelectric plants were installed in Boa Vista in 2010 to reduce dependence on energy imports from Venezuela and avoid rationing.
In the latter half of 2013, the Brazil-Venezuela interconnection began experiencing more severe issues. Analysis revealed that the interconnector could only import 95 MW at the time. Increasing the thermoelectric generation to meet the excess demand was necessary, adding 129.1 MW to the existing 60 MW, resulting in 189.1 MW by 2015. Concurrently, the National Electric Energy Agency (ANEEL) authorized the early installation of a 35 MW static compensator at Eletronorte's 230 kV substation (now SE Boa Vista), initially intended for SIN interconnection. This initiative allowed for an additional 35 MW in the exchange with Venezuela, bringing the total to 130 MW. However, in March 2019, the energy transmission from Venezuela was abruptly halted due to political decisions. As an alternative, Roraima has since relied heavily on fuel-fired thermoelectric plants, an expensive and polluting source consuming between 700 and 1.1 billion liters of fuel daily (EDRR, 2019).
Roraima has historically relied on thermal generation. Until 2018, energy distribution was managed by Eletrobras Distribuição Roraima (EDRR). The concession then passed to Boa Vista Energia SA (BOVESA) and subsequently to the Oliveira Energia group with experience in Manaus. Currently, Roraima Energia holds the concession (Roraima Energia, 2023). Given the region's average daily global irradiation of 17.83 MJ/m2/day, implementing measures to enhance EE alongside DPVG systems is a viable solution to mitigate electricity shortages in Roraima. This approach would boost the adoption of solar energy, diversify the energy matrix, and promote renewable sources. Meanwhile, the government must regulate and plan the energy system to ensure viability and supply security with minimal social costs (Resende et al., 2018).
3 Research method
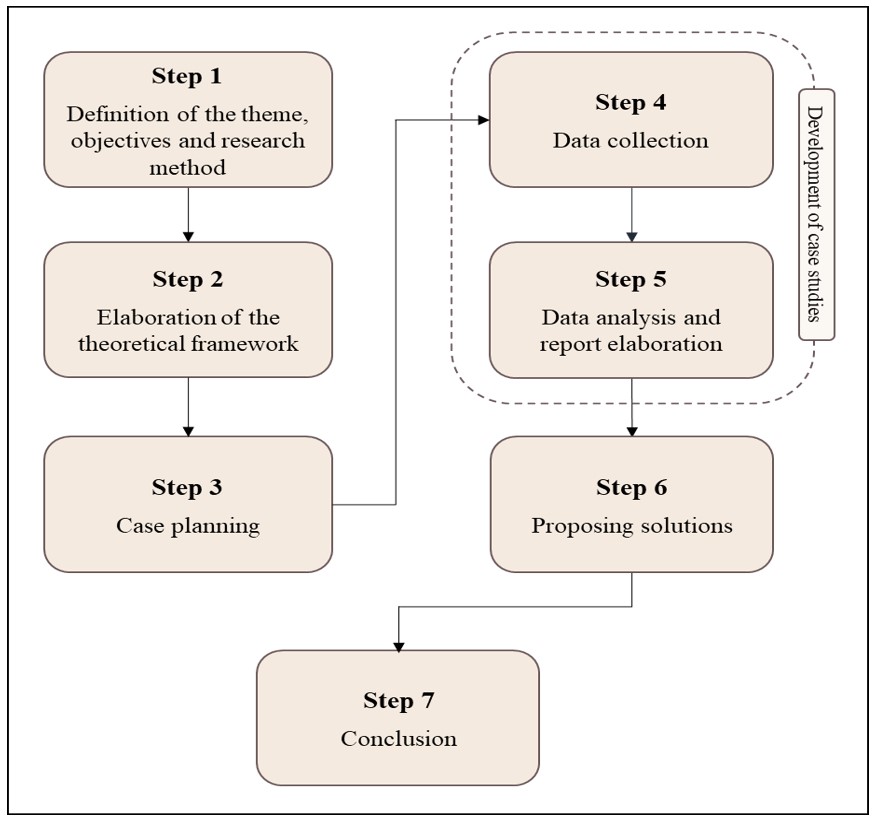
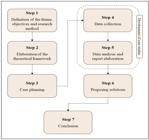
This study takes an empirical-normative approach, using observable data collection to analyze the energy infrastructure and efficiency challenges in buildings in Boa Vista, called units of consumption (UC). The aim is to understand their relationships and propose solutions, establish a benchmark for Roraima and the region, and legitimize specific issues and processes related to energy consumption. The study was based on case studies carried out in three private residences (UC1, UC2, and UC3) and at the Boa Vista University Center (CBV) (UC4) from 2014 to 2018. The seven steps involved in developing the work are illustrated in the flowchart in Figure 1 and presented in detail in the following subsections.
3.1 Step 1 – Definition of the theme, objectives, and research method
At this stage, the key elements of the work were established, including the definition of the topic, the research gap, the objectives, and the research method. The topic's potential was recognized given the opportunity to adopt the binomial "energy efficiency and renewable distributed generation" - a global trend to combat the effects of climate change - in a Brazilian federal unit with exceptionally high energy consumption and isolated energy infrastructure.
3.2 Step 2 – Elaboration of the theoretical framework
The research was based on analyzing the most relevant articles and reviews on EE and DPVG. Although the case study covers the period from 2014 to 2018, the literature search covered the period from 2019 to 2023 to obtain the state of the art on the subject. Initially, the search was carried out using the term "energy efficiency" in the title on the Scopus platform, resulting in 6,702 documents. A second search was then conducted using the term "distributed photovoltaic generation," which yielded 29 papers. Analysis of these 29 documents, together with the 30 most cited in the first search, provided insights that guided the findings and analysis of the case studies. Finally, the keywords "energy efficiency" and "distributed photovoltaic generation" and their respective variations were combined to establish the relationship between these two terms, which resulted in 27 additional documents. In addition, searches on government websites and official regulatory agencies assisted in characterizing energy consumption in Roraima.
3.3 Step 3 – Case planning
Energy demand in residential units mainly concentrates on electricity needs for lighting, air conditioning, fridges, freezers, and household appliances. In the case of the campus, there is also a demand for electricity for the external lighting of its facilities, such as the courtyard, sports courts, and parking lot. Table 1 describes the objects of study used in this research.
In November 2017, the first DPVG was installed in a public sector building in Roraima at the CBV, with funding from ANEEL through EE programs. The DPVG has an installed capacity of 66 kWp and is located at the geographical coordinates 2°48'49" N and 60°41'38" W, identified by the code GD.RR.000.023.271. This facility was considered for analysis in this study. During the six months following its implementation, data was collected through low-voltage electrical measurements (127/220V) at the photovoltaic power generation point.
3.4 Step 4 – Data collection
Initially, the researchers contacted the companies and individuals involved, including the Federal Institute of Education, Science and Technology of Roraima (IFRR), Eletrobras Distribuição Roraima (EDRR), and the owners of the three residences in Boa Vista. UCs' and CBV's energy bills provided energy consumption records. Fronius Solar, a Canadian solar energy management company, provided the data on photovoltaic energy production and consumption in the CBV. The company's website shows the balance of energy generated and consumed in real-time and daily data archives (Fronius Solar, 2018). Measurements taken at the CBV supply point provided the EDRR data. The researchers collected data through continuous measurement at the campus delivery point over a typical period and by surveying internal and external lighting and air conditioning loads. Additionally, they gathered data on energy production at the DPVG source located at the CBV and on the historical temperature record of Roraima and its capital, Boa Vista.
Data collection involved the following items: (a) average monthly temperatures in the city of Boa Vista over 48 months; (b) electricity consumption data over twelve months in UC1, UC2, and UC3; (c) electricity consumption data over 48 months at UC4, and (d) six months of photovoltaic energy production and consumption data at the UC4.
3.5 Step 5 – Data analysis and report elaboration
Data processing prioritized only those essential to the research objectives. Data analysis for each case followed the four phases described below.
-
Phase 1: Develop a detailed description of each specific case, considering multiple sources of evidence.
-
Phase 2: Summary of the data obtained in each survey, including only the essential information and closely linked to the research objectives.
-
Phase 3: Construction of a demonstration panel for each case, providing a comprehensive and detailed view of the data and facilitating the drawing of valid conclusions related to the research.
-
Phase 4: Assessing the technical and economic feasibility of the CBV's DPVG source.
All the activities from the previous stages were summarized in a report to ensure the reliability and validity of the study. Table 2 summarizes the activities carried out.
3.6 Step 6 – Proposing solutions
Considering the results obtained through data collection, specific actions were proposed to optimize the use of energy resources, implement more efficient technologies, and encourage sustainable practices in the region, including adopting photovoltaics. These measures aim to contribute to a more resilient and environmentally conscious future.
3.7 Step 7 – Conclusion
Finally, the conclusions emphasized the research question's answer and the established objectives' fulfillment. In addition, the authors highlight this work's theoretical-scientific and managerial-applied contributions and suggestions for future studies.
4 Presentation and discussion of the case studies
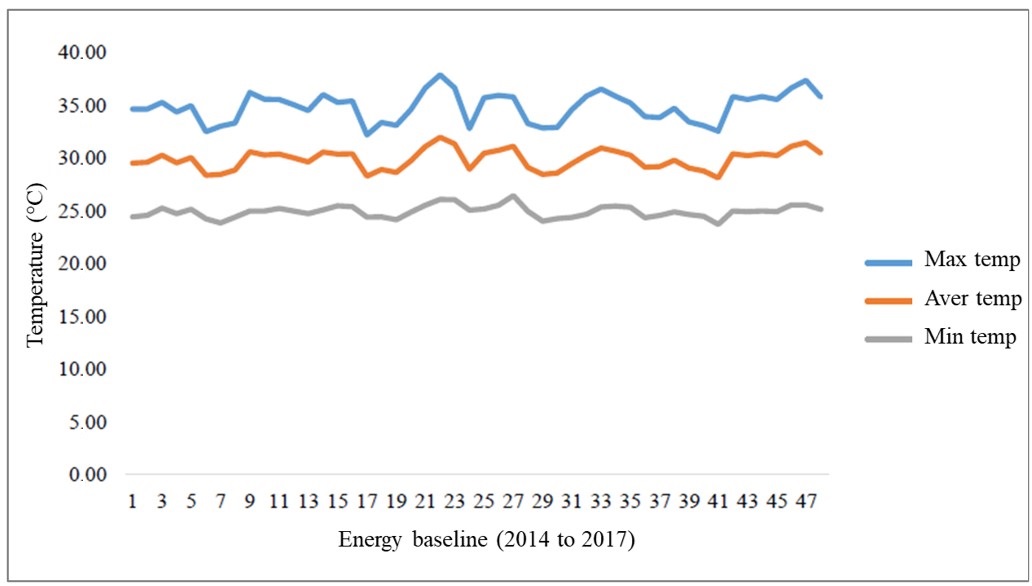
The case studies were conducted in Boa Vista, Roraima, the state capital, which historically records some of the highest average annual temperatures among Brazilian capitals (INMET, 2018). Its hot, tropical climate drives significant demand for refrigeration and air conditioning in residential and commercial settings. The temperature history enables us to establish a possible correlation between ambient temperature and energy consumption and demand in the city. The highest average monthly temperature recorded during the period studied was 31.94 °C, and the lowest was 28.10 °C. The highest maximum was 37.83 °C, and the lowest was 23.69 °C. It is worth noting that the range of temperature variations in the city over the 48 months is minimal and tends to be constant, as illustrated by the graph in Figure 2.
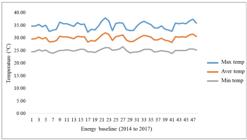
Oscillation of Maximum temperature (Max temp), Average temperature (Aver temp), and Minimum temperature (Min temp) in Boa Vista. Source: INMET (2018).
The case studies examined energy consumption in three private residences, UC1, UC2, and UC3, as well as in the CBV, designated as UC4. The following subsections present the data collected (4.1) and its analysis (4.2), which are crucial steps before proposing solutions to the EE challenges in Roraima.
4.1 Data collection at consumer units and the DPVG source
In case studies, the specific information collected can come from two or more sources of evidence, converging on the same findings (Yin, 2018). In this work, the data collected is quantitative and is associated with direct observation, archival records, and documentation.
4.1.1 Energy situation in the residential sector
Table 3 summarizes the primary information gathered about the three UCs.
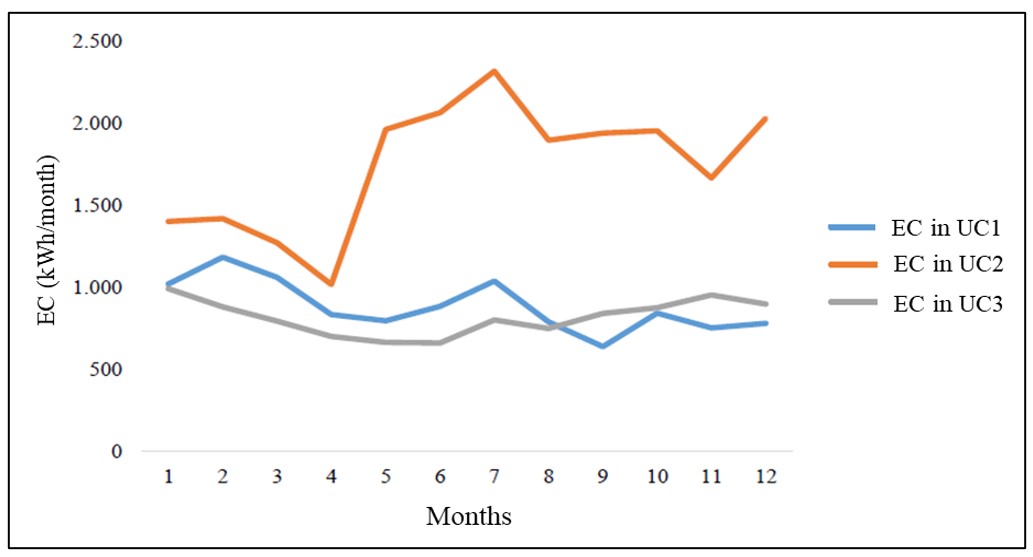
The installed power (Pinst) of UC2 is higher than that of UC1, which has a higher Pinst than UC3. UC2's Pinst is 60.5% higher than UC1's Pinst. The electrical power (EP) allocated to the cooling loads in UC1 is 5.4 kW (50.8%), while in UC2, it is 7.9 kW (37.7%). In UC3, the smallest Pinst is used by around 55.8%, corresponding to 3 kW, for refrigeration loads. Consumption is due to refrigeration machines, such as air conditioners, refrigerators, and freezers, which are essential for thermal comfort and food preservation. Figure 3 shows households' electricity consumption (EC) ratio over 12 months, from October 2017 to September 2018.

Considering the data provided, although UC2 has a larger Pinst than UC3, the latter uses more equipment simultaneously. Hence, UC3 often operates multiple devices simultaneously, such as two air conditioners, which increases the load factor.
4.1.2 Characterization and general conditions of the energy supply at the CBV
The energy supply contract for the CBV stipulates a demand of 500 kW. It operates under the green tariff mode, classified as Public Power, implying a single tariff for power demand in R$/kW. This tariff consists of two parts: one for the peak period and another for the off-peak period, as established by ANEEL. The demand billed to the CBV includes refrigeration machines (split air conditioners, refrigerators, cold rooms), discharge lamps (fluorescent, mixed, mercury vapor, and sodium vapor), and low-power LED lamps. Various other loads present in the laboratories are also considered, such as low-power induction and synchronous motors, motor pumps, automation systems, computers, and printers. According to Table 4, over 48 months, average annual off-peak consumption (OPC) was around 1,288,000 kWh, while average yearly on-peak consumption (PC) was around 129,000 kWh. At the beginning of 2014, the meter did not register energy consumption, leading to many units receiving fixed charges.
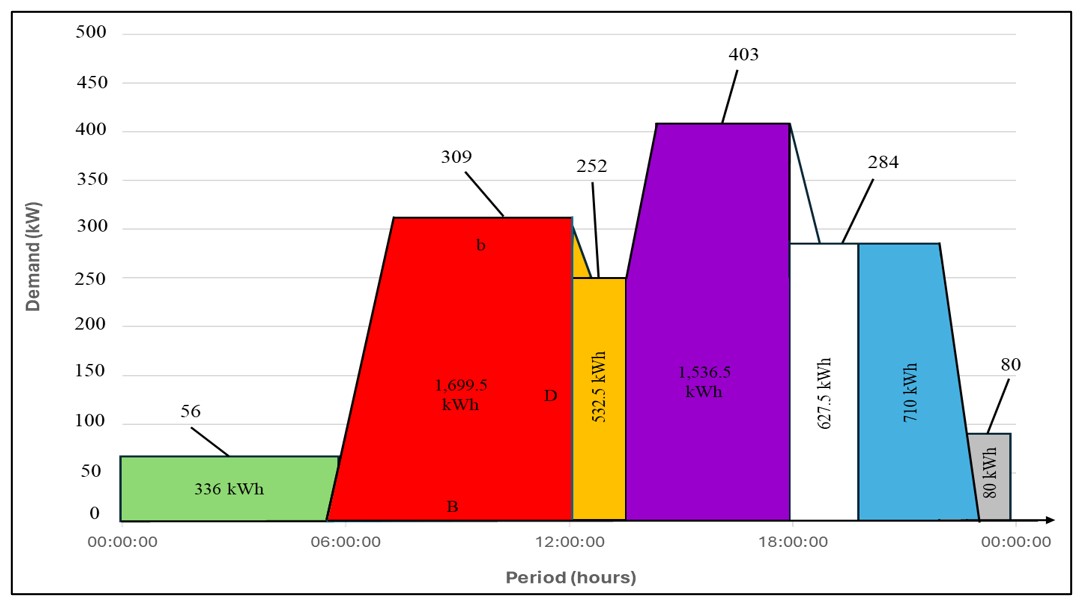
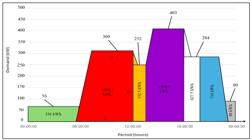
In addition to this consumption history, measurements were taken at the CBV by the EDRR's technical team, totaling 144 hours (six consecutive days), collecting data every minute. The average power of the installation recorded during the period was around 202.44 kW. The highest power recorded was 488.44 kW in the afternoon, while the lowest was 48.26 kW in the early morning.
Most facilities do not operate on a 24/7 basis. Operations are discontinuous: many do not operate on Sundays and public holidays, and others do not at night or early morning (Filippo, 2018). A CBV's energy consumption profile graph shows the average power use in kW during each period (dawn, morning, afternoon, and night). For example, the campus' average power usage at dawn is 56 kW over 6 hours. The average power multiplied by the use time provides the kWh consumption. The areas indicated in green, red, orange, purple, white, blue, and grey in Figure 4 represent the segmented consumption in kWh of the CBV. Adding these areas together determines the average daily consumption.
ANEEL determines that the installed power is the sum of the nominal powers of the electrical equipment installed in a condition to start operating, expressed in kW. The survey of these loads is essential for knowing the amount of energy at all the consumption points in an installation and is primary for determining the type of supply for a UC. In this case, the load survey sought to identify the Pinst for the CBV's external and internal lighting and the electrical power for the air-conditioning load. Table 5 shows the data for these loads installed in UC4. Other loads, including refrigeration, were not measured.
The CBV has a conditioned area of around 9,574 m2, representing approximately 34.81% of the unit's total covered area of 27,500 m2. Based on the total refrigeration power and the conditioned area, the organization's refrigeration power per square meter is approximately 0.074 TR/m2.
4.1.3 Data collection at the CBV's DPVG
The CBV's photovoltaic energy system comprises 270 photovoltaic modules, each rated at 265 Wp/12 V, with dimensions of 1,638 x 982 x 40 mm and a weight of 18 kg. The system includes five electronic inverters, one for each string of 54 modules, capable of generating a direct current voltage of up to 648 V and providing a power output of up to 14.31 kWp (kilowatt-peak), depending on solar radiation. Monitored in real-time via the Fronius Solar website, the system's total capacity is 66 kWp during peak sunshine. The roof area is 1,042 m2, with the modules covering 434.7 m2.
Photovoltaic (PV) energy production amounted to 60,395 kWh, while billed electricity consumption (billed CEE) was 900,687 kWh, as shown in Table 6. This data indicates that the CBV's DPVG produced energy equivalent to 6.7% of the billed CEE during the period analyzed, thus impacting the CBV's monthly electricity bill. This impact was most significant in October when photovoltaic energy production amounted to approximately 9,334 kWh, corresponding to 15.46% of PV energy production.
4.2 Data analysis
This section analyzes the data collected to support the proposals for solving the problems identified.
4.2.1 Energy performance in the residential sector
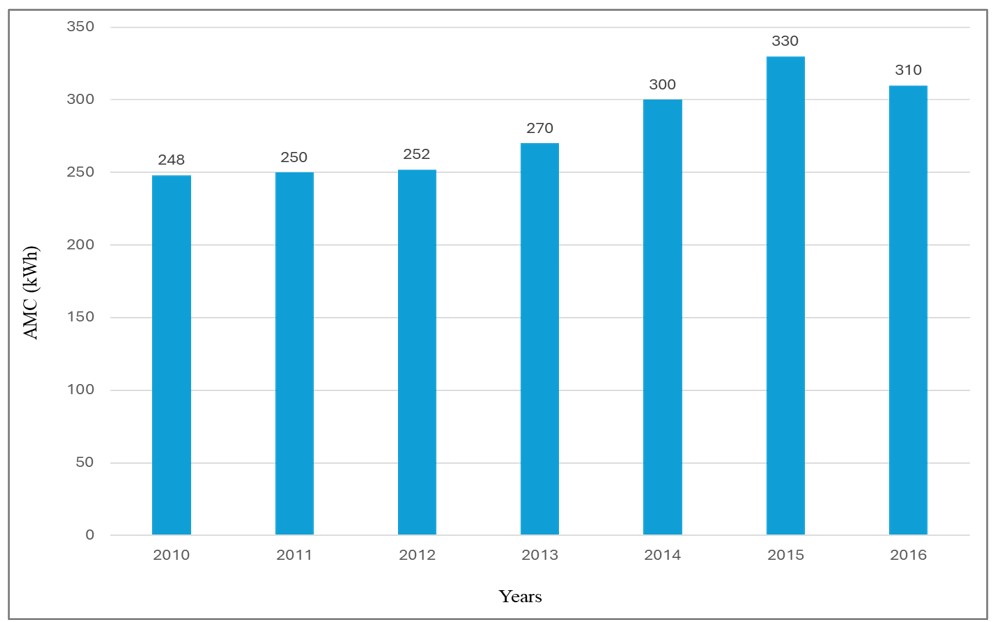
The data in Table 7 refers to the residences UC1, UC2, and UC3, all operating at a voltage level of 127/220 V. UC1 had an average monthly consumption (AMC) of 886 kWh, exceeding by 2.9 times the average residential consumption (ARC) of Roraima in 2017, which was 306 kWh/month, as recorded in the Electricity Statistical Yearbook (Brasil, 2018b, p. 181). UC2 recorded an AMC of 1,744 kWh, exceeding the ARC by 5.7 times, while UC3 recorded an AMC of 818 kWh, 2.7 times more than the estimated ARC. The data collection period for these residences was from October 2017 to September 2018.
The load for refrigeration machines in UC2 is 7.9 kW, while in UC1, it is 5.4 kW, and in UC3, only 3.0 kW. Electricity consumption in Boa Vista's residential sector is mainly concerned with lighting and refrigeration machines. In Figure 5, the increase in AMC reveals the intense energy use, probably due to the overuse of air conditioners, refrigerators, and freezers.

Residential solar photovoltaic systems contribute significantly to the total share of energy. Developed countries, such as Germany, have created incentive regulations to expand the use of solar systems on buildings. Germany, which pioneered the implementation of feed-in tariffs in the 1990s, established a large base of residential solar systems. This concept was adopted by countries such as the UK, USA, Spain, Italy, and Japan, rapidly expanding their photovoltaic markets (Imam et al., 2019). Residential energy consumption is directly related to average household income per capita, reflecting a higher standard of living and ownership of household appliances and other energy-consuming devices. In Roraima, surprisingly, the average household income "per capita" is the highest in the North region despite Brazil having the lowest Gross Domestic Product (GDP). However, energy consumption is also affected by the average temperature, and the hotter or colder it is, the higher the consumption for general comfort. For example, Boa Vista has the region's highest average temperature, around 30 °C, although many cities in the North and Northeast also have similarly high temperatures (Filippo, 2018).
4.2.2 Energy performance in the CBV (UC4)
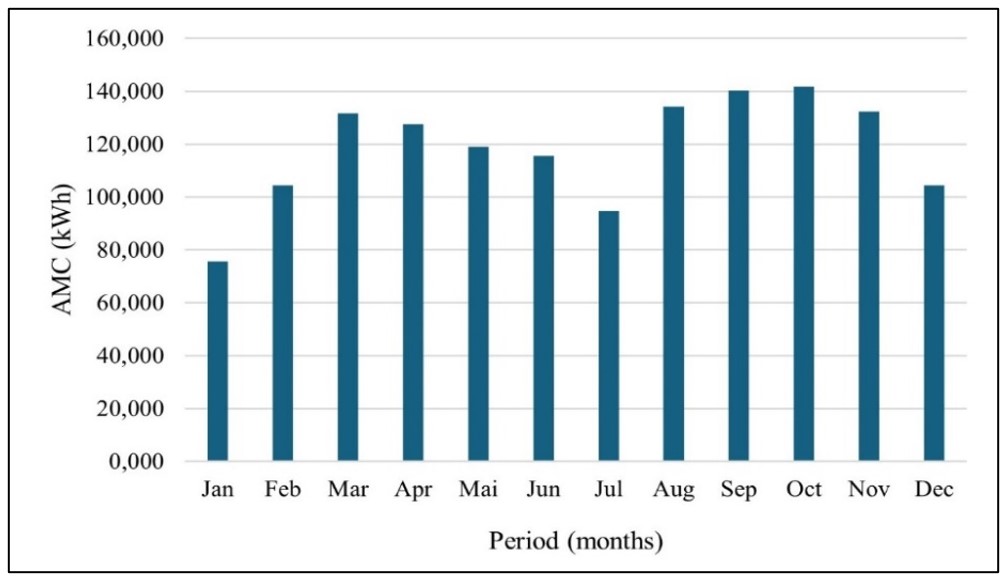
Analysis of the CBV's energy performance reveals consumption patterns over the years. Table 8 shows CBV's energy AMC over two periods (four years and three years) for Peak Consumption (PC) and Off-Peak Consumption (OPC) from January to December.
AMC remains practically constant in both situations, at around 118,000 kWh. The lowest consumption occurs in January (around 75,700 kWh), July (around 94,700 kWh), and December (around 104,000 kWh) due to the lower use of loads during recess periods. Figure 6 shows the CBV's AMC over a year, considering the average between columns 3 and 5 of Table 8. There is a seasonal variation in January, July, and December, possibly due to the school calendar and the vacation and recess periods that occur in these months (Filippo, 2016).
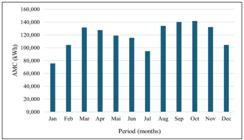
CBV's Average Monthly Consumption (AMC) from 2014 to 2017. Source: Adapted from Filippo (2016).
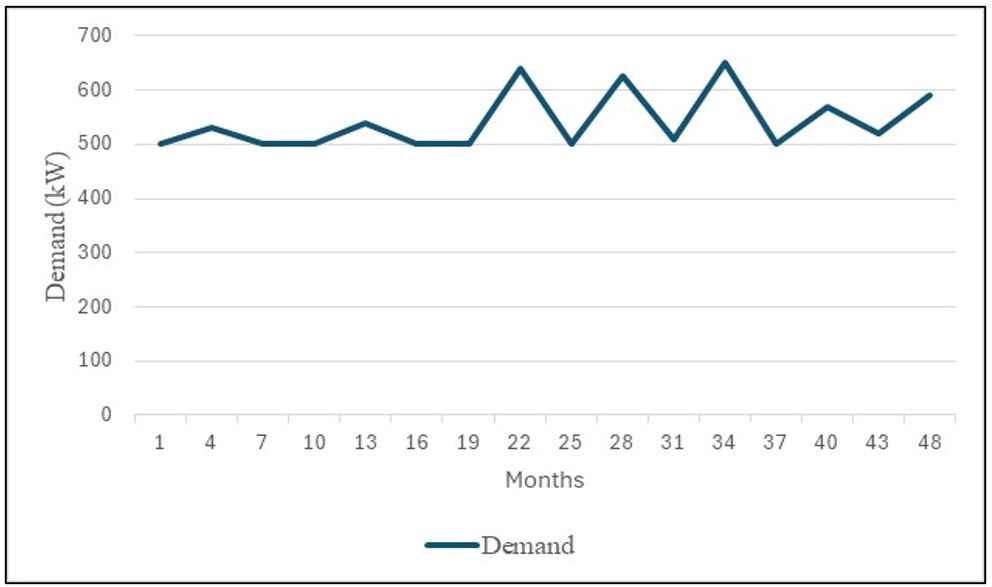
The CBV's energy supply contract stipulates a demand of 500 kW, which exceeds over 50% of the analyzed months. This data indicates intensive and simultaneous use of installed loads, contributing to excessive energy consumption. Figure 7 shows the graph of the demands measured at the CBV over the 48 months. It shows a pattern of demand oscillating around 500 kW. Consequently, demand at the CBV is consistently high, at or above 500 kW, which may be related to the non-rational use of energy.
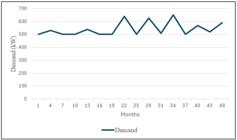
Measured CBV demand over the 48 months (2014 to 2017). Source: Adapted from Filippo (2016).
There are situations in which the level of operation of machines, motors, and equipment depends on factors other than production. For example, in refrigeration and air-conditioning systems, the cooling load can vary markedly depending on the ambient temperature, impacting the energy performance indicator (EPI). In other words, the installation's consumption relates directly to seasonal factors, but it is unclear whether these factors are influenced solely by the calendar, climatic conditions, or both (Filippo, 2018).
4.2.3 Economic feasibility analysis of photovoltaic generation at CBV
The technical and economic feasibility of a 66 kWp DPVG source connected to the local grid, installed at CBV in June 2017 for R$900,000, is evaluated. The financial analysis includes cash flow, payback period, and discounted payback, considering kWh production, savings in reais, minimum attractive rate, internal rate of return, profitability index, and kWh value. Table 9 displays the monthly savings for the six months following the DPVG implementation.
The measurements showed that DPVG produced a total of 49,911 kWh during the analyzed period, resulting in an average of 8,319 kWh, with an average monthly efficiency of 12.5%. The efficiency of a photovoltaic energy source depends on several factors, such as local temperature, which in Boa Vista is around 30 °C, and average irradiation, which in the northern region is 5.5 kWh/m2/day. The average monthly value is 4.89 kWh/m2/day in the horizontal plane (CRESESB, 2018). The payback calculation considered the costs of the materials needed to install and operate a photovoltaic plant like the one installed at the CBV. Unlike technologies that use rotating motion to convert energy, a PV system does not have significant operating costs. However, there are minimal maintenance costs, such as periodic cleaning of the PV modules to remove accumulated dust (Imam et al., 2019).
The payback calculation directly relies on the cash flow presented in Table 9, which was planned based on the energy production of the CBV's photovoltaic source and the reality of Roraima's solar energy potential. Table 10 shows the results of the simple payback, discounted payback, Net Present Value (NPV), profitability index, and internal rate of return (IRR) for each simulated project (P1, P2, and P3). Projects P1 and P2 are unviable due to their negative NPV, while project P3 is viable, with a positive NPV and an IRR higher than the minimum rate of attractiveness. The simple payback indicates a payback time of 11 years, 4 months, and 10 days, while the discounted payback shows a payback time of 35 years, 1 month, and 5 days.
So, the return on investment will be achieved in 11 years, 4 months, and 10 days, considering the average value of kWh, which in November 2018 had an average annual readjustment of 38.5% (ANEEL, 2018). R$0.7919 per kWh, excluding taxes, was used for simple and discounted payback calculations.
The technical and economic feasibility analysis of a DPVG source installed at CBV, based on 2014–2018 data, reflects market conditions that have changed significantly. Photovoltaic equipment costs have dropped due to technological advancements, the global expansion of solar energy, and evolving public policies and incentives in the renewable energy sector (Zhang et al., 2021). In 2023, the levelized cost of electricity decreased for nearly all energy generation types, except bioenergy and geothermal, with solar photovoltaics— the most widely deployed technology— experiencing the most significant global decline, a 12% drop from 2022. This increasing competitiveness is crucial for tripling sustainable energy capacity by 2030, a key milestone at COP28 to support energy transition objectives and limit global warming to 1.5°C. In 2023, 382 GW of renewable generation capacity—81% of the worldwide increase—produced electricity at costs lower than the cheapest new fossil fuel plants (IRENA, 2024).
These updates are relevant for evaluating the payback of the photovoltaic installation at the CBV in Roraima, considering the current scenario in Brazil. The decline in global equipment costs and the advancement of public policies in the national energy sector can significantly shorten the payback period in the Brazilian context, particularly in regions with high solar incidence, such as Roraima. Changes in energy tariffs, tax incentives, and financing policies for photovoltaic energy also enhance the project's viability, introducing measures not fully available between 2014 and 2018. Since then, solar energy has significantly driven Brazil's clean generation growth. By October 2024, solar installations reached 5,258 MW, representing 57.8% of all new centralized generation capacity (Brasil, 2024a). Compared to the study's initial scenario, current market conditions and public policies make investing in photovoltaic energy an even more economically viable and environmentally sustainable choice.
5 Proposed solutions for energy improvement in Roraima
EE is fundamental to sustainable development and reducing environmental impact. In this context, ANEEL's Energy Efficiency Program (EEP) encourages developing and adopting technologies that increase energy efficiency, benefiting consumers and the electricity sector. Although many EEP initiatives have already been successful, it is essential to adapt the energy generation system to regional particularities, prioritizing clean and economically viable solutions (Brasil, 2024b). Therefore, within the scope of this study, Table 11 presents possible solutions for improving energy use in the state of Roraima, with a view to its evolution in terms of EE and DPVG.
Initially, it is crucial to standardize the energy systems of homes and public buildings according to INMETRO standards (these standards consider architectural aspects - the envelopes - to improve thermal comfort). In addition, adjustments need to be made to reduce technical losses and ensure that the systems meet the standards regulated by ANEEL. Making these adjustments enables the implementation of improvements in electrical systems to ensure their optimal performance over time. Supervision of the DPVG installation is crucial to avoid thermal losses between the panels, which optimizes energy storage. After implementing the photovoltaic panels, it is essential to guarantee the system's stability, primarily through batteries that can counteract the effects of variations in insolation on the voltage of the photovoltaic source. To date, these batteries have mainly served isolated systems. However, considering the experiences in small communities in the Amazon region and the various implementations in larger-scale systems, it would be pertinent to consider implementing a storage system for part of Boa Vista. Finally, it is essential to educate consumers on the correct use of equipment, encourage the replacement of low-quality or obsolete models, and promote energy efficiency practices. These measures include adopting energy-saving light bulbs, using air conditioners efficiently, and performing regular maintenance on refrigerators and freezers to minimize heat loss. Identifying energy-consuming processes is necessary for optimization (Nabati et al., 2022). In addition, public policies aimed at saving energy are also important.
6 Conclusion
The search for sustainable and practical solutions to meet the energy demands of remote regions, such as the state of Roraima, is a growing priority in the global effort to combat climate change and promote sustainable development. This paper proposes actions to improve energy efficiency in Roraima based on four case studies conducted in three private homes and the CBV. This work fills a gap in the existing literature and answers the research question of ways to improve Roraima's energy performance by promoting sustainable alternatives. The results balance consumption, reduce costs, and promote sustainability. Data analysis revealed problems such as poor electricity quality, inadequate consumption patterns, and outdated equipment that does not meet regulatory standards. Furthermore, installing a DPVG energy source at the CBV has shown that combining energy efficiency improvements with photovoltaic energy sources is an effective solution to mitigate the electricity shortage in Roraima, providing immediate and low-cost benefits.
The main theoretical-scientific contribution of this work is the deepening of knowledge about adopting measures to increase energy efficiency and promote photovoltaic energy generation in developing countries or regions. This contribution strengthens the basis for future discussions on reducing greenhouse gas emissions and advancing this field's state-of-the-art. In terms of managerial-applied contribution, this study creates an opportunity to seek sustainable energy supply solutions for northern Brazil. It also raises questions that can guide public authorities and the private sector on the socio-economic importance of energy efficiency in regions not connected to the SIN. In addition, the study highlights the opportunity to take advantage of the abundant local solar radiation to implement DPVG. Solar radiation is one of the primary sources of clean and renewable energy in the state of Roraima, and it has the potential to address the energy supply problem in various sectors in the short term.
The novelty of this work lies in the combination of academic knowledge about energy efficiency and photovoltaic energy generation with the good initiative developed at the CBV to implement a DPVG. If seen as an example by public authorities, this initiative could become part of an effective strategy aimed at technological development and promoting the rational use of energy in regions facing energy efficiency problems. Future studies could explore the energy consumption of industries and commercial organizations in states in the far north of Brazil. In addition, we suggest increasing public policies aimed at saving energy, especially in regions with high energy consumption derived from non-renewable sources.
Statement on Data Availability
The underlying contents of the research text are contained in the manuscript.
-
Financial support: This work received financial support from CNPq (Conselho Nacional de Desenvolvimento Científico e Tecnológico) [314918/2023-0], FAPESP (Fundação de Amparo à Pesquisa do Estado de São Paulo) [2023/16971-7], and CAPES [001] (Coordenação de Aperfeiçoamento de Pessoal de Nível Superior).
-
How to cite:
Nascimento Neto, M., Fernandes Filho, G. E. F., Muniz Junior, J., Rocha, A. B. T., & Oliveira, O. J. (2025). Rational use of energy and photovoltaic generation: sustainable strategies for northern Brazil. Gestão & Produção, 32, e9024. https://doi.org/10.1590/1806-9649-2025v32e9024
References
-
Agência Nacional de Energia Elétrica – ANEEL. (2018). Processo: 48500.004977/2018-29. Assunto: reajuste tarifário anual de 2018 da Boa Vista Energia S.A. (Eletrobras Distribuição Roraima), a vigorar a partir de 1º de novembro de 2018. Área Responsável: Superintendência de Gestão Tarifária – SGT (9 p.). Retrieved in 2019, June 1, from http://www2.aneel.gov.br/aplicacoes/noticias_area/arquivos/ata_40-rpo-2018.pdf
» http://www2.aneel.gov.br/aplicacoes/noticias_area/arquivos/ata_40-rpo-2018.pdf -
Almushaikah, A. R. S., & Almasri, R. A. (2021). Evaluating the potential energy savings of residential buildings and utilizing solar energy in the middle region of Saudi Arabia – Case study. Energy Exploration and Exploitation, 39(5), 1457-1490. http://doi.org/10.1177/0144598720975144
» http://doi.org/10.1177/0144598720975144 -
Al-Shahri, O. A., Ismail, F. B., Hannan, M. A., Lipu, M. S. H., Al-Shetwi, A. Q., Begum, R. A., Al-Muhsen, N. F. O., & Soujeri, E. (2021). Solar photovoltaic energy optimization methods, challenges and issues: A comprehensive review. Journal of Cleaner Production, 284, 125465. http://doi.org/10.1016/j.jclepro.2020.125465
» http://doi.org/10.1016/j.jclepro.2020.125465 -
American Council for an Energy-Efficient Economy – ACEEE. (2022). ACEEE'S 2022 International Energy Efficiency Scorecard. Retrieved in 2023, April 18, from https://www.aceee.org/international-scorecard
» https://www.aceee.org/international-scorecard -
Ayub, M., Gan, C. K., & Kadir, A. F. A. (2014). The impact of grid-connected PV systems on Harmonic Distortion. In 2014 IEEE Innovative Smart Grid Technologies - Asia (ISGT ASIA) (pp. 669-674). New York: IEEE. http://doi.org/10.1109/ISGT-Asia.2014.6873872
» http://doi.org/10.1109/ISGT-Asia.2014.6873872 -
Brasil. Ministério de Minas e Energia – MME. (2007). Plano nacional de energia 2030. Retrieved in 2019, March 16, from http://epe.gov.br/sites-pt/publicacoes-dados-abertos/publicacoes/PublicacoesAr-quivos/publicacao-165/topico-173/PNE 2030-Projeções.pdf
» http://epe.gov.br/sites-pt/publicacoes-dados-abertos/publicacoes/PublicacoesAr-quivos/publicacao-165/topico-173/PNE -
Brasil. Ministério de Minas e Energia – MME. (2018a). Planejamento do atendimento aos sistemas isolados: instruções complementares para elaboração e apresentação de propostas de solução de suprimento com vistas à participação no Leilão para suprimento à Boa Vista e localidades. Retrieved in 2023, September 20, from http://www2.aneel.gov.br/aplicacoes/editais_geracao/documentos/EPE-DEE-PT-085-2016-r0 (Grupo A Lote I - Coari - Versão Edital).pdf
» http://www2.aneel.gov.br/aplicacoes/editais_geracao/documentos/EPE-DEE-PT-085-2016-r0 -
Brasil. (2018b). Anuário Estatístico de Energia Elétrica 2018: ano base 2017. Consumo médio residencial por subsistema, região e UF (kWh/mês). Retrieved in 2018, April 23, from https://www.epe.gov.br/sites-pt/publicacoes-dados-abertos/publicacoes/PublicacoesArquivos/publicacao-160/topico-168/Anuario2018vf.pdf
» https://www.epe.gov.br/sites-pt/publicacoes-dados-abertos/publicacoes/PublicacoesArquivos/publicacao-160/topico-168/Anuario2018vf.pdf -
Brasil. Ministério de Minas e Energia – MME. (2024a). Expansão de 9,1 GW impulsiona matriz elétrica centralizada brasileira em 2024. Retrieved in 2024, November 12, from https://www.gov.br/mme/pt-br/assuntos/noticias/expansao-de-9-1-gw-impulsiona-matriz-eletrica-centralizada-brasileira-em-2024
» https://www.gov.br/mme/pt-br/assuntos/noticias/expansao-de-9-1-gw-impulsiona-matriz-eletrica-centralizada-brasileira-em-2024 -
Brasil. Ministério de Minas e Energia – MME. Agência Nacional de Energia Elétrica. (2024b). Programa de Eficiência Energética (PEE). Retrieved in 2024, May 29, from https://www.gov.br/aneel/pt-br/assuntos/programa-de-eficiencia-energetica
» https://www.gov.br/aneel/pt-br/assuntos/programa-de-eficiencia-energetica -
Centro de Referência para as Energias Solar e Eólica Sérgio de Salvo Brito – CRESESB. (2018). Potencial Energético (potencial solar - SunData v3.0): busca por coordenadas geográficas (Latitude: N e Longitude: O). Retrieved in 2023, September 23, from http://www.cresesb.cepel.br
» http://www.cresesb.cepel.br -
Menezes, L. F., Balbo, A. R., Cherri, A. C., Poltroniere, S. C., Ghidini, C. T. L. S., & Soler, E. M. (2024). Energy consumption optimization in a printing company. Gestão & Produção, 31, e1723. http://doi.org/10.1590/1806-9649-2024v31e1723
» http://doi.org/10.1590/1806-9649-2024v31e1723 -
Eletrobras Distribuição Roraima – EDRR. (2019). Faturas de energia elétrica do IFRR: Campus Boa Vista (60 p.). Agência Virtual da Roraima Energia. Retrieved in 2019, April 8, from http://ajuriweb.roraimaenergia.com.br/
» http://ajuriweb.roraimaenergia.com.br/ -
Empresa de Pesquisa Energética – EPE. (2024). Anuário estatístico de energia elétrica 2024 ano base 2023. Retrieved in 2024, April 30, from https://dashboard.epe.gov.br/apps/anuario-livro/
» https://dashboard.epe.gov.br/apps/anuario-livro/ -
Filippo, G. E. F., Fo. (2016). Gestão de energia em edifícios comerciais e de serviços. In Anais do XVI Encontro Nacional de Instalações Elétricas (ENIE) (9 p.). São Paulo: Aranda Editora. Retrieved in 2017, March 13, from http://www.arandaeventos.com.br/eventos2016/enie/congresso_programa.html
» http://www.arandaeventos.com.br/eventos2016/enie/congresso_programa.html - Filippo, G. E. F., Fo. (2018). Gestão da energia: fundamentos e aplicações (1st ed.). São Paulo: Érica.
-
Fronius Solar. (2018). Monitoramento online da produção e consumo de energia fotovoltaica distribuída na instalação elétrica do IFRR: Campus Boa Vista. Retrieved in 2018, July 3, from https://www.solarweb.com/PvSystems/Widgets
» https://www.solarweb.com/PvSystems/Widgets -
Google. Maps. (2018a). Residence UC1, located in Bioclimatic Zone 8, in Boa Vista-RR. Geographical coordinates (2°48'37" N and 60°41'51" O). Retrieved in 2018, September 3, from https://goo.gl/maps/EiyzkksAtu32
» https://goo.gl/maps/EiyzkksAtu32 -
Google. Maps. (2018b). Residence UC2, located in Bioclimatic Zone 8, in Boa Vista-RR. Geographical coordinates (2°51'43" N and 60o40'14" O). Retrieved in 2018, September 5, from https://goo.gl/maps/iWBXzT6rRX12
» https://goo.gl/maps/iWBXzT6rRX12 -
Google. Maps. (2018c). Residence UC3, located in Bioclimatic Zone 8, in Boa Vista-RR. Geographical coordinates (2°51'46" N and 60o39'53" O). Retrieved in 2018, September 9, from https://goo.gl/maps/cT9Pzb4vQUt
» https://goo.gl/maps/cT9Pzb4vQUt -
Google. Maps. (2018d). UC4, in Boa Vista-RR. Retrieved in 2018, September 9, from https://maps.app.goo.gl/6Be7dRNBSiNY4kyR9
» https://maps.app.goo.gl/6Be7dRNBSiNY4kyR9 -
Grande-Acosta, G. K., & Islas-Samperio, J. M. (2020). Boosting energy efficiency and solar energy inside the residential, commercial, and public services sectors in Mexico. Energies, 13(21), 5601. http://doi.org/10.3390/en13215601
» http://doi.org/10.3390/en13215601 -
Hafaifa, A., Imed, K., Guemana, M., & Salam, A. (2020). Maximum power point tracking of photovoltaic system based on fuzzy control to increase there solar energy efficiency. Learning and Analytics in Intelligent Systems, 7, 563-571. http://doi.org/10.1007/978-3-030-36778-7_62
» http://doi.org/10.1007/978-3-030-36778-7_62 -
Hartwig, J., Kockat, J., Schade, W., & Braungardt, S. (2017). The macroeconomic effects of ambitious energy efficiency policy in Germany - Combining bottom-up energy modelling with a non-equilibrium macroeconomic model. Energy, 124, 510-520. http://doi.org/10.1016/j.energy.2017.02.077
» http://doi.org/10.1016/j.energy.2017.02.077 -
Imam, A. A., Al-Turki, Y. A., & Sreerama Kumar, R. (2019). Techno-economic feasibility assessment of grid-connected PV systems for residential buildings in Saudi Arabia: a case study. Sustainability (Basel), 12(1), 262. http://doi.org/10.3390/su12010262
» http://doi.org/10.3390/su12010262 -
Instituto Nacional de Meteorologia – INMET. (2018). Monitoramento climático das estações e dados meteorológicos: temperaturas máxima, média e mínima mensais dos municípios brasileiros. Banco de Dados Meteorológicos para Ensino e Pesquisa. Retrieved in 2019, April 3, from http://www.inmet.gov.br/portal/index.php?r=bdmep/bdmep
» http://www.inmet.gov.br/portal/index.php?r=bdmep/bdmep -
International Renewable Energy Agency – IRENA. (2024). World Energy Transitions Outlook 2024: 1.5 °C Pathway. Abu Dhabi: IRENA. Retrieved in 2024, November 13, from https://www.irena.org/Publications/2024/Nov/World-Energy-Transitions-Outlook-2024
» https://www.irena.org/Publications/2024/Nov/World-Energy-Transitions-Outlook-2024 -
Li, W., Wang, D., Zhou, Q., & Dong, H. (2021). Energy efficiency evaluation of photovoltaic power generation system based on analytic hierarchy process and fuzzy comprehensive evaluation. In 5th IEEE Conference on Energy Internet and Energy System Integration: Energy Internet for Carbon Neutrality (pp. 1029-1034). New York: IEEE. http://doi.org/10.1109/EI252483.2021.9713643
» http://doi.org/10.1109/EI252483.2021.9713643 -
Martins, J. C., Morandi, M. I. W. M., Lacerda, D. P., & Andrade, B. P. B. (2022). Energy efficiency decision-making in non-energy intensive industries: Content and social network analysis. Production, 32. https://doi.org/10.1590/0103-6513.20210065.
» https://doi.org/10.1590/0103-6513.20210065 -
Nabati, E. G., Nieto, M. T. A., Bode, D., Schindler, T. F., Decker, A., & Thoben, K. D. (2022). Challenges of manufacturing for energy efficiency: towards a systematic approach through applications of machine learning. Production, 32. https://doi.org/10.1590/0103-6513.20210147.
» https://doi.org/10.1590/0103-6513.20210147 -
Opoku, R., Adjei, E. A., Ahadzie, D. K., & Agyarko, K. A. (2020). Energy efficiency, solar energy and cost saving opportunities in public tertiary institutions in developing countries: the case of KNUST, Ghana. Alexandria Engineering Journal, 59(1), 417-428. http://doi.org/10.1016/j.aej.2020.01.011
» http://doi.org/10.1016/j.aej.2020.01.011 -
Popkova, E. G., & Sergi, B. S. (2021). Energy efficiency in leading emerging and developed countries. Energy, 221, 119730. http://doi.org/10.1016/j.energy.2020.119730
» http://doi.org/10.1016/j.energy.2020.119730 -
Resende, L., Soares, M., & Ferreira, P. (2018). Electric power load in Brazil: View on the long-term forecasting models. Production, 28. https://doi.org/10.1590/0103-6513.170081.
» https://doi.org/10.1590/0103-6513.170081 -
Roraima Energia. (2023). Empresa: nossa história. Retrieved in 2024, May 27, from https://www.roraimaenergia.com.br/empresa/historico/
» https://www.roraimaenergia.com.br/empresa/historico/ -
Sun, H., Edziah, B. K., Sun, C., & Kporsu, A. K. (2019). Institutional quality, green innovation and energy efficiency. Energy Policy, 135, 111002. http://doi.org/10.1016/j.enpol.2019.111002
» http://doi.org/10.1016/j.enpol.2019.111002 - Yin, R. K. (2018). Case study research and applications: design and methods (6th ed.). Los Angeles: Sage Publications.
-
Zhang, L., Chen, C., Wang, Q., & Zhou, D. (2021). The impact of feed-in tariff reduction and renewable portfolio standard on the development of distributed photovoltaic generation in China. Energy, 232, 120933. http://doi.org/10.1016/j.energy.2021.120933
» http://doi.org/10.1016/j.energy.2021.120933
-
Editor-in-Chief
Dr. Pedro Munari