 Inventory policy using the Multi-Echelon Closed-Loop Supply Chain in the Acquisition Market
Abstract
Abstract The Closed-Loop Supply Chain (CLSC) stands out due to a growing concern about environmental aspects, in addition to being capable of maximizing the value of resources throughout a product’s life cycle by reducing waste. Multi-echelon supply chain management has been widely recognized as a tool well capable of minimizing total inventory costs and promoting greater cooperation among supply chain members. Nonetheless, inventory policy management is still poorly explored in literature regarding the acquisition industry. Therefore, this paper explores an inventory policy through modelling a multi-echelon CLSC in the payment card industry aimed to lower inventory, freight, and shortage costs. Results reveal that there was a reduction in total costs without negatively affecting the minimum service level expected by the company under study, considering the cost of acquisition, freight, and shortages, in addition to the influence of inventory mix on its policy.
Keywords:
Closed-loop supply chain; Multi-echelon; Inventory policy; Payment card industry; Acquisition market
Resumo
Resumo A Cadeia de Suprimentos de Ciclo Fechado (CLSC) se destaca devido a uma crescente preocupação com aspectos ambientais, além de ser capaz de maximizar o valor dos recursos ao longo do ciclo de vida de um produto, reduzindo o desperdício. A gestão da cadeia de suprimentos em múltiplos níveis têm sido amplamente reconhecida como uma ferramenta capaz de minimizar os custos totais de inventário e promover maior cooperação entre os membros da cadeia de suprimentos. No entanto, a gestão de políticas de inventário ainda é pouco explorada na literatura no que diz respeito à indústria de aquisição. Portanto, este artigo explora uma política de inventário através da modelagem de uma CLSC de múltiplos níveis na indústria de cartões de pagamento, com o objetivo de reduzir custos de inventário, frete e escassez. Os resultados revelam que houve uma redução nos custos totais sem afetar negativamente o nível mínimo de serviço esperado pela empresa em estudo, considerando o custo de aquisição, frete e escassez, além da influência do mix de estoque em sua política.
Palavras-chave:
Cadeia de suprimentos fechada; Múltiplos níveis; Política de inventário; Indústria de cartões de pagamento; Mercado de aquisição
1 Introduction
A simultaneous flow of direct and reverse logistics is called Closed-Loop Supply Chain (CLSC). It can be defined as the design, control, and operation of a system aiming to maximize value creation throughout a product's life cycle with dynamic value recovery from different types and amount of return over time (Mawandiya et al., 2020).
Furthermore, a CLSC can maximize the value of resources and reduce waste. This concept has brought a few evolutions in Supply Chain Management (SCM) models regarding innovative objectives and restrictions, in addition to recovering and valuing activities of products at the end of their life cycle - End of Life (EOL). The main form of recovery lies in remanufacturing the product or reusing parts of it as new products or inputs (Godichaud & Amodeo, 2015; Chen & Chen, 2019).
It is possible to explore its economic potential, since most products from the practice of reverse logistics (RL) only require light repairs, while others classified as end-of-use may require more severe repairs in remanufacturing (Kazemi et al., 2019; Fofou et al., 2021, Mishra et al., 2023).
The remanufacturing process is the only refurbishment process able to meet Original Equipment Manufacturer (OEM) performance specifications. However, other recovery processes can be profitable if practically spick-and-span-new items are produced as a result. The most common recovery systems, as well as their definitions, are found in Table 1 (Dev et al., 2017).
The integration of the entire value chain is profoundly fundamental to provide customers with high standard of quality and efficient services through SCM. To achieve such a level of performance, companies must have optimal designs achieved by CLSCs, also known as Supply Chain Network Design (SCND). However, such an approach generates non-feasible or conflicting decisions at times when multilevel integration takes place due to its inherent complexity (Araya-Sassi et al., 2020).
Another relevant issue of an integrated SCND is on how to select adequate inventory policies able to address the problem of how and when to order products should be associated with Inventory and Production Planning (I&PP) system. Multilevel I&PP is well known for reducing the total average cost of inventory by promoting harmonious cooperation among SC members (Escorcia-Caballero et al., 2020).
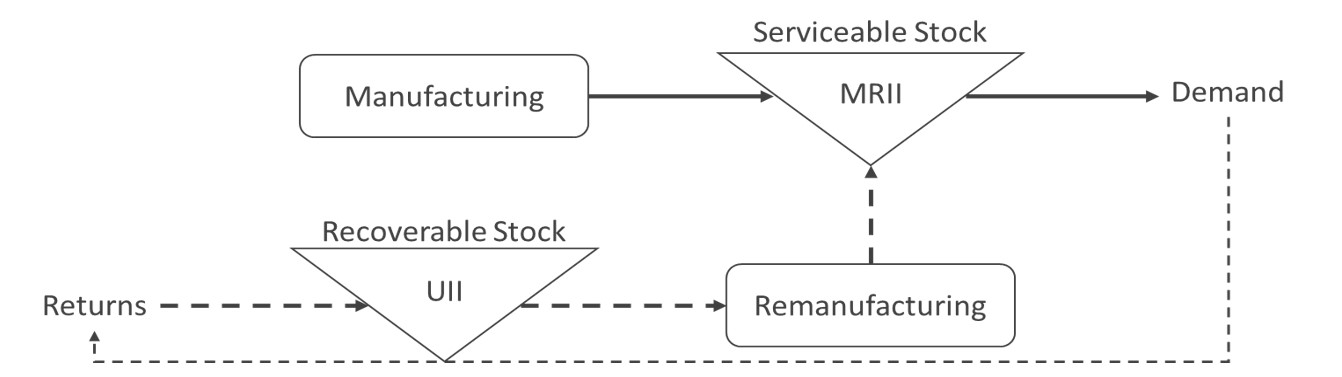
In I&PP systems, there are two ways to increase the inventory of repairable items: manufacturing and remanufacturing. In a hybrid system, there are two stock points, the former being used items, i.e. stock recoverable due to minor damage – Used Items Inventory (UII), and the latter is the stock of manufactured and remanufactured items - Manufactured and Remanufactured Items Inventory (MRII), all shown in Figure 1.
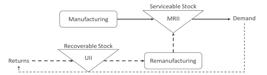
Hybrid inventory system and manufacturing and remanufacturing systems.Source:Dev et al. (2017).
Several advanced numerical methods can solve inventory control problems, thus making it a highly multidisciplinary field attracting researchers from numerous areas. Although the fundamental aspect of inventory control theory is to determine the amount of time and quantity to be replenished, each problem can be notably different from others, i.e. they are full of specificities (Jackson et al., 2020).
Furthermore, a new inventory control policy should be implemented to operate the SC aiming to enable product reuse, since there are different types of uncertainties related to supplying new products (demand and deadlines) and managing RL products (return and deadlines) (Godichaud & Amodeo, 2015; Becerra et al., 2021).
In CLSC, there must be an evaluation of the amount of inventory required to meet demand taking into account the possibilities of making products available, either in the form of remanufacturing or acquisition according to the concept of Material Requirements Planning (MRP). In essence, MRP considers the unpredictability in reusing components and processing times of each activity during remanufacturing, thus defining when and how much to produce (Sitcharangsie et al., 2019).
In addition to MRP, decisions about a distribution strategy capable of ensuring the provision of high level of services at low inventory costs refer to a concept called Distribution Requirements Planning (DRP) which directly affects the inventory policy. It can be explained by the fact that the total cost composed of the cost of fixed allocation, inventory maintenance, acquisition, transportation, and ordering can be reduced through strategies adopted in DRP (Firoozi et al., 2020).
DRP has become an effective method for multi-product and multi-level inventory control due to its distribution to allow full visibility of inventory levels for all members of the SC. Therefore, the DRP considers a large number of variables in order to minimize the total cost of manufacturing and transportation, as in Table 2 (Erraoui et al., 2019).
In this context, the general objective of this work was to propose an inventory policy for an effective management of a multilevel CLSC in order to meet specificities of the acquisition market, which is capable of meeting the expected service level of the company under study while at the same time avoiding unnecessary and costly stock. Specific objectives are modeling a CLSC for the acquisition market and detecting the main variables affecting this model.
The article is organized into four sections. Section 2 outlines its justifications and presents its general objective. Section 3 describes the theoretical framework, and an inventory sizing problem solved by a multi-echelon CLSC, the development of mathematical expressions allowing the calculation of all costs involved, as well as the restrictions associated with the company that was the object of study in the acquisition market. Moreover, a complete formulation of the proposed model to minimize the total cost of implementing the multi-echelon CLSC is shown according to the restrictions identified in real problem solving. Section 4 describes the computational results of tests carried out using the proposed model. Its conclusion is shown in Section 5, followed by its references.
2 Justifications and objectives
A literature search was conducted using Scopus and the Web of Science (WOS). Only articles published between 2009 and 2023 were selected. Their results with respect to publications and citations are shown in Table 3.
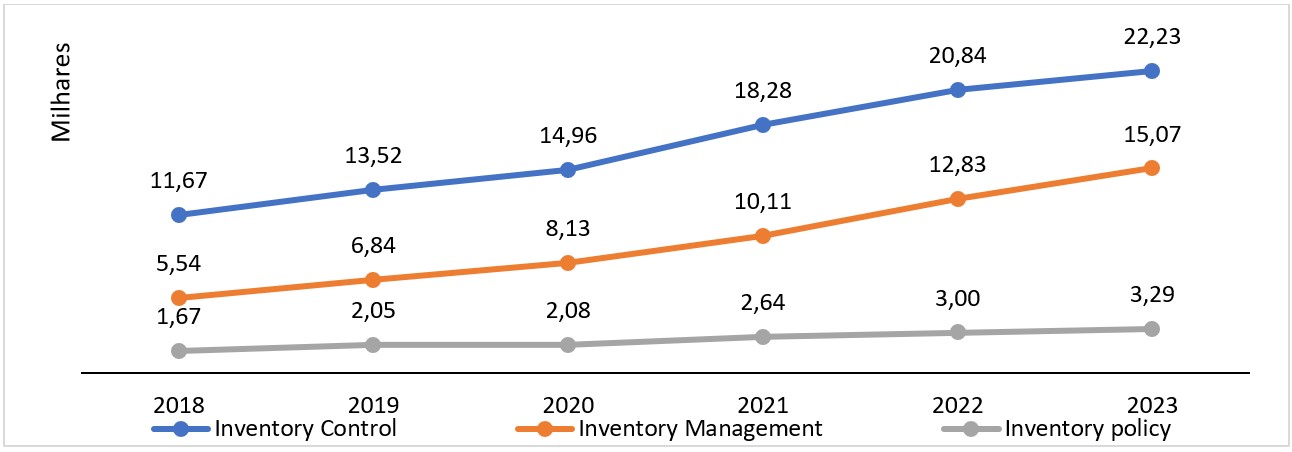
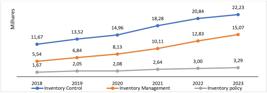
Table 3 reveals that the Scopus and WOS platforms have similar results regarding the search on the issue of inventory control. In addition to a significant number of keywords citations, Figure 2 shows that the issue of inventory control has gained greater relevance in recent years.
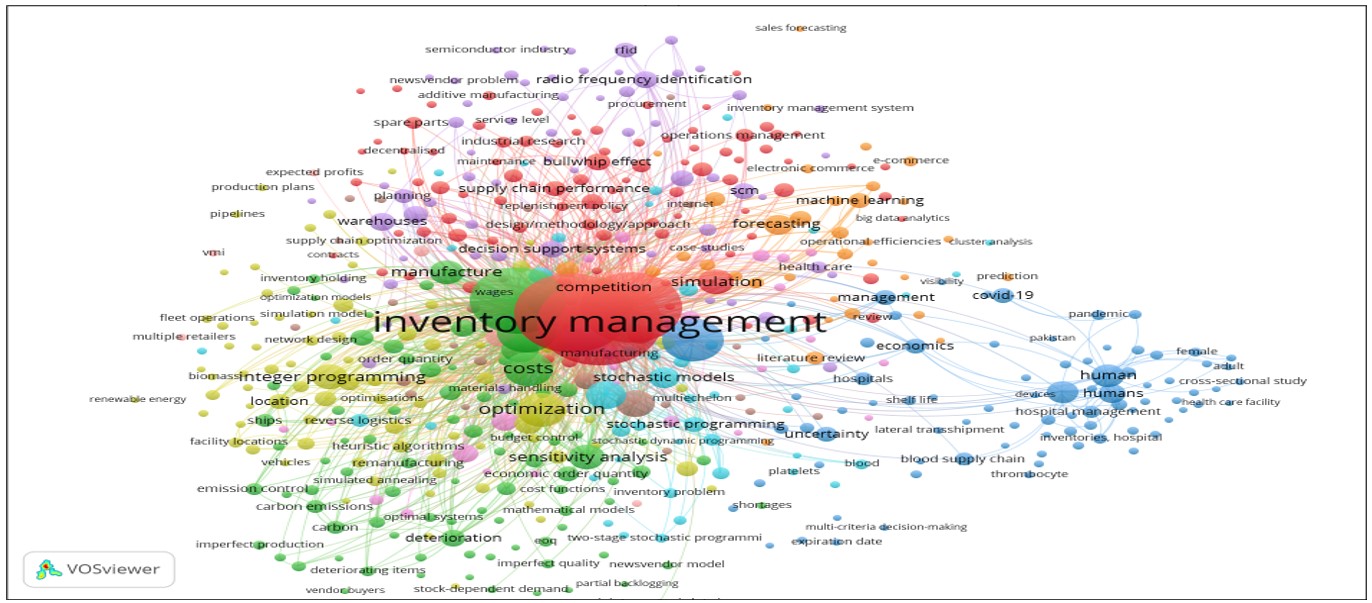
After analyzing articles according to the number of publications and citations, a map was created from the literature data obtained on the Scopus platform using the strings "Inventory Control" and "Supply Chain", since there were a few publications citing the “Closed-Loop Supply Chain”. The analysis was carried out by counting every co-occurrence of keywords, as shown in Figure 3.

By analyzing Figure 3, it is observed that the most cited keywords using the search strings “Inventory Control” and “Supply Chain” were: “Inventory Management”, “Stochastic systems” and “costs”. The most significant words found thereof were: “decision making”, “optimization”, “integer programming” and “stochastic systems”, as in Figure 4.

Although the strings “inventory management” and “inventory control” are quite similar, inventory management provides the level of service expected by customers and reduce all costs involved, i.e. it involves aspects related to SCM, demand, logistics and distribution (Musa & Dabo, 2016; de Oliveira et al., 2019).
Inventory control, on the other hand, essentially deals with the issue of well-timed supply, resupply size and how items should be controlled. Therefore, inventory control seeks to establish a trade-off between replacement costs and inventory maintenance costs (Jackson et al., 2020).
An effective inventory policy allows minimizing CLSC's joint cost by considering the sum of retailer, manufacturer, and repair center costs. For such a purpose, an ideal batch size should be found, as well as the shipping policy for each CLSC unit (Mawandiya et al., 2020).
However, the elevated degree of complexity of real business-oriented problems hinders their resolution, hence some types of approximations are often used (Jackson et al., 2020) to actually represent the complexity and uncertainties of CLSC requirements (Araya-Sassi et al., 2020).
The central aspect of a multi-echelon inventory policy is to define the time at which resupply should occur based on the available stock of every link in the SC, which can be estimated by adding the stock in transit and the position of its subsequent links (Eruguz et al., 2016).
A literature review carried out by Escorcia-Caballero et al. (2020) revealed that there is a lack of actual simulation cases and applications due to the computational complexity associated with implementing multi-echelon inventory policies. As a matter of fact, most of these models assume a stationary or stochastic external demand to establish an equation as a function of the total cost of SC capable of determining optimal lot size (Q*) to be requested.
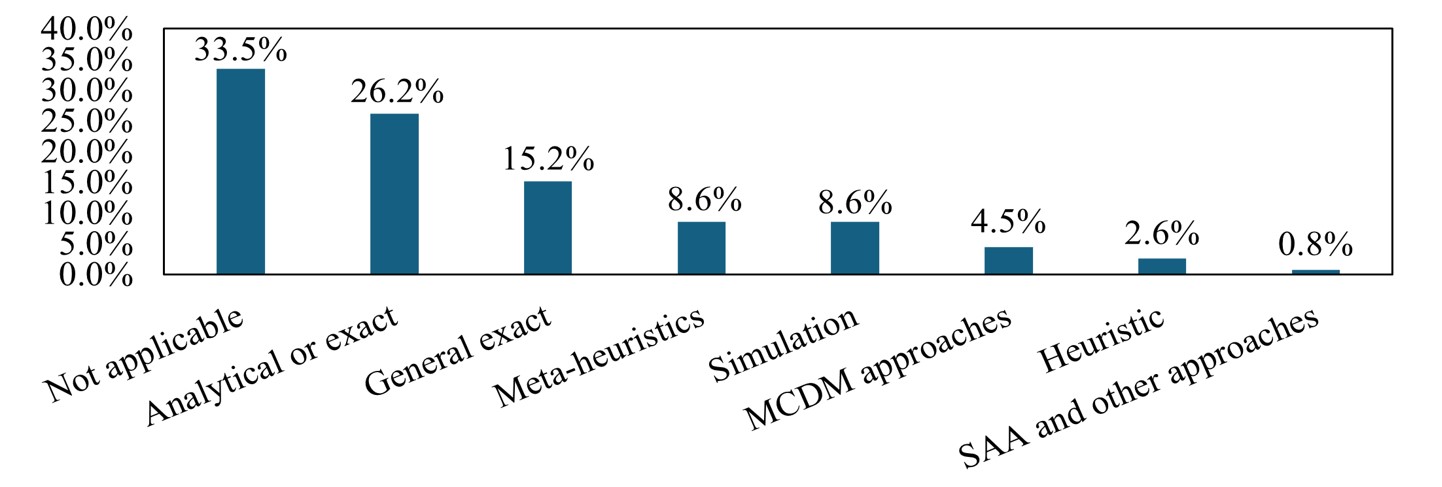
The main objective of a simulation is to replicate the effects and costs within an actual SC context. Therefore, several approaches are used by researchers to solve mathematical problems in CLSC, which were divided into seven main categories and shown in Figure 5.
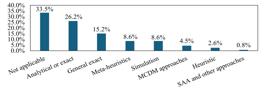
The so-called analytical or exact methods are complex and limited in solving large-scale problems. Some researchers seek to solve problems of such nature using exact solvers such as Lingo, GAMS, CPLEX and Gurobi. Sample Average Approximation (SAA) techniques are more frequently used to face stochastic optimization problems, among other approximation methods. Heuristic and meta-heuristic algorithms such as the Genetic algorithm (GA), Simulated Annealing (SA), Tabu Search (TS) or Ant Colony (AC) are those used the most to solve large-scale problems (Govindan et al., 2015).
The main gaps found through this research concern the definition of a stock policy considering a CLSC having greater influence on RL (reverse logistics) in the production chain. Most models in literature do not encompass the relationship between RL and demand, since there is greater complexity by considering them simultaneously. To minimize complexity, most literature considers that demand and RL are independent factors, or that each requires lessening the complexity/severity of hypotheses (Zerhouni et al., 2013; Foroutan et al., 2020).
Most authors regard static models as the known SC parameters which do not vary over time, as well as serial SCs having one or two production levels (Pacheco, 2017; Chelly et al., 2019).
Although Zerhouni et al. (2013) demonstrated the influence of RL on inventory policy through calculating an ideal inventory level and complying with SC parameters such as arrival rates, production, return on investment, production costs, sale loss, RL and maintenance costs, their model does not encompass the joint problem of manufacturing and remanufacturing control.
Regarding a multi-echelon SC, there is a gap in applications aimed at real-world contexts due to the computational complexity associated with implementing multi-echelon inventory policies. Additionally, an evaluation of a multi-echelon inventory policy in a more complex SC can offer interesting insights associated with inventory performance (Escorcia-Caballero et al., 2020).
In addition, the literature review allowed finding few articles on the acquisition market, thus revealing that this field is still little explored, since there were no results by searching “acquirer” and “Supply Chain Management”. It should be noted that searching the keyword “acquirer” alone allowed finding 766 articles published in the last five years, however, all were related to the field of corporate finance, e.g. mergers and acquisitions, corporate governance, and finance.
It appears, therefore, that optimal inventory management has become a relevant objective to simultaneously reduce costs and improve customer service in an increasingly competitive environment (Ahmadini et al., 2021; Becerra et al., 2021). In a multi-echelon SC, stock control is even more relevant, since effective stock management at each stock point is critical to provide customers with high-quality services at the lowest cost possible. For such a purpose, each stock must maintain a certain level of safety to absorb demand variation (Klosterhalfen et al., 2023).
One of the issues regarding decision levels is related to DRP – which defines optimal decisions to be made about when and how much to order. They can be settled using traditional optimization techniques, e.g. classic models such as the EOQ – Economic Order Quantity, along with the RL model for repaired items that seem as good as new (Hasanov et al., 2019).
Traditional optimization models tend to reduce the problem to a set of independent levels of inventory control so that problems remain solvable, thus neglecting the interdependence between the SC links. This may rule out some positioning opportunities or strategies for stock coverage (Firoozi et al., 2020).
Network design (ND), or SC design, has great strategic relevance due to its impact on the efficiency and responsiveness of the supply chain, as it finds the number and location of distribution centers, allocation of flows between distribution centers, adequacy of capacity and control of flows (Godichaud & Amodeo, 2015; Aldrighetti et al., 2021).
In a CLSC, the configurations of direct and reverse logistics networks must be integrated (Chen et al., 2019; Mishra et l., 2023) to improve their performance, which is even more relevant to RL, since the quantity and quality of RL products have greater uncertainty compared to direct logistics (Godichaud & Amodeo, 2015).
In CLSC, the step that adds the most value is the reuse or repair of products, as well as the use of components. Both manufacturing and remanufacturing are used to create inventory if the demand rate is greater than the RL rate (Dev et al., 2017).
Additionally, due to the interdependence of CLSC decisions, network design (ND) must be carried out simultaneously, since suboptimal results are generated when reverse and forward flow are considered individually (Kazemi et al., 2019; Prakash et al., 2020).
ND models are categorized according to the level of integration between forward and reverse flows, as well as the modeling of supply in reverse flows. However, the type of item recovery process, the amount to be recycled, reused items, and remanufacturing affect ND categorization. From the perspective of modeling, an interaction between direct and reverse logistics is made by defining the relationships between product and reverse flows associated with the demand of the final SC level (Van Engeland et al., 2020; Fu et al., 2021).
3 Background, problem description, modeling and proposed solution
This section presents a different mathematical formulation from those used in traditional approaches to estimate the desirable amount of services provided, lead time, demand and demand deviations, in addition to means of calculating costs and restrictions involved in SC links.
3.1 Background and problem description
According to Eruguz et al. (2016), there are means to mitigate the risk of stockouts, such as a safety stock equation able to determine the necessary stock level according to the probability of occurrence of stockouts, i.e. the desirable number of services provided, as in Equation 1. It is worth mentioning the target stock which is the highest level of stock possible, i.e. the stock quantity able to meet demand for the lead time period in addition to the resupply period without exceeding safety stock levels, as in Equation 2:
where,
d = Daily demand (units),
L = Lead Time (days),
q = resupply interval,
= demand standard deviation (units),
= Lead Time standard deviation (days),
S = Safety stock inventory (units),
Y = Target inventory (units),
z = Inverse cumulative normal probability distribution.
As an illustration of safety stock calculation, let us assume a daily demand of 100, demand standard deviation of 25, lead time of 5 days, lead time standard deviation of 2 days and expected service provision level of 95%:
According to these parameters, safety stock must be 341 to absorb variations in demand and lead time, thus reducing the probability of stock shortages.
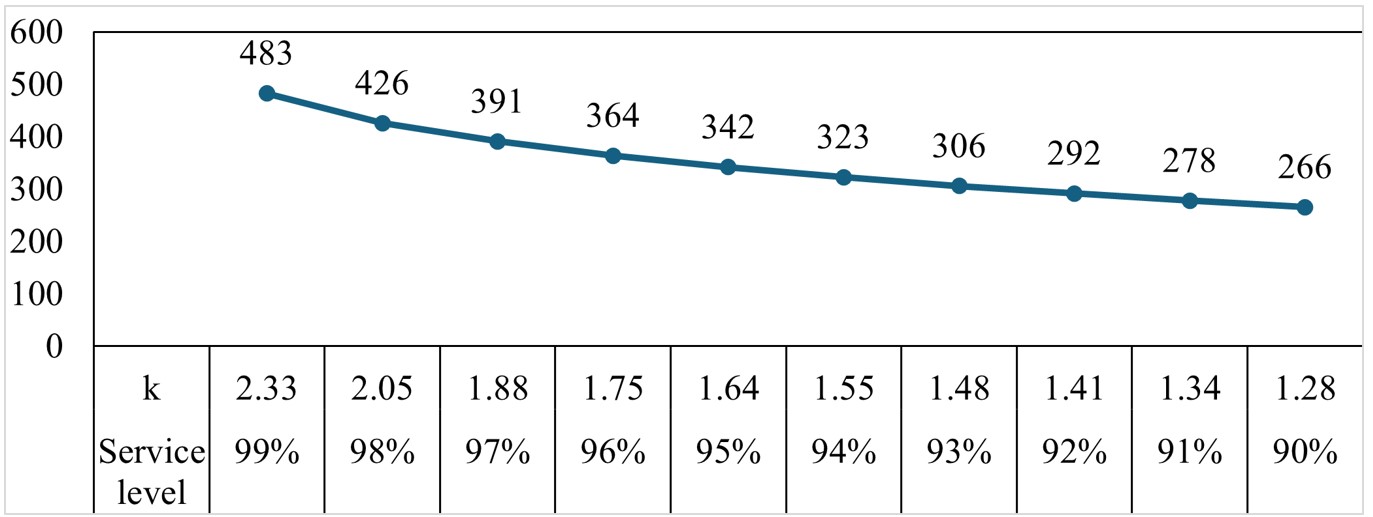
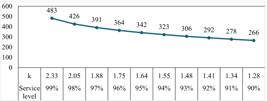
To assess the impact of the z factor on safety stock levels, Figure 6 shows such an impact according to expected service levels. By changing the z factor from 2.33 (99% service level) to 1.28 (90% service level) calculated based on the inverse cumulative normal distribution, there is a 45% reduction in safety stock levels, therefore evidencing the relevance of the z factor in inventory policies.
However, in the acquisition market, there are two specific variables to calculate the required CLSC level of stock: the Death on Arrival (D.O.A.) and installation failure rates, since they increase the risk of stockout in collection and distribution centers (CDCs), unlike other operations.
The D.O.A process happens when a product sent from the distribution center (DC) to collection and distribution centers (CDCs) has a defect at the time of installation at the customer’s location. Thus, product use becomes unfeasible and must be returned to the distribution center. In the company under study, there is a D.O.A. for each type of technology, as well as projects to reduce such an occurrence.
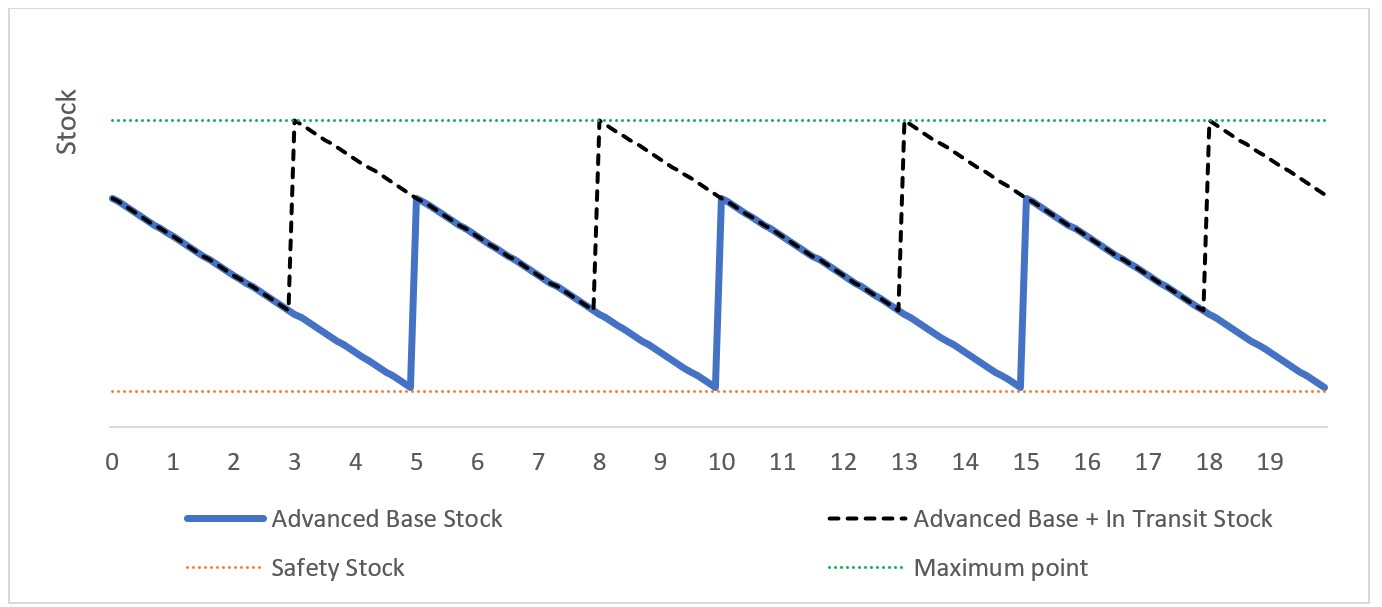
A product which is incapable of being installed is also known as a POS (Point Of Sale) device. Regarding D.O.A., there is a decrease in stock availability in CDCs, in addition to the fact that there might be greater risk of stockout when it is disregarded in the stock plan. To illustrate the impact of D.O.A. on the stock of a CDC, the stock cycle was shown in Figure 7 considering a D.O.A. rate of 7%, but it was not considered in the inventory policy.
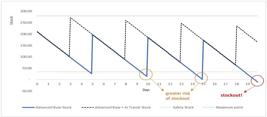
Figure 7 shows the following:
-
CDC Stock - physical stock in the CDC made available for installation at the customer’s location.
-
CDC Inventory plus Inventory in Transit – it was added to the CDC Inventory, i.e. the stock in transit up to a time which is the same as that delivered to the CDC.
-
Maximum point - the maximum stock reached during a cycle, which also represents the total stock required for the CLSC in question.
-
Safety stock level - stock calculated based on Equation 1.
Given a DOA rate of 7%, there are 7 defective items for every 100 POS devices taken by technicians to carry out their installation at the customer’s location. Thus, the stock at the CDC decreases on a daily basis. On days 10 and 15 of the cycle shown in Figure 7, the stock level at the CDC is below the safety stock level, therefore increasing the risk of stockout, as there might be other variations at the CDC, such as transport delay or deviation on demand. After day 19, there is stockout after the accumulated effects of D.O.A. in the SC.
Installation failure occurs when it is impossible to install the item at the customer’s location due to reasons unrelated to its operation. The main reasons for such are closed establishment, mistakes in informed addresses, the customer does not recognize the order, among others. However, unlike in cases of D.O.A., the technician is still able to use it for other orders, however, given that a percentage of orders are not going to be carried out successfully, technicians must take more POS devices than necessary to reach their daily goals.
To exemplify this last situation, if the technician must carry out 20 orders on a given day and considering that 20% of visits made are cancelled, 25 visits are required, but only 20 (80%) are carried out successfully. Nonetheless, the technician still must take 25 POS devices since cancellation rates on that day are lower than expected, i.e. 20% or even 0%.
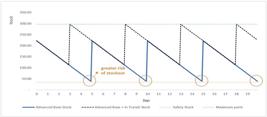
Thus, part of the stock must always remain with the technician, and this number should be considered in the safety stock of CDCs, otherwise there is a greater chance of stockout. In Figure 8, this effect becomes even more evident, given that there is a sharper drop in stock on the 1st day of the cycle due to the fact that POS devices are still in the technician’s possession due to cancellation, thus the stock available at the CDC decreases and the risk of stockout in the following days of the cycle becomes greater.
Given the specificities of the acquisition market stated previously, it is necessary to adapt the calculation of safety stock, as proposed by Eruguz et al. (2016), to incorporate the D.O.A. and failed installation occurrences.
For such a purpose, a stock policy was proposed to meet the specificities of the acquisition market for CDCs and mitigate the problem of stockouts, i.e. to minimize the impacts of unsuccessful visits and failures on the distributed POS devices, in addition to variations in lead times of supply and demand.
Next, there is a discussion on the inventory policy for DCs considering the form of production of reused, repaired devices and the acquisition of new POS devices. Thus, the distribution center is to be responsible for absorbing all variations according to the production mix, both regarding what will be produced by the center itself and by suppliers and repair centers.
It was assumed that DCs would also have an inventory policy able to meet these specificities of the acquisition market, in addition to regulating safety stock according to the estimated production mix, since there might be variations in lead time, production demand and their deviations between what is delivered by the DC, repair centers, and the supplier of new POS devices. Furthermore, an inventory policy is going to be presented to define an ideal amount of inventory in all stages of multi-echelon SC of a company belonging to the acquisition market.
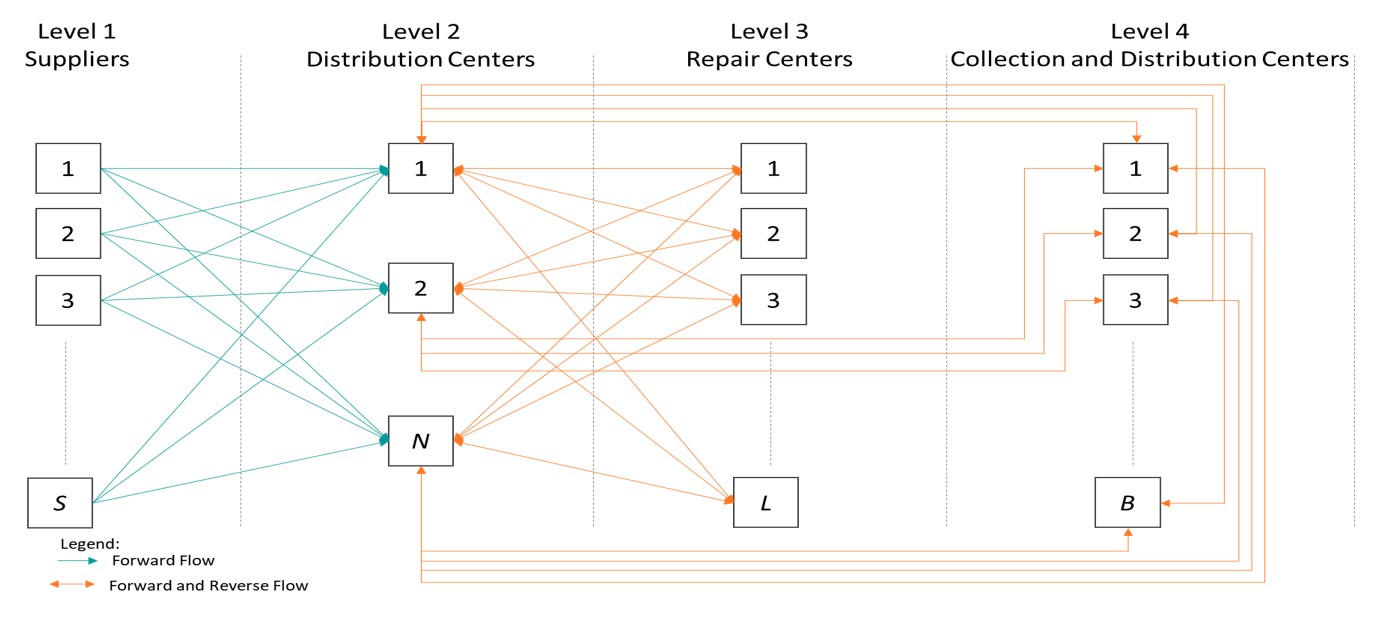
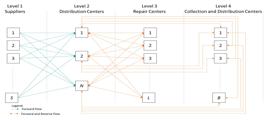
To describe the problem, let us consider the suppliers responsible for providing the DCs with new POS devices as the first level. The second level consists of the ND of DCs responsible for receiving, sorting, storing, and the delivery process. At this stage, the process of sorting POS devices from the reverse logistics takes place, i.e. POS devices from exchanges and uninstallations.
The POS devices requiring minor repairs are performed at the distribution centers, and those that need more complex repairs are sent to repair centers after being sorted.
The third level includes the ND of repair centers responsible for repairing POS devices presenting major problems, and then both repaired and non-repairable POS devices are sent to the DCs. The fourth level is the CDC receiving POS devices in good condition from the DCs responsible for storing and then sending them to technicians to attend customers.
Thus, it is possible to better understand the flow of devices in a CLSC network of the acquisition market according to Figure 9. Except for level 1, i.e. suppliers, others maintain a direct and reverse flow, demonstrating a great influence of RL in this market. This occurs due to the detriment of POS devices being reused in the SC of the acquisition market throughout the product lifespan.
3.2 Mathematical model
Given the previously made considerations to frame the inventory policy in CDC and DCs, the mathematical model is detailed by Equations 4 to 14, designed to minimize the total cost of CDC and DCs by varying the level of service of CDCs and the mix of production as follows:
Subject to:
The objective function (Equation 4) seeks to minimize the cost of CDC and DCs regarding the cost of freight, shortages, inventory, acquisition, and production according to the inventory policy of each CDC, product and distribution center.
Constraint in Equation 5 defines the lowest level of service expected from each CDC and distribution center, i.e. it is expected that the probability of stockout, i.e. lack of POS devices, should be less than 5%. Constraint in Equation 6 defines the quantity to be produced in distribution centers, repair centers, and suppliers greater than the balance of CDC, DCs and demand.
Constraint in Equation 7 defines that the target stock in CDCs cannot exceed their storage capacity. Constraints in Equations 8 and 9 define that the quantity produced should not exceed the production capacity of DCs and repair centers, respectively. Finally, constraints in Equations 10 to 14 define a non-negativity of decision variables related to stock composition.
3.2 Modeling
The fundamentals of the mathematical model proposed for solving the problem of inventory policy in CDCs and distribution centers to meet the requirements of the acquisition market are going to be presented as follows.
The proposed model seeks to minimize the estimated cost of multi-echelons in a CLSC, such as acquisition, repair, reuse, freight and shortage costs, in addition to ensuring the level of (at least 95%) of services provided by the studied company. Data on the studied company was used to run the mathematical model. Some considerations were made to calculate Decision Variables of the inventory policy:
-
The quantities, locations, and capacities of DCs, CDCs, suppliers, and repair centers are known.
-
New products are considered as good as reused or repaired ones.
-
Carrying capacity is unrestricted.
-
Shipping cost is the same for all products.
-
The cost of sorting and kitting is the same for all products.
-
The cost of transportation to repair centers is included in the repair price.
-
DCs are responsible for absorbing variations from repair centers and suppliers.
-
The cost of shortages is the same for all products and varies according to region.
Here is the notation adopted in the model:
Sets:
I Set of Collection and Distribution Centers (indexed by i)
F Set of Suppliers (indexed by f)
J Set of Distribution Centers (indexed by j)
P Set of Products (indexed by p)
R Set of Repair Centers (indexed by r)
Parameters:
D.O.A. rate of product p at CDC i
Monthly reverse demand of product p at CDC i
Daily demand of product p at CDC i
Daily demand of product p at DC j
Stock of product p at CDC i on the last day of the previous month
Stock of product p at DC j on the last day of the previous month
Sorting backlog of product p at DC j on the last day of the previous month
Repair backlog of product p at DC j on the last day of the previous month
Sorting cost at DC j
Shortage cost at CDC i
Obsolescence rate in the reverse flow of product p at CDC i
Non-repair rate of product p at Repair Center r
Reuse rate of product p at DC j
Repair cost at repair center of product p at DC j
Lead time of CDC i
Production lead time of product p at DC j
Production lead time and delivery of product p of Repair Center r to DC j
Delivery lead time of product p by supplier f to DC j
Failure rate in installing product p at CDC i
Assembly cost at DC j
Stock capacity at CDC i
q Reorder interval
Reorder point of product p at CDC i
Reorder point of product p at DC j
Standard deviation of stock composition at DC j
Standard deviation of product demand p at CDC i
Standard deviation of transportation lead time to CDC i
Standard deviation of production lead time of product p at DC j
Standard deviation of production lead time of product p at repair center r
Standard deviation of lead time of supplier f to DC j
Transportation time to CDC i
Unit shipping cost of DC j to CDC i
Price of product p by Supplier f
Decision variables:
Safety stock of product p at CDC i
Target stock of product p at CDC i
Target stock of product p at CDC j
Safety factor of product p at CDC i (Inverse cumulative normal probability distribution) Quantity of product p produced at DC j
Quantity of product p produced at Repair Center r
Quantity of product p purchased from Supplier f
It is worth mentioning that the target stock (maximum point) was calculated before estimating the total cost of CDC, therefore it was necessary to calculate the associated safety stock. In this sense, an adaptation of a traditional safety stock (Equation 1) was made to mitigate D.O.A. and installation failures using the zpi variable, i.e. the expected service level (95%) of product p at CDC i defined using the Microsoft Excel® Solver and “NORMSINV. N”.
Thus, the calculation of CDC safety stock in the acquisition market based on the D.O.A. and failure rates while installing product p at CDC i is performed according to Equation 15:
An example of how to calculate safety stock through Equation 15 and absorb lead time and demand variation, in addition to considering the impact of D.O.A. and failure rates at CDC 1 and product 1 is as follows:
where,
,, , , , , .
Target stock refers to the amount of stock required to meet the demand during lead time, in addition to the resupply interval without exceeding the safety stock of products at the CDC, which can be calculated according to Equation 17:
Therefore, using the same example as that for product 1 in CDC 1, target stock is found as follows:
where, , , .
An explanation of 303.89 units calculated for the target stock of product 1 in CDC 1 is that stock satisfies a daily demand of 24 units during lead time in addition to the time of stock check, i.e. 303.89 units are able to meet a daily demand of 24 units for 11 days (lead time and periodic check period) until reaching desirable safety stock levels (38.89 units).
The target stock at the CDC (Equation 17) allows calculating the annual cost of POS devices in the CDC as a function of target stock and acquisition costs according to Equation 19:
To calculate the annual cost of POS devices in the SC, the product value should be divided by three, since an accelerated depreciation of three years has been considered as it is a technology item that has undergone constant changes in recent years to keep up with market trends, as shown in Equation 20:
The annual cost of POS devices of product 1 in CDC 1 is:
where, .
Therefore, it costs R$ 60,778.00 to keep the stock of product 1 at CDC 1. The annual freight cost to supply the CDC given by Equation 22 was calculated considering the supply to meet an annual demand of all CDC:
For instance, the annual freight cost of product 1 at CDC 1 only for working days (252) is calculated as:
where, .
Shortage (price of POS devices lacking in for services) was calculated based on an estimated loss of profitability in the service region of each CDC, i.e. the loss due to transaction fees, known as Merchant Discount Rate (MDR), as in Equation 24:
The annual shortage cost found for the example of product 1 at CDC 1, considering that the cost of a missing product by the customer generates uncaptured revenue of R$16.00 a day, is calculated as:
where, .00.
It should be observed that the total cost of the CDC is found by summing these three costs. Therefore, according to the example of product 1 at CDC 1, the total cost of the CDC amounts to R$176,430.00. A simulation was performed using the values of to demonstrate how the safety factor affects the total cost, as in Table 4.
In Table 4, the lowest cost of product 1 at CDC 1 is associated with the highest confidence level, i.e. with z11 = 99%, since the impact of shortage is more significant than the cost of increasing stock to ensure a greater quality of services.
It is worth mentioning that, similarly to the stock policy of collection and distribution centers, DCs must have a stock policy for available POS devices, i.e. ensuring that they are in good condition of use before being sent to CDCs to serve customers.
Actually, when it comes to stock composition, distribution centers have reused POS devices in DCs, repaired POS devices at repair centers and new POS devices. Thus, the safety stock of distribution centers is responsible for absorbing variations in stock availability arising from DCs, repair centers, and suppliers.
Therefore, to calculate the cost of inventory mix, i.e. DCs on-hand inventory, the annual cost of reuse was calculated as Equation 26 considering all POS devices sorted in distribution centers, as well as the assembly of kits and the annual cost of repair, as in Equation 27, based on the number of POS devices fixed at repair centers in addition to the costs of sorting and assembling kits at distribution centers and the annual cost of depreciating items, as aforementioned:
Therefore, the total cost of inventory composition is given by Equation 28:
To calculate safety stock, it is necessary to calculate lead time and the standard deviation of stock composition beforehand, weighted by the quantity produced in each link according to Equations 29 and 30, respectively:
To exemplify the use of these equations to calculate the stock composition of product 1 at DC 1, i.e. the type of stock made available to CDCs to serve customers, Table 5 shows the amount of available stock expected and classified by origin (distribution centers, repair centers, and suppliers).
From Table 5, the lead time of stock composition of product 1 at DC 1 is calculated as: . This indicates that an item takes approximately 7.8 days to be ready before being sent to CDCs with expected standard deviation of approximately 2.5 days.
Once lead time and the standard deviation of stock composition are found, it is possible to calculate the safety stock for each product at every DC according to expected service levels as in Equation 31:
(31)
As aforementioned, the target stock of DCs is the point at which stock reaches its maximum theoretical value, since the quantity produced daily is also shipped according to demand. In other words, the amount of stock meets demand for the lead time of stock composition in addition to the resupply interval, which is calculated as Equation 32:
In order to find the amount of stock to be produced monthly to meet demand according to the inventory policy, it is necessary to calculate the balance of stocks of the CDC, at distribution centers and the monthly demand based on the D.O.A rate using Equations 33, 34 and 35, respectively:
Based on stock needs, a strategy for composing stocks to meet shipping requests should be defined. Therefore, the quantity to be produced by distribution centers, repair centers, and acquisition of new POS devices should be determined.
To calculate the production capacity of DCs, i.e. sorted POS items that only require minor repairs, there should be sorting backlog, reverse volume, obsolescence rate from the reverse flow and the reuse rate of POS devices in DCs, as shown in Equation 36:
The calculation of production capacity of repair centers (by 21 or 22) differs from that for DCs, once the reuse rate should be considered, i.e. the POS items that DCs must send to repair centers in order for them to be in good conditions of use once again. In addition, the repair backlog is added, and the rate is applied so that repair centers cannot recover POS devices, either on account of being severely damaged or due to the cost being higher than that of a brand-new item:
Or
To calculate acquisition needs, there should be a balance of CDCs and distribution centers in relation to target stocks, demand, and the production capacity of DCs and repair centers. Therefore, the acquisition needs for the target stock is given by Equation 39, using Equations 33 to 37:
Acquisition needs = (33) + (34) + (36) + (37) - (35) (39)
Thus, the proposed inventory policy is the target stock of CDCs added to the target inventory of DCs to meet the level of service expected by the company, as shown in Equation 40:
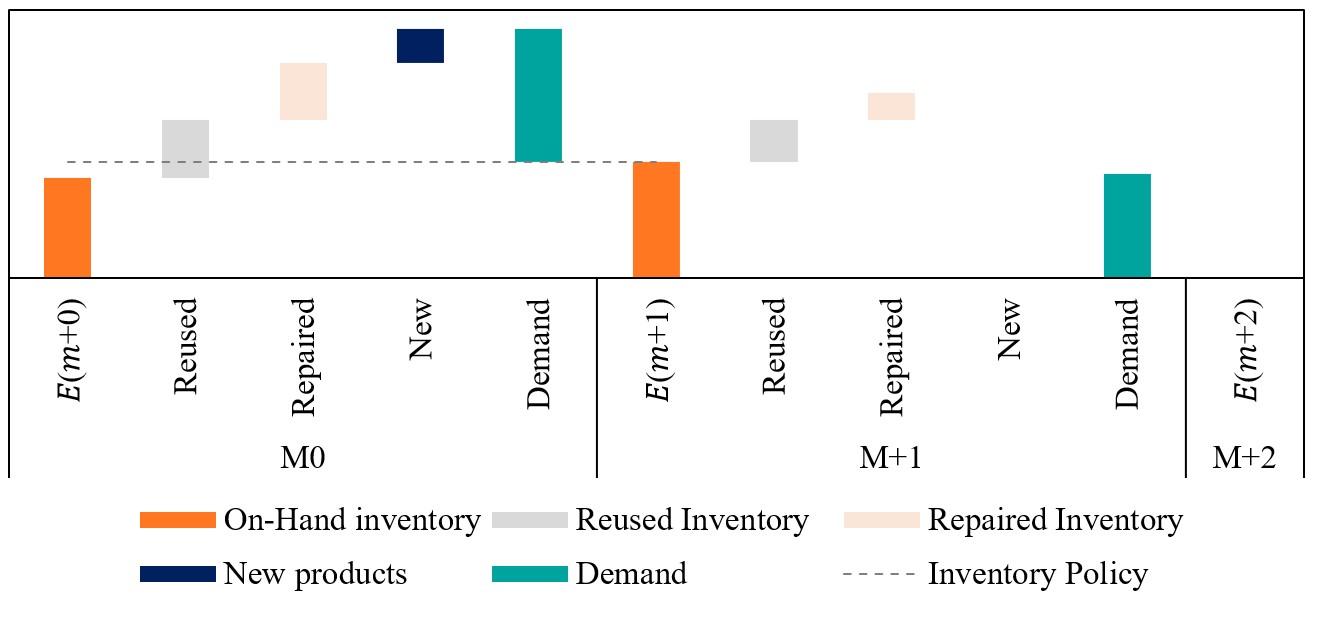
The initial stock (E) is an example of the stock dynamics of the company under study along the time, in which inventory mix items (Reuse; Repair; Acquisition) are added and demand is subtracted. Equations 41 and 42 were used for calculating the stock estimated for the next month (k+1):
subject to:
Equation 41 allowed depicting stock dynamics in Figure 10.
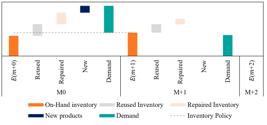
As illustrated in Figure 10, the CLSC inventory policy varies on a monthly basis depending on the availability of inventories, i.e. the inventory policy is dynamic and varies according to the production mix. It was considered static for CDC stock.
4 Computational results
Some real scenarios found in the studied company are going to be used to discuss the results observed through the proposed model.
It is worth mentioning that when the effect of D.O.A. and installation failures (Cancellation) in the CDC stock has led to sending POS devices by DCs, consequently affecting the inventory policy (increasing maximum stock point), the cycle was adjusted and there was no stockout risk, as shown in Figure 11.
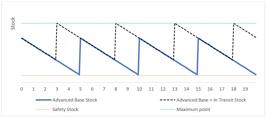
As a result of simulations, the effect on total cost by changing D.O.A. and installation failure (Cancellation) rate are shown in Table 6.
Effect on the total cost of advanced bases by changing D.O.A. and Installation Failure rates.
The Microsoft Excel solver tool was used with the evolutionary solving method to implement the model capable of minimizing the total cost for CDCs, thus changing the expected service level since the model is not linear, as arranged in Table 7.
An illustrative model of what has been presented here is available in Sassaki (2024).
Table 7 shows that the cost in regions in which there was lack was rather high, i.e. regions where the average daily revenue of customers transacting with the centers was elevated tend to have greater service level. Regarding the issue of the impact of annual cost on POS devices, there should be an efficient inventory policy aimed to reduce the number of POS devices in the SC, as shown in Table 8.
Table 8 shows that the average annual cost of POS devices was 58.68%, showing that it greatly affects the inventory policy. In addition to the great impact exerted by depreciation, the dollar exchange rate exerts great pressure on the item’s price, since it is traded in dollars. Therefore, the cost of freight and shortages are much less relevant than the annual cost of POS devices.
Seeking to exemplify how the proposed inventory policy varies over time, Table 9 shows the variation in target inventory of finished products, i.e. the inventory available in CDCs and DCs ready for installation at the customers’ location. For such a purpose, the target stock of the number of finished products was measured in days, i.e. the target stock measured in units was divided by the daily demand.
In Table 9, the variation of the target stock in the DCs can be seen as a function of the representativeness of stock mix. It can be understood by the fact that the variation in the repair center's production lead time exerts a significant influence on the days of stock coverage.
A sensitivity analysis was carried out to explore the effect of variation of representativeness parameters in the production mix and target stock of repair centers and DCs. Only these two parameters were used, since the acquisition of new POS devices is as a matter of fact the last resort in the stock mix due to its high cost.
Table 10 shows the target stock variation in DCs according to the mix of distribution and repair centers, and the 100% difference is the mix of acquisition of new POS devices. Thus, it is possible to verify that the greater representativeness of production in distribution centers, the smaller the need for inventory to satisfy demand is.
It should be noted that the inventory policy in multilevel acquisition marketing exerts great influence on the expected level of service for each region, as well as deviations in demand and lead time in the studied company. Unlike the inventory policy in CDCs, the inventory policy of DCs is directly related to the mix for making inventory available.
Therefore, the DC inventory policy is a consequence of the RL, and the production mix varies accordingly, i.e. the planner has little influence on altering the mix.
The safety stock increase at CDCs due to D.O.A. and installation failure rates are low, i.e. 0.5% and 2.1%, respectively. Therefore, a small increase in inventory and costs in the chain has led to mitigating the risk of stockout. However, a variation in the expected service level (inverse of the normal cumulative distribution) according to the result of acquisition, freight and shortage costs provided a reduction in inventory levels of approximately 4.9%, which is rather significant.
5 Conclusion
The general and specific objectives of this work have been fully achieved. Furthermore, a network design of the studied company was illustrated, and its SC was modelled according to the specificities of the acquisition market. The main variables affecting the design of an inventory policy for the studied company were also found, as well as their impacts if not considered.
The mathematical formulation of the main variables affecting the inventory policy of CDCs and distribution centers was made available. Ultimately, the computational results provided by the model were quite relevant, both from an academic and practical standpoint for the company under study, and its importance for establishing an inventory policy for the multilevel CLSC has been evidenced, thus guaranteeing the level of service expected by customers.
As suggestions for further research, it should be noted that some parameters, such as production lead time, repair center and transportation were considered constant, although there is the possibility of using different types of transportation, given the fact that costs change according to region, as well as deadlines. Moreover, there is the possibility of using express shipping to a given region instead of conventional shipping. For instance, let us consider a fictional example where conventional shipping costs R$20.00 within a six-day period, while express shipping costs R$80.00 for a two-day period.
In addition to transportation, repair centers can repair the POS devices in a shorter time by charging a fee based on the cost of repair. Thus, it is possible to evaluate the configuration of such factors affecting the total cost.
It is also suggested to use non-linear solvers, since the proposed model does not guarantee optimality. Allied to the adoption of mathematical models, it is suggested to use defined stock control parameters for applications in a command center, or control tower by means of triggers (intervention triggers) to assist in the CLSC decision-making process and monitor performance on daily basis. Then, it is assumed that it is possible to act with greater assertiveness in cases of stockout and, preferably, avoid them whenever necessary, thus collecting information in real time with an end-to-end view (point-to-point) of the SC.
Ultimately, the mathematical model should be applied in multi-echelon CLSC having similar characteristics, for instance in the pay-TV market that also provides a modem upon subscription to the package. As soon as customers terminate their contracts, modems are returned to CLSC to be sent to other customers.
Statement on Data Availability
The authors confirm that the data supporting the findings of this study are available within the article and/or its supplementary materials.
Acknowledgements
This research was supported by the Coordination for the Improvement of Higher Education Personnel (CAPES -001).
-
Financial support:
This research was supported by the Coordination for the Improvement of Higher Education Personnel (CAPES -001).
-
How to cite:
Sassaki, R. P., Rodríguez, E. C. A., Marins, F. A. S., & Chaves, A. A. (2024). Inventory policy using the Multi-Echelon Closed-Loop Supply Chain in the Acquisition Market. Gestão & Produção, 31, e0624. https://doi.org/10.1590/1806-9649-2024v31e0624
References
-
Ahmadini, A. A. H., Modibbo, U. M., Shaikh, A. A., & Ali, I. (2021). Multi-objective optimization modelling of sustainable green supply chain in inventory and production management. Alexandria Engineering Journal, 60(6), 5129-5146. http://doi.org/10.1016/j.aej.2021.03.075
» http://doi.org/10.1016/j.aej.2021.03.075 -
Aldrighetti, R., Battini, D., Ivanov, D., & Zennaro, I. (2021). Costs of resilience and disruptions in supply chain network design models: a review and future research directions. International Journal of Production Economics, 235, 108103. http://doi.org/10.1016/j.ijpe.2021.108103
» http://doi.org/10.1016/j.ijpe.2021.108103 -
Araya-Sassi, C., Paredes-Belmar, G., & Gutiérrez-Jarpa, G. (2020). Multi-commodity inventory-location problem with two different review inventory control policies and modular stochastic capacity constraints. Computers & Industrial Engineering, 143, 106410. http://doi.org/10.1016/j.cie.2020.106410
» http://doi.org/10.1016/j.cie.2020.106410 -
Becerra, P., Mula, J., & Sanchis, R. (2021). Green supply chain quantitative models for sustainable inventory management: A review. Journal of Cleaner Production, 328, 129544. http://doi.org/10.1016/j.jclepro.2021.129544
» http://doi.org/10.1016/j.jclepro.2021.129544 -
Chelly, A., Nouira, I., Frein, Y., & Hadj-Alouane, A. B. (2019). On the consideration of carbon emissions in modelling-based supply chain literature: the state of the art, relevant features and research gaps. International Journal of Production Research, 57(15-16), 4977-5004. http://doi.org/10.1080/00207543.2018.1497310
» http://doi.org/10.1080/00207543.2018.1497310 -
Chen, C., Zhang, G., & Xia, Y. (2019). Remanufacturing network design for dual-channel closed-loop supply chain. Procedia CIRP, 83, 479-484. http://doi.org/10.1016/j.procir.2019.04.132
» http://doi.org/10.1016/j.procir.2019.04.132 -
Chen, Y., & Chen, F. (2019). On the competition between two modes of product recovery: remanufacturing and refurbishing. Production and Operations Management, 28(12), 2983-3001. http://doi.org/10.1111/poms.13082
» http://doi.org/10.1111/poms.13082 -
Dev, N. K., Shankar, R., & Choudhary, A. (2017). Strategic design for inventory and production planning in closed-loop hybrid systems. International Journal of Production Economics, 183, 345-353. http://doi.org/10.1016/j.ijpe.2016.06.017
» http://doi.org/10.1016/j.ijpe.2016.06.017 -
Erraoui, Y., Charkaoui, A., & Echchatbi, A. (2019). Demand driven DRP: assessment of a new approach to distribution. International Journal of Supply and Operations Management, 6(1), 1-10. http://doi.org/10.22034/2019.1.1
» http://doi.org/10.22034/2019.1.1 -
Eruguz, A. S., Sahin, E., Jemai, Z., & Dallery, Y. (2016). A comprehensive survey of guaranteed-service models for multi-echelon inventory optimization. International Journal of Production Economics, 172, 110-125. http://doi.org/10.1016/j.ijpe.2015.11.017
» http://doi.org/10.1016/j.ijpe.2015.11.017 - Escorcia-Caballero, J. P., Amaya-Mier, R., Soto-Ferrari, M., & Chams-Anturi, O. (2020). Multi-echelon inventory management policies: a case study for a two-echelon supply chain. In International Conference on Industrial Engineering and Operations Management (pp. 165-175). São Paulo. IEOM Society International.
-
Firoozi, M., Babai, M. Z., Klibi, W., & Ducq, Y. (2020). Distribution planning for multi-echelon networks considering multiple sourcing and lateral transshipments. International Journal of Production Research, 58(7), 1968-1986. http://doi.org/10.1080/00207543.2019.1639841
» http://doi.org/10.1080/00207543.2019.1639841 -
Fofou, R. F., Jiang, Z., & Wang, Y. (2021). A review on the lifecycle strategies enhancing remanufacturing. Applied Sciences (Basel, Switzerland), 11(13), 5937. http://doi.org/10.3390/app11135937
» http://doi.org/10.3390/app11135937 -
Foroutan, R. A., Rezaeian, J., & Mahdavi, I. (2020). Green vehicle routing and scheduling problem with heterogeneous fleet including reverse logistics in the form of collecting returned goods. Applied Soft Computing, 94, 106462. http://doi.org/10.1016/j.asoc.2020.106462
» http://doi.org/10.1016/j.asoc.2020.106462 -
Fu, R., Qiang, Q. P., Ke, K., & Huang, Z. (2021). Closed-loop supply chain network with interaction of forward and reverse logistics. Sustainable Production and Consumption, 27, 737-752. http://doi.org/10.1016/j.spc.2021.01.037
» http://doi.org/10.1016/j.spc.2021.01.037 -
Godichaud, M., & Amodeo, L. (2015). Efficient multi-objective optimization of supply chain with returned products. Journal of Manufacturing Systems, 37, 683-691. http://doi.org/10.1016/j.jmsy.2014.12.004
» http://doi.org/10.1016/j.jmsy.2014.12.004 -
Govindan, K., Soleimani, H., & Kannan, D. (2015). Reverse logistics and closed-loop supply chain: A comprehensive review to explore the future. European Journal of Operational Research, 240(3), 603-626. http://doi.org/10.1016/j.ejor.2014.07.012
» http://doi.org/10.1016/j.ejor.2014.07.012 -
Hasanov, P., Jaber, M. Y., & Tahirov, N. (2019). Four-level closed loop supply chain with remanufacturing. Applied Mathematical Modelling, 66, 141-155. http://doi.org/10.1016/j.apm.2018.08.036
» http://doi.org/10.1016/j.apm.2018.08.036 -
Jackson, I., Tolujevs, J., & Kegenbekov, Z. (2020). Review of inventory control models: a classification based on methods of obtaining optimal control parameters. Transport and Telecommunication, 21(3), 191-202. http://doi.org/10.2478/ttj-2020-0015
» http://doi.org/10.2478/ttj-2020-0015 -
Kazemi, N., Modak, N. M., & Govindan, K. (2019). A review of reverse logistics and closed loop supply chain management studies published in IJPR: a bibliometric and content analysis. International Journal of Production Research, 57(15-16), 4937-4960. http://doi.org/10.1080/00207543.2018.1471244
» http://doi.org/10.1080/00207543.2018.1471244 -
Klosterhalfen, S. T., Willems, S. P., & Dittmar, D. (2023). Safety stock placement in supply chains with expediting. European Journal of Operational Research, 307(2), 745-757. http://doi.org/10.1016/j.ejor.2022.08.045
» http://doi.org/10.1016/j.ejor.2022.08.045 -
Mawandiya, B. K., Jha, J. K., & Thakkar, J. J. (2020). Optimal production-inventory policy for closed-loop supply chain with remanufacturing under random demand and return. Operations Research, 20(3), 1623-1664. http://doi.org/10.1007/s12351-018-0398-x
» http://doi.org/10.1007/s12351-018-0398-x -
Mishra, A., Dutta, P., Jayasankar, S., Jain, P., & Mathiyazhagan, K. (2023). A review of reverse logistics and closed-loop supply chains in the perspective of circular economy. Benchmarking, 30(3), 975-1020. http://doi.org/10.1108/BIJ-11-2021-0669
» http://doi.org/10.1108/BIJ-11-2021-0669 -
Musa, A., & Dabo, A. A. A. (2016). A review of RFID in supply chain management: 2000–2015. Global Journal of Flexible Systems Managment, 17(2), 189-228. http://doi.org/10.1007/s40171-016-0136-2
» http://doi.org/10.1007/s40171-016-0136-2 -
Oliveira, A. O., Oliveira, H. L. S., Gomes, C. F. S., & Ribeiro, P. C. C. (2019). Quantitative analysis of RFID’publications from 2006 to 2016. International Journal of Information Management, 48, 185-192. http://doi.org/10.1016/j.ijinfomgt.2019.02.001
» http://doi.org/10.1016/j.ijinfomgt.2019.02.001 -
Pacheco, E. D. O. (2017). Uma política de controle dinâmico de estoques em uma cadeia de suprimentos serial com incerteza na demanda de mercado usando eventos discretos (Tese de doutorado). Universidade Tecnológica Federal do Paraná, Curitiba. Retrieved in 2024, July 2, from http://riut.utfpr.edu.br/jspui/handle/1/2620
» http://riut.utfpr.edu.br/jspui/handle/1/2620 -
Prakash, S., Kumar, S., Soni, G., Jain, V., & Rathore, A. P. S. (2020). Closed-loop supply chain network design and modelling under risks and demand uncertainty: an integrated robust optimization approach. Annals of Operations Research, 290(1-2), 837-864. http://doi.org/10.1007/s10479-018-2902-3
» http://doi.org/10.1007/s10479-018-2902-3 -
Sassaki, R. P. (2024). Modelagem Rev.4 Retrieved in 2024, June 30, from https://docs.google.com/spreadsheets/d/1JO6raTSLlh02FNguo8SG31ijzlnS-DRh/edit?usp=sharing&ouid=116351587797470186956&rtpof=true&sd=true [Google Spreadsheet].
» https://docs.google.com/spreadsheets/d/1JO6raTSLlh02FNguo8SG31ijzlnS-DRh/edit?usp=sharing&ouid=116351587797470186956&rtpof=true&sd=true -
Sitcharangsie, S., Ijomah, W., & Wong, T. C. (2019). Decision makings in key remanufacturing activities to optimise remanufacturing outcomes: a review. Journal of Cleaner Production, 232, 1465-1481. http://doi.org/10.1016/j.jclepro.2019.05.204
» http://doi.org/10.1016/j.jclepro.2019.05.204 -
Van Engeland, J., Beliën, J., De Boeck, L., & De Jaeger, S. (2020). Literature review: strategic network optimization models in waste reverse supply chains. Omega, 91, 102012. http://doi.org/10.1016/j.omega.2018.12.001
» http://doi.org/10.1016/j.omega.2018.12.001 -
Zerhouni, H., Gayon, J. P., & Frein, Y. (2013). Influence of dependency between demands and returns in a reverse logistics system. International Journal of Production Economics, 143(1), 62-71. http://doi.org/10.1016/j.ijpe.2010.10.014
» http://doi.org/10.1016/j.ijpe.2010.10.014