Evolutionary patterns in squamate mitogenomes: Are selective regimes associated with fossoriality and limblessness?
Abstract
The snakelike phenotype is characterized by limb reduction and body elongation, and independently evolved in several vertebrate lineages. This phenotype is often interpreted as adaptive to fossoriality or use of complex habitats. Limblessness and fossoriality might impose different energetic requirements for locomotion, affecting selective rates on mitochondrial genes. Previous studies identified signals of differential selection in mitochondrial genes of limbless lizards and fossorial rodents. However, it remains unclear which of these factors most intensely shapes mitochondrial genome evolution in Squamata. Amphisbaenia is a key group to answer this question, as it is one of the largest lineages of limbless and fossorial squamates. Here we report a new complete mitochondrial genome of Amphisbaena alba and address the relationships between limblessness and fossoriality in the evolution of mitochondrial genes in Squamata. The full length of the A. alba mitochondrial genome was 16,800 bp (13 protein-coding genes, 22 transfer RNAs, two ribosomal RNAs and the control region). We performed selective tests, allowing different rates for clades with limbless and fossorial species separately. Fossorial species have significant changes in selective rates in more mitochondrial genes than the limbless species, a result suggesting fossoriality as a prevalent factor shaping selective pressures on mitochondrial genes.
Keywords:
Amphisbaena alba; limbless squamates; fossoriality; mitochondrial genomes; positive selection
Introduction
Squamata (snakes and lizards, including amphisbaenians) is the most specious order of terrestrial vertebrates, with remarkable morphological diversity, worldwide distribution, and specialization into several ecological settings (Vitt and Caldwell, 2013; Roll et al., 2017; Meiri, 2024). Perhaps the most striking and recurrent modification in the squamate bauplan involves evolutionary transitions from fully-limbed lacertiform morphologies to trunk-elongated and limbless forms (i.e., snakelike; Bergmann and Morinaga, 2019; Camaiti et al., 2021; Anelli et al., 2024). Limblessness evolved at least 26 times across the Squamata phylogeny (see Wiens et al., 2006; Miralles et al., 2015; Infante et al., 2018), including two specious clades, snakes (Serpentes, with almost 4200 species) and worm lizards (Amphisbaenia, with approximately 200 species), in addition to other lineages such as skinks (Scincidae) and glass lizards (Anguidae). Limbless trunk-elongated bodies provide flexibility and maneuverability during locomotion in complex environments (Van Damme and Vanhooydonck, 2002). While lacertiform lizards locomote using coordinated movements of their four limbs, the snakelike species move using particular undulation strategies along their axial skeleton (Bergmann and Morinaga, 2019; Bergmann et al., 2020). In this context, snakelike locomotion involves specific anatomical and physiological patterns (Gasc, 1981; Navas et al., 2004). The reduction of limb musculature and reliance on axial undulatory locomotion may impact metabolic demands, potentially imposing additional energetic costs (Escalante et al., 2021; Wu et al., 2022) and, consequently, driving shifts in selective pressures acting during the evolution of mitochondrial genes (Wang et al., 2021; Wu et al., 2022). Mitochondrial genes contribute for the biogenesis of the ATP-synthesizing machinery (Chen and Butow, 2005), and previous studies reported accelerated evolution in certain mitochondrial genes (e.g., ATP6 and ND2) among limbless squamates (e.g., Wang et al., 2021; Wu et al., 2022). Current literature encompasses a growing body of evidence suggesting that changes in locomotor behavior may also imprint detectable signatures in the mitochondrial genome, as reported for bats (Shen et al., 2010), birds (Shen et al., 2009), and fishes (Sun et al., 2011; Consuegra et al., 2015; Sebastian et al. 2020; Baltazar-Soares et al., 2021).
The evolution of limblessness in squamates is often associated with the occupation of subterranean niches and the emergence of taxa successfully adapted to a fossorial lifestyle, characterized by specialized features that enhance burrowing and movement underground (see Navas et al., 2004; Miralles et al., 2015; Anelli et al., 2024). Adaptations to subterranean environments entail notable physiological challenges, given the substantial energy expenditure associated with burrowing in low-oxygen conditions (Navas et al., 2004). Several studies demonstrated directional positive selection in mitochondrial genes among lineages that live underground (frequently in CYTB, but also in other mitochondrial genes; see Silva et al., 2009; Tomasco and Lessa, 2011, 2014; Gan et al., 2018; Tavares and Seuánez, 2018), but effects of these two features - fossoriality and limblessness - have not been evaluated together.
Molecular signatures in protein-coding mitochondrial genes of squamates represent a fascinating topic because mitogenomic patterns may reveal traces of evolutionary processes associated with fossoriality, limblessness, or a combined effect of both. The recurrent and convergent evolution of fossorial and limbless forms within Squamata constitutes a promising framework for exploring how locomotor adaptations and ecological specialization can shape the evolution of mitochondrial genomes. Similar to other vertebrates, the mitochondrial genomes of squamates correspond to the characteristic circular double-stranded DNA molecule that usually ranges from 16 to 19 kb in length. The strands are distinguished by their nucleotide composition: Heavy (H-strand) is guanine-rich, whereas Light (L-strand) is rich in cytosine (Chinnery and Hudson, 2013). Squamate genomes maintain a conserved genetic composition that comprises 13 protein-coding genes, 22 tRNAs, two rRNAs and a non-coding control region (Boore, 1999; Pereira, 2000). All 13 proteins encoded by the mitochondria are essential elements of the ATP-synthesizing machinery already experiencing significant positive selection, in collaboration with 80 additional proteins encoded by nuclear genes (Chen and Butow, 2005; Sun et al., 2011; Nabholz et al., 2012). Together, these proteins constitute the oxidative phosphorylation (OXPHOS) machinery (Wallace, 2005). Despite its importance in metabolism, we lack studies about the evolution of mitochondrial genes in fossorial and limbless squamates, and the question of which effects prevail during the evolution of mitochondrial genomes - if fossoriality or limblessness - remains unexplored in this clade.
Amphisbaenia is a key group to answer this type of question. These animals are limbless (except for the limb-reduced genus Bipes) and adapted to a fossorial lifestyle, being the most-specious squamate clade composed exclusively by snakelike and fossorial species (Kearney, 2003; Kearney and Stuart, 2004). Amphisbaenians are distributed across the Americas including the Caribbean, and also in Africa, Europe and Eastern Asia (Gans, 1990; Hembree, 2006). Their locomotor behavior has been studied since the 1960s (Gans, 1968), and they employ different undulatory mechanisms to propel their bodies through the substrate with their heads, a locomotion often referred to as ‘head-first burrowing’ (Navas et al., 2004; Hohl et al., 2014). Despite the long-standing interest in the morphology and biomechanics of amphisbaenians, genomic data remain scarce for this clade. To date, only eight complete mitochondrial genomes have been sequenced for the group, including a single species of the genus Amphisbaena (A. schmidti). Only one species has a complete nuclear genome available: Rhineura floridana. The scarcity of genomes available for amphisbaenians contrasts with the increased sequencing of genomes for snakes (mitochondrial genomes available for 137 species and complete nuclear genomes for 167 species) and other limb-reduced lizards in the past decade. Here, we report a new complete mitochondrial genome of Amphisbaena alba, a species with a neotropical distribution. We combined this new genome with other mitogenomes available for limbless and fossorial squamate species to investigate the interplay of selective pressures related to limblessness and fossoriality during the evolution of protein-coding mitochondrial genes in Squamata. These genetic signatures can provide insights into how terrestrial vertebrate species have adapted to diverse environmental niches, and also enable evaluation of the influence of morphological, locomotor and ecological diversification on the evolution of mitochondrial genes and cellular respiration.
Material and Methods
Amphisbaena alba mitochondrial genome assemblage: specimen collection, DNA extraction and sequencing
A specimen of Amphisbaena alba was collected at the University of São Paulo campus in Ribeirão Preto, Brazil (21.164286° S, 47.860122° W), and deposited in the Herpetological Collection of Ribeirão Preto (CHRP-USP, voucher CHRP 5531; collected on March 19, 2020 under Sisbio-Brazil Permit #33335-2). A liver tissue sample was extracted and stored at -80°C. Total genomic DNA was isolated using the DNeasy Tissue Kit from Qiagen (catalogue number 69504) following the manufacturer instructions. The DNA was subsequently sequenced across two lanes on an Illumina NovaSeq platform at a sequencing facility, generating a total of 253.7 million clusters (507.5 million paired-end reads, 150 bp each), resulting in an estimated genome coverage of approximately 50.7x. The sequencing quality was high, with 94.3% of reads achieving Q20 (99% accuracy) and 87.5% achieving Q30 (99.9% accuracy). After filtering low-quality reads, the complete mitochondrial genome was assembled de novo from the clean data using GetOrganelle v.1.7.7.0 (Jin et al., 2020). The genome assembly was performed using the animal mitochondrial workflow (-F animal_mt) with modified parameters (-r 40 -k 21, 45, 65, 85, 105 -w 50). The resulting mitogenome was annotated using the MitoAnnotator tool (Iwasaki et al., 2013) on the MitoFish server (http://mitofish.aori.u-tokyo.ac.jp). A subsequent BLAST search performed in the NCBI database (https://blast.ncbi.nlm.nih.gov/) revealed a close genetic relationship between A. alba and A. schmidti, the only other congeneric species with a mitochondrial genome available in the database.
Sequences for other squamate species and ecological and morphological classification
We downloaded all 308 mitochondrial genomes available for squamate species in the GenBank, excluding Gekkota and Dibamidae (see Table S1). We did not include the family Dibamidae, the earliest-diverging lineage within Squamata, due to the lack of information for this group, as currently no complete mitochondrial genomes are available for several species of Dibamidae in the NCBI database. A complete genome is available for Dibamus cf. smithi, which allows retrieving the mitochondrial genes of this species, but the clade is entirely limbless and therefore lacks comparable limbed species for meaningful within-group comparisons. The other lineage not included was Gekkota, because only one genome available represents a limbless fossorial species (Aprasia parapulchella), which would be paired with very distantly-related species and substantially increase the genetic divergence among the sampled taxa. Given that we already had assembled a very robust dataset compatible with the computational constraints of the analyses, and in order to avoid unnecessary phylogenetic heterogeneity and imbalance in taxon representation, we opted to not include Dibamidae and Gekkota and focus our analyses on the remaining squamate lineages, which match the premises established for our study.
In our analyses, we used two published phylogenies available for Squamata (Tonini et al., 2016; Title et al., 2024), which are based on mitochondrial and nuclear data. While Tonini et al. (2016) constructed a time-calibrated, fully sampled squamate phylogeny using taxonomic constraints, Title et al. (2024) generated a time-calibrated squamate phylogeny based on a phylogenomic backbone that includes only species with molecular data. We matched the species for which mitochondrial genomes are available to the corresponding lineages represented in each phylogeny.
To ensure consistency, some species names in the trees were updated based on GARD (Global Assessment Reptile Distribution, version 1.7; Roll et al., 2017; Caetano et al., 2022) and the Reptile Database (http://www.reptile-database.org; Uetz et al., 2025). Species that were not represented in the phylogenies were excluded. In genera represented by several species, we limited sampling to three species that represented the most-distantly related species within the genus. The analyses of selection regimes impose computational limits due to the exponential increase in model complexity and likelihood calculations, so we analyzed a subset of the total species database we assembled, maintaining all lineages representing fossoriality and/or limblessness. Each focal species was paired with an equal number of closely-related species limbed and non-fossorial, controlling for unequal taxon sampling. Sea snakes were excluded from the dataset to avoid confusion in the ecological classification regarding fossoriality. The final dataset comprised 55 species, and we pruned both phylogenies to match that reduced dataset. Given that both topologies remained identical when using the 55 species, we performed all analyses using the hypothesis published by Title et al. (2024).
Finally, we classified the 55 species from the reduced dataset according to their fossoriality and limblessness (Figure 1), following Cyriac and Kodandaramaiah (2018). For species not included in that study (Cyriac and Kodandaramaiah, 2018), we obtained information from the IUCN Red List of Threatened Species and additional literature (e.g., Bars-Closel et al., 2017; Anelli et al., 2024). For the analyses, we considered two classifications: one distinguishing between fossorial and non-fossorial species, and another separating fully-limbed from limbless (or limb-reduced) species.
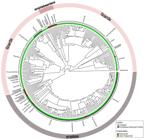
Phylogeny of Squamata from Title et al. (2024) including 308 species from 43 families. The most external ring indicates the main lineages (snakes, lizards, and amphisbaenians); inner rings represent families.
Mitogenome structures
To compare the mitogenome structure of Amphisbaena alba with that of other amphisbaenians, we analyzed all mitochondrial genomes available for the group in our dataset using the MitoFish server. The analyzed species included Amphisbaena schmidti, Bipes biporus, Bipes canaliculatus, Bipes tridactylus, Diplometopon zarudnyi, Geocalamus acutus, and Rhineura floridana (from Macey et al., 2004), as well as Blanus cinereus (from Albert et al., 2009). In addition, we included Lacerta agilis (NC_021766.1) as an outgroup. The MitoFish analysis provided genome sizes, GC content, and gene order for all species.
Correlations between mitogenomes, fossoriality and limblessness
We first generated independent alignments of the 13 protein-coding genes (PCGs) using MAFFT v7.526 (Katoh and Standley, 2013). The resulting alignments were subsequently inspected and manually trimmed in SeaView v5.0.5 (Gouy et al., 2010). To improve alignment accuracy and minimize potential frameshifts or misalignments in poorly conserved regions, sequences were translated into amino acids and realigned at the protein level using SeaView (Gouy et al., 2010).
Associations between limblessness and fossoriality and shifts in evolutionary rates at specific amino-acid sites were tested using TraitRateProp (Karin et al., 2017). Species exhibiting the foreground trait were coded as ‘1’, whereas all other species were coded as ‘0’. The analyses were performed on nucleotide sequences translated into amino-acid sequences.
Analyses of selection regimes
Considering that the substitutional saturation can potentially bias molecular evolutionary inferences (especially in rapidly-evolving mitochondrial genes, which may evolve up to 25 times faster than nuclear loci in amphibians and reptiles; see Lynch et al. 2006), first we evaluated saturation levels to ensure the robustness of selective estimates. We assessed substitution saturation using the iss (index of substitution saturation) statistics implemented in DAMBE (Xia and Xie, 2001; Xia et al., 2003; Xia and Lemey, 2009). The proportion of invariant sites required for the analysis was also estimated using DAMBE.
Then, we tested the effects of the limbless morphology and the fossorial habit in selective regimes acting on the evolution of mitogenomes in Squamata using the ete-evol module of the ETE Toolkit Python environment (v. 3.0.0b35; Huerta-Cepas et al., 2016), which implements the CODEML program from the PAML package (Yang, 2007). As the ETE Toolkit estimates branch-specific ω values, the ETE annotations on the phylogeny were consolidated into uniform category markings. A subsequent analysis was then performed using CODEML in PAML v4.10.9, in which a single ω value was estimated for all species sharing the focal trait (limbless, fossorial, or limbless-fossorial). The analyses were performed for each gene separately as well as for the concatenated dataset of all genes together (hereafter referred to as “ALL”). We fixed the topology from Title et al. (2024) without branch lengths, as these were subsequently estimated during the PAML analyses.
The ω ratio, calculated as the ratio of non-synonymous to synonymous substitution rates (dN/dS), estimates the type of selection acting on protein-coding sequences, where ω < 1 means purifying selection, ω = 1 corresponds to neutral evolution, and ω > 1 is interpreted as positive selection (Yang, 2007). We first ran the one-rate model (M0), in which a single ω value is estimated for the entire phylogeny. We also ran the M0 model with ω fixed at 1 to test whether the gene evolved under non-neutral selection. To specifically assess whether only the foreground branches evolved under non-neutral selection (ω ≠ 1), we used the b_neut model (where ω_foreground = 1 and ω_background is estimated). Finally, we applied the b_free model, which allows independent estimation of ω for both foreground and background branches (see Yang and Nielsen, 2002; Huerta-Cepas et al., 2016), to test for differences in selective regimes between these lineages.
To confirm our results, particularly for potentially saturated genes, we also performed branch-site model analyses, as previous studies suggest that this type of analysis is robust even for saturated genes (Gharib and Robinson-Rechavi, 2013). The branch-site model tests foreground branches and also classifies sites into two or three categories of different ω values. We generated input files for PAML using ETE3, and labeled the trees so that the same parameters were estimated for the foreground lineages. We then ran analyses in PAML, testing the bsC versus M1 and the bsD versus M3 models. In the bsC-M1 comparison, the null model (M1) assumes two site classes with ω ≤ 1 across all branches, whereas the alternative branch-site model (bsC) allows an additional class of sites on the foreground branches with ω > 1, thus explicitly testing for positive selection on a subset of sites in the target lineages (Yang and Nielsen, 2002). In the bsD-M3 comparison, the null model (M3) allows several site classes with different ω values shared across all branches, while the branch-site model (bsD) allows the foreground branches to have their own ω distribution, with an extra class of sites potentially evolving with ω > 1, thereby providing a more flexible test of lineage-specific shifts in selective regimes (Yang and Nielsen, 2002; Bielawski and Yang, 2004).
Model comparisons were performed using likelihood ratio tests (LRTs), in which twice the difference in log-likelihoods (2ΔlnL) between nested models was compared to a chi-square (χ²) distribution, with degrees of freedom corresponding to the difference in the number of estimated parameters (np) between models (see Yang, 2007). All calculations were carried out using Google Sheets formulas. LRTs were performed to compare a neutral model (M0, ω = 1) with the M0 non-neutral model (M0). We also compared the foreground non-neutral model (b_neut, where ωforeground = 1) with an alternative model (b_free) that allows ωforeground ≠ 1 and ωforeground ≠ ωbackground (see Yang and Nielsen, 2002; Huerta-Cepas et al., 2016). Next, we tested whether ω values differed between the foreground and the remaining branches (background) by comparing the fit of the b_free model with the fit of a one-rate model (M0), in which a single ω value is estimated for the entire phylogeny. These analyses were performed on three datasets: (1) limbless versus limbed lineages, (2) fossorial versus non-fossorial lineages, and (3) only limbless versus only fossorial versus lineages that are both limbless and fossorial.
Subsequently, we applied the RELAX method (Wertheim et al., 2015), implemented in HyPhy (Pond et al., 2005, 2020), to assess shifts in the intensity of selection (relaxation or intensification) in the foreground lineages, using the default parameters. RELAX compares a null codon model, consisting of three ω classes across the phylogeny, with an alternative model that allows relaxed or intensified selection (see Wertheim et al., 2015). This involves the parameter k, which quantifies the selection intensity relative to the reference branches, where k > 1 corresponds to intensified selection relative to the background and k < 1 indicates relaxed selection relative to the background. LRTs were then performed to compare the fit between the null and alternative models (Wertheim et al., 2015). Because RELAX only accepts two categories, analyses were performed for (1) limbless versus limbed lineages and (2) fossorial versus non-fossorial lineages. Results were visualized and interpreted using HyPhy Vision (Pond et al., 2020).
For the PAML analyses, we applied the same mathematical basis used in RELAX to derive a descriptive log-transformed scaling parameter [ln(ωforeground) / ln(ωbackground)], which we hereafter refer to as R (a ratio analogous to the selection intensity parameter k in RELAX). In RELAX, this transformation is applied to three ω categories corresponding to different site classes. However, it was necessary to simplify our R estimates because PAML provides a single overall ω estimate, rather than multiple ω categories. The parameter R was calculated to facilitate graphical visualization of foreground ω estimates relative to the background. Like the k parameter, R quantifies the selection intensity relative to the background branches, where k > 1 indicates intensified selection and k < 1 corresponds to relaxed selection. For the PAML branch-site analyses, the R value was calculated for the third site class, which corresponds to sites that differ between background and foreground lineages. Given the substantially increased number of parameters in this analysis, we avoided performing separate analyses for each foreground group, as this would further inflate model parameterization and complexity, potentially reducing computational tractability and the reliability of parameter estimation.
Results
Organization and characteristics of the mitochondrial genome of Amphisbaena alba
The total length of the mitochondrial genome of A. alba was established in 16,800 base pairs (GenBank accession number: PZ210514), with a GC content of 46% (Figure 2). Genome size and associated information for the data retrieved for other amphisbaenians and other squamate clades are reported in the Table S1 and Figures S1 and S2. These genomes have the typical circular organization observed in vertebrates, and contain 13 protein-coding genes (ND1-6, ND4L, COI-III, CYTB, ATP6, and ATP8), 22 transfer RNAs, two ribosomal RNA genes (12s rRNA and 16s rRNA), and a control region (D-loop). Among these, ND6 and eight tRNAs (tRNAGln, tRNAAla, tRNAAsn, tRNACys, tRNATyr, tRNASer, tRNAGlu, and tRNAPro) are encoded on the light strand, while the remaining genes are encoded on the heavy strand.

Circular visualization map of the complete mitochondrial genome of Amphisbaena alba created by Chloroplot. The external color circle shows the gene map (PCGs, rRNAs, tRNAs); in the innermost circle, dark gray lines represent higher GC% per 5bp of the mitogenome; the darker the lines are, the higher is their GC% content.
Correlations between mitogenomes, fossoriality and limblessness
TraitRateProp analyses suggested associations between shifts in evolutionary rates and limblessness (p-values < 0.001) and fossoriality (p-values < 0.041) (Table 1). However, we found no evidence of specific amino acid substitutions consistently associated with any of these traits (empirical posterior Bayes < 1; Figure S3).
Results of RateTraitProp analyses testing for trait-associated rate variation in mitochondrial genes of squamate species. For each gene, comparisons between the alternative model (trait-dependent rates) and the null homogeneous-rate model (M0) are shown for limbless and fossorial lineages. Reported values include the log-likelihood of the alternative model (lnL_alt), the log-likelihood of the null model (lnL_M0), the likelihood ratio test statistic (D = 2ΔlnL), and the corresponding p-value (p). Significant p-values (p < 0.05) indicate support for trait-associated shifts in evolutionary rates.
Selection regimes in limbless and fossorial squamates
For most species, the analyses of substitution saturation indicated values of the index of substitution saturation (iss) that were significantly lower than the corresponding critical iss.c thresholds under both symmetrical and asymmetrical topology assumptions, indicating little substitution saturation. However, two genes (ATP8 and ND6) exhibited iss values exceeding the critical iss.c under both symmetrical and asymmetrical topologies for most species (Table S2). When considering only asymmetrical topologies, a larger number of genes exhibited iss values exceeding the critical iss.c: ND2, ND3, ND4, ND4L, and ND5.
In the CodeML/PAML branch model analyses (b_free vs M0), when all genes were analyzed together, selection ratios (ω) differed significantly between limbless and the background lineages (p = 0.0025) and between fossorial and the background lineages (p < 0.001), as illustrated in Figure 3 A . Notably, limbless lineages exhibited higher ω values than the background, indicating relaxed selection (ωbackground = 0.0782; ωforeground = 0.0831; R = 0.9761), whereas fossorial lineages showed lower ω values, consistent with intensified selection (ωbackground = 0.0844; ωforeground = 0.0761; R = 1.0417). However, in gene-by-gene analyses, we identified higher ω values (i.e., weaker purifying selection) in limbless species than in limbed species for the genes ATP6, CYTB, and ND5 (0.897 < R < 0.977; p-values for these genes lower than 0.032), whereas lower ω values (i.e., stronger purifying selection) were observed in the genes ND1 and ND2 in limbless lineages (1.082 < R < 1.087; p-values for these genes lower than 0.006). We did not identify significant differences between these two groups in the remaining genes (p-values for these genes larger than 0.140). In contrast, in comparisons addressing fossoriality, we identified strong evidence for purifying selection in the foreground lineages (fossorial) in nearly all genes (ATP6, COX1, COX2, COX3, ND1, ND2, ND3, ND4, ND4L, and ND6; 1.050 < R < 1.240; p-values for these genes lower than 0.026).These results are detailed in Table S3.

Results of PAML analyses. Log-ratio of selective rates [R = ln(ω_foreground) / ln(ω_background)] comparing ω values between foreground and background lineages. Grey circles indicate the genes with non-significant results (p > 0.05). (A) Comparison between branch models (M0 vs b_free); (B) branch-site model comparison between M1 and bsC; (C) branch-site model comparison between M3 and bsD. The first row corresponds to limbless species, the second to fossorial species, and the third separates species into limbless (squares), fossorial (triangles), and limbless-fossorial (diamonds) groups.
When lineages were partitioned into four groups (background, fossorial, limbless, and limbless-fossorial), the differences remained highly significant when all genes were analyzed together (p < 0.0001; see Table S3). Consistently, the group exhibiting the strongest selective constraint (i.e., the lowest ω value) was the fossorial-only group, which in our dataset is represented solely by Plestiodon egregious (ω = 0.062; R = 1.096), followed by limbless-fossorial species (ω = 0.077; R = 1.012). In contrast, we found more evidence for relaxed selection (R = 0.944) in limbless species (ω = 0.091) compared to the background (ω = 0.079). When analyses were performed on individual genes, almost all tests indicated significant differences in ω values among groups (p < 0.024), except for ND3 (p = 0.120). Notably, we found evidence of intensification of selection in nearly all genes in the limbless-fossorial group (1.010 < R < 1.158), except for CYTB and ND5 (R < 0.949). In the fossorial-only group, analyses suggested intensification of selection in eight genes (ATP6, ATP8, COX1, COX2, COX3, ND4, ND4L, and ND6; 1.051 < R < 2.628), whereas this type of selection was identified in only three genes (ATP8, ND1, and ND2; 1.013 < R < 1.277) in the limbless-only group.
When limbless groups were analyzed separately using concatenated genes, we detected significant differences among clades in the ω values (p < 0.0001; Table S4). The strongest signal of purifying selection was identified in Isopachys gyldenstolpei (ω = 0.050; R = 1.175), followed by the clade Amphisbaenia (ω = 0.074; R = 1.024), whereas snakes (ω = 0.088; R = 0.955) and species of the Anguinae subfamily (ω = 0.083; R = 0.976) exhibited ω values closer to neutrality than those associated to the background (ω = 0.079). In the analyses focusing on fossoriality, we only detected ω values larger than those of the background (ω = 0.085) in the genera Achalinus (ω = 0.096; R = 0.948) and Calamaria (ω = 0.094; R = 0.958), whereas all other fossorial clades exhibited stronger signal of purifying selection than the non-fossorial lineages. The lowest ω value, which indicates stronger selection, was observed in the species Isopachys gyldenstolpei (ω = 0.0496; R = 1.217), followed by Xenopeltis unicolor (ω = 0.060; R = 1.142), Plestiodon egregius (ω = 0.061; R = 1.135), Anilius scytale (ω = 0.067; R = 1.096), Cylindrophis ruffus (ω = 0.069; R = 1.083), the clades Amphisbaenia (ω = 0.074; R = 1.056) and Scolecophidia (ω = 0.077; R = 1.036), and the snake Micrurus fulvius (ω = 0.078; R = 1.033).
The results from analyses using the branch-site model were largely consistent when species were divided into four groups (limbless-only, fossorial-only, and limbless-fossorial and background; see Figures 3 B and 3C and Table S5). All p-values from comparisons between the null model (M1) and the alternative model bsC (which estimates different ω values for the groups) were statistically significant (p < 0.05). Here we focus on the results from the comparison between null model M3 and the alternative model bsD (different ω values for the groups); only comparisons related to the genes COX1, ND1, ND2, ND4L, and ND5 were not statistically different (p > 0.0578). Among the other genes, four (ATP8, CYTB, ND3, and ND5) exhibited a subset of sites with stronger signal for selective regimes in limbless lineages than in the background. In fossorial lineages, we detected evidence of sites evolving under stronger selection in seven genes (ATP6, ATP8, COX2, COX3, ND3, ND4, and ND5), whereas in limbless-fossorial lineages this pattern was detected in five genes (ATP8, COX2, COX3, ND3, and ND4). In the concatenated analysis, we identified higher ω values in limbless-only and fossorial-only groups (R = 1.023 and R = 1.185, respectively), whereas rates associated with the limbless-fossorial group were more nearly neutral (R = 0.951).
The RELAX analyses revealed that limbless species exhibited lower ω values in ATP6, COX1, COX2, CYTB, and ND5, suggesting stronger purifying selection acting on these mitochondrial genes. Similarly, fossorial species showed decreased ω values in ATP6, ATP8, CYTB, and ND5 (Figure S4 and Table S6).
Discussion
In this study, we combined a newly generated mitochondrial genome of Amphisbaena alba with other genomes available for Squamata and applied comparative analyses to evaluate how limblessness and fossoriality shaped mitochondrial genome evolution in the clade. As a result, we identified significant changes in selective rates in a larger number of mitochondrial genes associated with fossoriality, when compared to limblessness, suggesting this ecological shift as a prevalent factor shaping selective pressures on mitochondrial genes. The mitochondrial genome of A. alba that we sequenced has 16,800 base pairs and a GC content of 46%, with the typical circular organization observed in reptiles and the same gene arrangement reported for other squamates. Based on genome sizes available in GenBank, the assembled mitogenome falls within the range reported for other amphisbaenians (16.2 kb in Bipes canaliculatus to 17.4 kb in Amphisbaena schmidti) and other squamates (12.6 kb in Phrynocephalus maculatus to 26.3 kb in Hydrophis ornatus), although these values may be slightly under- or overestimated. Similarly, the GC content is also consistent with values inferred for other amphisbaenians (41-47%). The consistency in genome size with other squamate species supports the reliability of our assembly and suggests that A. alba does not deviate from the typical mitogenomic architecture observed in Squamata.
The gene order in vertebrate mitogenomes is as conserved as their gene content; nevertheless, diverse types of rearrangements - such as gene transpositions, inversions, duplications, and losses - have been documented across a wide range of taxa (see Mindell et al., 1998; Boore, 1999; Boore and Brown, 1998; Zhong et al., 2005; Zhang et al., 2021). Here, we also analyzed the mitogenome of one amphisbaenian recently sequenced, Blanus cinereus, that was not included in the comparative studies aforementioned, and we did not identify any structural rearrangement in this species. Macey et al. (2004) investigated the evolution of mitochondrial DNA structural features among amphisbaenians and identified several remarkable genomic configurations. In contrast to most vertebrates, Rhineura floridana (family Rhineuridae) exhibits an inversion in which the ND6-tRNA Glu block shifted in order with the CYTB-tRNA Thr -tRNAPro block, a gene arrangement that closely resembles that found in birds (Mindell et al., 1998; Macey et al. 2004). In the Bipedidae, a derived mitochondrial gene organization has evolved through a shift involving tRNA Glu and nad6. Moreover, Bipes biporus shows a tandem duplication of tRNA Thr and tRNA Pro (Macey et al., 2004). Structural genomic variations reflect functional and evolutionary constraints and can arise from transcriptional or replication-related processes (Boore, 2000; Gissi et al., 2008). They may profoundly affect gene expression and replication, but the functional consequences of that merit further investigation (Gissi et al., 2008).
Modifications in the evolutionary dynamics of mitochondrial proteins seem associated with lineages that likely experienced shifts in energy metabolism linked to changes in locomotor habits, as those derived from processes of limb reduction and loss (Wang et al., 2021; Wu et al. 2022), and to ecological transitions, including fossoriality (Silva et al., 2009; Tomasco and Lessa, 2011, 2014; Gan et al., 2018; Tavares and Seuánez, 2018). Our analyses corroborate the hypothesis that fossorial and limbless squamate lineages experienced particular selective regimes acting on the evolution of mitochondrial protein-coding genes. However, while we identified heterogeneous patterns in limbless lineages when compared to their fully-limbed counterparts - ranging from relaxed selection to stronger selection, and also no detectable differences - the trends associated with fossorial lineages were remarkably more consistent, as analyses supported intensification of selective pressures for most genes in this group when compared to non-fossorial groups.
When all genes were considered together, we identified strong selectiveness in the mitogenomes of the fossorial group, followed by limbless-fossorial lineages. In contrast, the analyses suggested relaxed selection in limbless squamate lineages relative to the background. Adaptation to fossoriality may be associated with intensified purifying selection on mitochondrial function, possibly reflecting the increased energetic demands of a burrowing lifestyle (Abe and Johansen, 1987). Depending on how deep the animals burrow, it is possible that they face reduced oxygen percentages in the underground environment (Lacey, 2000; Vihar et al., 2015); the intensified purifying selection in the mitogenomes of these species may relate to increased tolerance to hypoxia (Begall et al., 2007; Luo et al., 2008; Davies et al., 2015; Tavares and Seuánez, 2018) and enhanced capacities for sustained muscular activity underground (Klein and Codd, 2010). Besides, subterranean habitats impose other physiological challenges, such hypercapnia [high carbon dioxide - CO2], high humidity, and limited or no exposure to sunlight (Nevo, 1979; de Vries et al., 2008; Davies et al. 2015). Amphisbaena alba exhibits high concentrations of myoglobin in skeletal muscles and the heart (Weber et al., 1981), and the process of modifying the mitochondrial inner compartment limiting membrane into a lamellated body during the initial stages of the erythroid cell maturation seems to be slower in this amphisbaenian when compared to snakes (Spadacci-Morena et al., 1998). Although scarce, the existing information about energetic relationships in amphisbaenians supports functional interpretations of selective pressures associated with fossoriality during the evolution of mitochondrial genomes in Squamata.
The reduction or complete loss of limbs also may impose additional energetic costs to locomotion, regardless of fossoriality or not (Escalante et al., 2021; Wang et al., 2021; Wu et al., 2022). Previous studies reported accelerated evolution in ATP6 among limbless lineages in Squamata (Wang et al., 2021), and positive selection has also been detected in the gene ND2 of limbless skinks, when compared to limbed relatives (Wu et al., 2022). However, our results suggest that signals of positive selection are stronger in fossorial lineages, when compared to limbless species, given the larger number of genes identified as evolving under non-neutral regimes in fossorial squamates. This finding might relate to the great energetic demands of burrowing (i.e., fossoriality), which may overlap those involved in locomotion over the surface by limbless lineages. Moreover, while we identified signals of relaxed purifying selection in several loci of the mitogenome in limbless squamates, in fossorial lineages our results provide widespread evidence of intensified selection, supporting the idea that burrowing imposes consistent energetic challenges that shape the evolutionary trajectory of mitochondrial genes. Signal of intensified selection was particularly evident in limbless-fossorial species, with most protein-coding genes supporting stronger selection relative to the background. This pattern aligns with previous studies showing that the hypoxic and energetically demanding subterranean environments can drive adaptive shifts in mitochondrial function across diverse vertebrate groups (e.g., Silva et al., 2009; Tomasco and Lessa, 2011, 2014; Gan et al., 2018; Tavares and Seuánez, 2018). Our study suggests that the combination of ecological and morphological specialization in limbless-fossorial lineages may drive the strongest signal of selection in the mitogenomes of Squamata. Overall, our findings suggest that fossoriality exerts a more decisive influence than limb loss to establish the selective regimes acting during the evolution of mitochondrial genomes in Squamata, with potential implications for understanding how interactions among ecological pressures and morphological specializations shape the molecular evolution of squamates. Future studies integrating physiological performance, nuclear-mitochondrial interactions, and population-level data may further elucidate the mechanisms integrating ecology and mitochondrial genome evolution.
By including a newly sequenced mitochondrial genome of Amphisbaena alba into comparative analyses across Squamata, we identified a strong and more pervasive influence of fossoriality in the evolution of mitochondrial genes, which surpasses the impact of limblessness alone. Our findings highlight the importance of ecological settings shaping selective regimes during mitogenome evolution, and suggest that lifestyle-driven energetic constraints may play a key role during the repeated evolution of extreme body plans in vertebrates.
Supplementary material
The following online material is available for this article:
Figure S1 -
Figure S2 -
Figure S3 -
Figure S4 -
Table S1 -
Table S2 -
Table S3 -
Table S4 -
Table S5 -
Table S6 -
Acknowledgements
We thank Dr. Rafael Silva Rocha and Dr. Maria Eugenia Guazzaroni for granting access to laboratory facilities and infrastructure essential for this study. This study was supported by a FAPESP-Brazil fellowship to AGP (2019/21712-5) and a FAPESP-Brazil Thematic Grant awarded to TK (2020/14780-1), and a CNPq productivity fellowship awarded to TK (304170/2022-4). This work was also supported by a Research Grant from Human Frontier Science Program Organization - HFSP (Ref.-No: RGP013/2025) with the award DOI https://doi.org/10.52044/HFSP.RGP0132025.pc.gr.230122.
References
- Abe AS and Johansen K (1987) Gas exchange and ventilatory responses to hypoxia and hypercapnia in Amphisbaena alba (Reptilia: Amphisbaenia). J Exp Biol 127:159-172.
- Albert EM, San Mauro D, García-París M, Rüber L and Zardoya R (2009) Effect of taxon sampling on recovering the phylogeny of squamate reptiles based on complete mitochondrial genome and nuclear gene sequence data. Gene 441:12-21.
- Anelli V, Bars-Closel M, Herrel A and Kohlsdorf T (2024) Different selection regimes explain morphological evolution in fossorial lizards. Funct Ecol 38:1250-1264.
- Baltazar-Soares M, de Araújo Lima AR and Silva G (2021) Targeted sequencing of mitochondrial genes reveals signatures of molecular adaptation in a nearly panmictic small pelagic fish species. Genes 12:91.
- Bars-Closel M, Kohlsdorf T, Moen DS and Wiens JJ (2017) Diversification rates are more strongly related to microhabitat than climate in squamate reptiles (lizards and snakes). Evolution 71:2243-2261.
- Begall S, Burda H and Schleich CE (2007). Subterranean rodents: News from underground. In: Begall S, Burda H and Schleich CE (eds). Subterranean rodents: News from underground. Springer, Berlin, pp 3-9.
- Bergmann PJ and Morinaga G (2019) The convergent evolution of snake-like forms by divergent evolutionary pathways in squamate reptiles. Evolution 73:481-496.
- Bergmann PJ, Mann SD, Morinaga G, Freitas ES and Siler CD (2020) Convergent evolution of elongate forms in craniates and of locomotion in elongate squamate reptiles. Integr Comp Biol 60:190-201.
- Bielawski JP and Yang Z (2004) A maximum likelihood method for detecting functional divergence at individual codon sites, with application to gene family evolution. J Mol Evol 59:121-132.
- Boore JL (1999) Animal mitochondrial genomes. Nucleic Acids Res 27:1767-1780.
- Boore JL (2000) The duplication/random loss model for gene rearrangement exemplified by mitochondrial genomes of deuterostome animals. In: Sankoff D and Nadeau JH (eds). Comparative genomics: Empirical and analytical approaches to gene order dynamics, map alignment and the evolution of gene families. Springer, Dordrecht, pp 133-147.
- Boore JL and Brown WM (1998) Big trees from little genomes: Mitochondrial gene order as a phylogenetic tool. Curr Opin Genet Dev 8:668-674.
- Caetano GH, Chapple DG, Grenyer R, Raz T, Rosenblatt J, Tingley R, Böhm M, Meiri S and Roll U (2022) Automated assessment reveals that the extinction risk of reptiles is widely underestimated across space and phylogeny. PLoS Biol 20:e3001544.
- Camaiti M, Evans AR, Hipsley CA and Chapple DG (2021) A farewell to arms and legs: A review of limb reduction in squamates. Biol Rev 96:1035-1050.
- Chen XJ and Butow RA (2005) The organization and inheritance of the mitochondrial genome. Nat Rev Genet 6:815-825.
- Chinnery PF and Hudson G (2013) Mitochondrial genetics. Br Med Bull 106:135-159.
- Consuegra S, John E, Verspoor E and de Leaniz CG (2015) Patterns of natural selection acting on the mitochondrial genome of a locally adapted fish species. Genet Sel Evol 47:58.
- Cyriac VP and Kodandaramaiah U (2018) Digging their own macroevolutionary grave: Fossoriality as an evolutionary dead end in snakes. J Evol Biol 31:587-598.
- Davies KT, Bennett NC, Tsagkogeorga G, Rossiter SJ and Faulkes CG (2015) Family wide molecular adaptations to underground life in African mole-rats revealed by phylogenomic analysis. Mol Biol Evol 32:3089-3107.
- Escalante I, Ellis VR and Elias DO (2021) Leg loss decreases endurance and increases oxygen consumption during locomotion in harvestmen. J Comp Physiol A 207:257-268.
- Gan HM, Tan MH, Lee YP, Schultz MB, Horwitz P, Burnham Q and Austin CM (2018) More evolution underground: Accelerated mitochondrial substitution rate in Australian burrowing freshwater crayfishes (Decapoda: Parastacidae). Mol Phylog Evol 118:88-98.
- Gans C (1968) Relative success of divergent pathways in amphisbaenian specialization. Am Nat 102:345-362.
- Gans C (1990) Patterns in amphisbaenian biogeography: A preliminary analysis. In: Peters G and Hutterer R (eds). Vertebrates in the tropics. Alexander Koenig Zoological Research Institute and Zoological Museum, Bonn, pp 133-143.
- Gasc JP (1981) Axial musculature. In: Gans C and Parsons TS (eds). Biology of the Reptilia. Academic Press, New York, vol. 11, pp 335-435.
- Gharib WH and Robinson-Rechavi M (2013) The branch-site test of positive selection is surprisingly robust but lacks power under synonymous substitution saturation and variation in GC. Mol Biol Evol 30:1675-1686.
- Gissi C, Iannelli F and Pesole G (2008) Evolution of the mitochondrial genome of Metazoa as exemplified by comparison of congeneric species. Heredity 101:301-320.
- Gouy M, Guindon S and Gascuel O (2010) SeaView version 4: A multiplatform graphical user interface for sequence alignment and phylogenetic tree building. Mol Biol Evol 27:221-224.
- Hembree DI (2006) Amphisbaenian paleobiogeography: Evidence of vicariance and geodispersal patterns. Palaeogeogr Palaeoclimatol Palaeoecol 235:340-354.
- Hohl LSL, Loguercio MFC, Buendía RA, Almeida‐Santos M, Viana LA, Barros‐ Filho JD and Rocha‐Barbosa O (2014) Fossorial gait patterns and performance of a shovel‐headed amphisbaenian. J Zool 294:234-240.
- Huerta-Cepas J, Serra F and Bork P (2016) ETE 3: Reconstruction, analysis, visualization of phylogenomic data. Mol Biol Evol 33:1635-1638.
- Infante CR, Rasys AM and Menke DB (2018) Appendages and gene regulatory networks: Lessons from the limbless. Genesis 56:e23078.
- Iwasaki W, Fukunaga T, Isagozawa R, Yamada K, Maeda Y, Satoh TP, Sado T, Mabuchi K, Takeshima H, Miya M et al (2013) MitoFish and MitoAnnotator: A mitochondrial genome database of fish with an accurate and automatic annotation pipeline. Mol Biol Evol 30:2531-2540.
- Jin JJ, Yu WB, Yang JB, Song Y, DePamphilis CW, Yi TS and Li DZ. (2020) GetOrganelle: A fast and versatile toolkit for accurate de novo assembly of organelle genomes. Genome Biol 21:241.
- Karin EL, Wicke S, Pupko T and Mayrose I (2017) An integrated model of phenotypic trait changes and site-specific sequence evolution. Syst Biol 66:917-933.
- Katoh K and Standley DM (2013) MAFFT multiple sequence alignment software version 7: Improvements in performance and usability. Mol Biol Evol 30:772-780.
- Kearney M (2003) Systematics of the Amphisbaenia (Lepidosauria: Squamata) based on morphological evidence from recent and fossil forms. Herpetol Monogr 17:1-74.
- Kearney M and Stuart BL (2004) Repeated evolution of limblessness and digging heads in worm lizards revealed by DNA from old bones. Proc R Soc Lond B Biol Sci 271:1677-1683.
- Klein W and Codd JR (2010) Breathing and locomotion: Comparative anatomy, morphology and function. Respir Physiol Neurobiol 173:S26-S32.
- Lacey EA (2000) Life underground: The biology of subterranean rodents. University of Chicago Press, Chicago.
- Lynch M, Koskella B and Schaack S (2006) Mutation pressure and the evolution of organelle genomic architecture. Science 311:1727-1730.
- Luo Y, Gao W, Gao Y, Tang S, Huang Q, Tan X, Chen J and Huang T (2008) Mitochondrial genome analysis of Ochotona curzoniae and implication of COX in hypoxic adaptation. Mitochondrion 8:352-357.
- Macey JR, Papenfuss TJ, Kuehl JV, Fourcade HM and Boore JL (2004) Phylogenetic relationships among amphisbaenian reptiles based on complete mitochondrial genomic sequences. Mol Phylogenet Evol 33:22-31.
- Meiri S (2024) SquamBase-A database of squamate (Reptilia: Squamata) traits. Global Ecol Biogeogr 33:e13812.
- Mindell DP, Sorenson MD and Dimcheff DE (1998) Multiple independent origins of mitochondrial gene order in birds. Proc Natl Acad Sci U S A 95:10693-10697.
- Miralles A, Hipsley CA, Erens J, Gehara M, Rakotoarison A, Glaw F, Müller J and Vences M (2015) Distinct patterns of desynchronized limb regression in Malagasy scincine lizards (Squamata, Scincidae). PloS One 10:e0126074.
- Nabholz B, Ellegren H and Wolf JB (2012). High levels of gene expression explain the strong evolutionary constraint of mitochondrial protein-coding genes. Mol Biol Evol 30:272-284.
- Navas CA, Antoniazzi MM, Carvalho JE, Chaui-Berlink JG, James RS, Jared C, Kohlsdorf T, Pai-Silva MD and Wilson RS (2004) Morphological and physiological specialization for digging in amphisbaenians, an ancient lineage of fossorial vertebrates. J Exp Biol 207:2433-2441.
- Nevo E (1979) Adaptive convergence and divergence of subterranean mammals. Annu Rev Ecol Syst 10:269-308.
- Pereira SL (2000) Mitochondrial genome organization and vertebrate phylogenetics. Genet Mol Biol 23:745-752.
- Pond SLK, Frost SDW and Muse SV (2005) HyPhy: Hypothesis testing using phylogenies. Bioinformatics 21:676-679.
- Pond SLK, Poon AFY, Velazquez R, Weaver S, Hepler NL, Murrell B, Shank SD, Magalis BR, Bouvier D, Nekrutenko A et al (2020). HyPhy 2.5-a customizable platform for evolutionary hypothesis testing using phylogenies. Mol Biol Evol 37:295-299.
- Roll U, Feldman A, Novosolov M, Allison A, Bauer AM, Bernard R, Böhm M, Castro-Herrera F, Chirio L, Collen B et al (2017) The global distribution of tetrapods reveals a need for targeted reptile conservation. Nat Ecol Evol 1:1677-1682.
- Sebastian W, Sukumaran S, Zacharia P, Muraleedharan K, Kumar PD and Gopalakrishnan A (2020) Signals of selection in the mitogenome provide insights into adaptation mechanisms in heterogeneous habitats in a widely distributed pelagic fish. Sci Rep 10:9081.
- Shen Y-Y, Shi P, Sun Y-B and Zhang Y-P (2009). Relaxation of selective constraints on avian mitochondrial DNA following the degeneration of flight ability. Genome Res 19:1760-1765.
- Shen Y-Y, Liang L, Zhu Z-H, Zhou W-P, Irwin DM and Zhang Y-P (2010) Adaptive evolution of energy metabolism genes and the origin of flight in bats. Proc Natl Acad Sci U S A 107:8666-8671.
- Silva CCD, Tomasco IH, Hoffmann FG and Lessa EP (2009) Genes and ecology: Accelerated rates of replacement substitutions in the cytochrome b gene of subterranean rodents. Open Evol J 3:17-30.
- Spadacci-Morena DD, Jared C, Antoniazzi MM, Brunner O, Morena P and Brunner Jr A (1998). Comparative cytomorphology of maturing amphisbaenian (Amphisbaena alba) and Snake (Waglerophis merremii) erythroid cells with regard to haemoglobin biosynthesis. Comp Haematol Int 8:7-15.
- Sun Y-B, Shen Y-Y, Irwin DM and Zhang Y-P (2011) Evaluating the roles of energetic functional constraints on teleost mitochondrial-encoded protein evolution. Mol Biol Evol 28:39-44.
- Tavares WC and Seuánez HN (2018) Changes in selection intensity on the mitogenome of subterranean and fossorial rodents respective to aboveground species. Mamm Genome 29:353-363.
- Title PO, Singhal S, Grundler MC, Costa GC, Pyron RA, Colston TJ, Grundler MR, Prates I, Stepanova N, Jones ME et al (2024) The macroevolutionary singularity of snakes. Science 383:918-923.
- Tomasco IH and Lessa EP (2011) The evolution of mitochondrial genomes in subterranean caviomorph rodents: Adaptation against a background of purifying selection. Mol Phylogenet Evol 61:64-70.
- Tomasco IH and Lessa EP (2014) Two mitochondrial genes under episodic positive selection in subterranean octodontoid rodents. Gene 534:371-378.
- Tonini JFR, Beard KH, Ferreira RB, Jetz W and Pyron RA (2016) Fully-sampled phylogenies of squamates reveal evolutionary patterns in threat status. Biol Conserv 204:23-31.
- Van Damme R and Vanhooydonck B (2002) Speed versus maneuverability: association between vertebral number and habitat structure in lacertid lizards. J Zool 258:327-334.
- Vihar B, Wolf C, Böhme W, Fiedler F and Baumgartner W (2015) Respiratory physiology of the sandfish (Squamata: Scincidae: Scincus scincus) with special reference to subharenal breathing. Salamandra 51:326-334.
- Vitt LJ and Caldwell JP (2013) Herpetology: An introductory biology of amphibians and reptiles. Academic Press, San Diego.
- de Vries JL, Oosthuizen MK, Sichilima AM and Bennett NC (2008) Circadian rhythms of locomotor activity in Ansell’s mole-rat: Are mole-rat’s clocks ticking? J Zool 276:343-349.
- Wallace DC (2005) A mitochondrial paradigm of metabolic and degenerative diseases, aging, and cancer: A dawn for evolutionary medicine. Annu Rev Genet 39:359-407.
- Wang Z, Wu W, Ren J, Peng C, Jiang D and Li J (2021) Evolution of phenotype and mitochondrial genome reveals limbless and body-elongated Squamates may change their energy basis for locomotion. Asian Herpetol Res 12:213-220L.
- Weber RE, Johansen K and Abe AS (1981) Myoglobin from the burrowing reptile Amphisbaena alba. Concentrations and functional characteristics. Comp Bioch Physiol 68A:159-165.
- Wertheim JO, Murrell B, Smith MD, Kosakovsky Pond SL and Scheffler K (2015). RELAX: detecting relaxed selection in a phylogenetic framework. Mol Biol Evol 32:820-832.
- Wiens JJ, Brandley MC and Reeder TW (2006) Why does a trait evolve multiple times within a clade? Repeated evolution of snakeline body form in squamate reptiles. Evolution 60:123-141.
- Wu L, Tong Y, Ayivi SPG, Storey KB, Zhang J-Y and Yu D-N (2022) The complete mitochondrial genomes of three Sphenomorphinae species (Squamata: Scincidae) and the selective pressure analysis on mitochondrial genomes of limbless Isopachys gyldenstolpei Animals 12:2015.
- Xia X and Xie Z (2001) DAMBE: Software package for data analysis in molecular biology and evolution. J Hered 92:371-373.
- Xia X, Xie Z, Salemi M, Chen L and Wang Y (2003) An index of substitution saturation and its application. Mol Biol Evol 26:1-7.
- Xia X and Lemey P (2009) Assessing substitution saturation with DAMBE. In: Lemey P, Salemi M and Vandamme A-M (eds). The phylogenetic handbook: a practical approach to DNA and protein phylogeny. 2nd edition. Cambridge University Press, Cambridge, pp 615-630.
- Yang Z (2007) PAML 4: Phylogenetic analysis by maximum likelihood. Mol Biol Evol 24:1586-1591.
- Yang Z and Nielsen R (2002) Codon-substitution models for detecting molecular adaptation at individual sites along specific lineages. Mol Biol Evol 19:908-917.
- Zhang J, Miao G, Hu S, Sun Q, Ding H, Ji Z, Guo P, Yan S, Wang C, Kan X et al (2021) Quantification and evolution of mitochondrial genome rearrangement in Amphibians. BMC Ecol Evol 21:19.
- Zhong J, Li G, Liu ZQ, Li QW and Wang YQ (2005) Gene rearrangement of mitochondrial genome in the vertebrate. Acta Genet Sin 32:322-330.
Internet Resources
-
Uetz P, Freed P, Aguilar R, Reyes F, Kudera J and Hošek J (eds). (2025) The reptile database, (2025) The reptile database, http://www.reptile-database.org (accessed in 01 Aug 2025)
» http://www.reptile-database.org
Sequences of Amphisbaena alba mitogenomes obtained in our laboratory were deposited in GenBank (accession number PZ210514). Data provided also as electronic supplementary material.