Influence of land use and land cover on eutrophication of an artificial reservoir in southern Brazil
ABSTRACT
Population growth has driven the exploitation of water resources, often accelerating their eutrophication, the magnitude of which is associated with land use and land cover in their drainage area. This study aims to determine which tributaries exert the greatest influence on the eutrophication of an artificial reservoir used for public supply. To this end, the evolution of land use and cover, and the water quality of its main tributaries, were evaluated. Two land use and land cover maps were generated using MapBiomas (years 2000 and 2022), and the Global Rate of Change (Mahamba et al. 2022) was calculated for them. Water quality parameters historically linked to eutrophication were also evaluated using descriptive statistics, and the results were compared. The sub-basins with predominant human activities were identified as having the highest concentrations of nutrients. However, the tributary identified as the main predictor of total phosphorus concentration in the reservoir is less polluted. Because it has a higher flow rate, it still satisfactorily dilutes the contributions of the others, so that, after treatment in accordance with the legislation, the reservoir’s waters can be used for supply. The analysis of the available qualitative parameters highlights total phosphorus concentration as the main factor compromising reservoir quality. Therefore, it is essential to control its contributions by managing land use and cover in the drainage area to ensure its continuity as a source of public supply.
Keywords:
MapBiomas; phosphorus; public supply; water quality
INTRODUCTION
The preservation and conscious use of water resources, especially surface freshwater available for human use, is essential for the long-term maintenance of life (Barbosa; Novo and Martins, 2019). However, intensified use by humans due to population growth has resulted in the pollution and degradation of aquatic systems, disrupting natural ecosystems, threatening their availability, and making it difficult to treat them for human consumption (Muñoz-Nájera et al., 2020; Osti et al., 2024).
One of the effects of human pollution that affects water resources is the acceleration of the eutrophication process, defined as the enrichment of a water body with nutrients (Brasil, 2014). Eutrophication can occur naturally, on a geological scale, or be accelerated to a scale of decades by human action, generally associated with sewage release (Osti et al., 2024). Once present, nutrients stimulate the growth of phytoplankton and aquatic plants (Khan and Mohammad, 2014) and may lead to restrictions on the possible uses of water (Osti et al., 2024). The main nutrients associated with eutrophication are nitrogen and phosphorus (Von Sperling, 1996). While nitrogen can be fixed from the atmosphere, phosphorus primarily enters aquatic systems through soil erosion and leaching. As a result, phosphorus is often the limiting nutrient in eutrophication, making it a more effective target for management interventions aimed at controlling eutrophication (Khan and Mohammad, 2014). According to Von Sperling (1996), the degree of eutrophication of a water body is usually associated with predominant land use and land cover (LULC) in its drainage area, making knowledge of these characteristics relevant when analyzing water quality. Different forms of LULC and their changes over time are important drivers of environmental change (Demissie, 2022; Mahamba et al., 2022; Wang; Munkhnasan and Lee, 2021), directly influencing the quality and quantity of water in a river basin (Preis; Franco and Varela, 2021).
Several studies on LULC reveal an increase in impermeable areas to the detriment of vegetation areas: Borges and Oliveira (2021), Wang, Munkhnasan and Lee (2021), Davis and Bhaskar (2022), Mahamba et al. (2022), Demissie (2022), and Shekar and Mathew (2023), contributing to a decline in soil and water quality (Davis and Bhaskar, 2022). The reduction of natural areas such as forests and wetlands, which are essential for nutrient cycling, results in their loss on a larger scale, favoring eutrophication of water resources (Khan and Mohammad, 2014). According to Wieczorek et al. (2024), knowledge about a water body’s tributaries in terms of the inputs they carry is equally important for qualitative assessment.
Data obtained through monitoring routines or specific analyses, both in natura and as water quality indices, when associated with knowledge about land use, favor the identification of sources of anthropogenic pressure and/or natural conditions that may influence water source quality (Costa et al., 2022).
Remote sensing has been widely used in mapping LULC for different applications (Da Silva and Orlanda, 2024; Leandro, 2021; Obaid; Adam and Ali, 2023; Pinheiro, 2024; Santos et al., 2024; Zhang et al., 2022), including monitoring aquatic systems, for which it overcomes the limitations of conventional methods (Barbosa; Novo and Martins, 2019; Malthus et al., 2019; Wieczorek et al., 2024). However, association with traditional in situ sampling methods remains necessary to improve the accuracy of remote sensing (Gholizadeh; Melesse and Reddi, 2016). An important tool for remote sensing is the Google Earth Engine (GEE) platform (Gorelick et al., 2017; Wang et al., 2020). It has an extensive public database, and it is possible to develop and implement interactive applications (Gorelick et al., 2017, Kumar and Mutanga, 2018), such as the MapBiomas Platform for GEE (MapBiomas, 2023).
The lack of hydrodynamic data for the study area motivated the use of machine learning to estimate which tributary would be the largest contributor to total phosphorus concentration in the reservoir. This approach is possible because some machine learning methods, such as those implemented in the Caret package for R, inherently rank the importance of each predictor in a regression analysis. Given the absence of flow measurements at any of the sampling points studied, this metric was used to estimate the influence of each tributary on phosphorus concentration at the intake, since phosphorus loading could not be calculated directly.
Therefore, this study aims to provide a comprehensive overview of the eutrophication process in a major water supply reservoir located in Southern Brazil. This is achieved by considering the influence of LULC in its drainage area by mapping its predominant LULC classes and statistically analyzing the qualitative contribution of its main tributaries. We expect this approach to confirm that sub-basins draining areas with greater human activity contribute more significantly to reservoir eutrophication.
METHODS
The city of Pelotas, encompassing an area of 1,608.780 km2 and an estimated population of 325,689 inhabitants, is situated in southern Brazil between latitudes 31°28’S and 31°48’S and longitudes 52°00’W and 52°45’W (IBGE, 2022). The municipality is within the Pampa biome (Brasil, 2022), its climate is classified as temperate, mild mesothermal, super-humid, and without a defined dry season, with an average temperature ranging from 10 to 15°C (IBGE, 2002). The accumulated annual rainfall recorded at the Pelotas Agroclimatic Station (Capão do Leão) was 1,382.4 mm (INMET, 2023). Santa Bárbara Dam Reservoir (BSB) is located in an urban area. The dam is an artificial surface reservoir used for public water supply (Sanep, 2024). This reservoir is subject to blooms of cyanobacteria and dinoflagellates, organisms that proliferate more frequently in eutrophic environments (Khan and Mohammad, 2014).
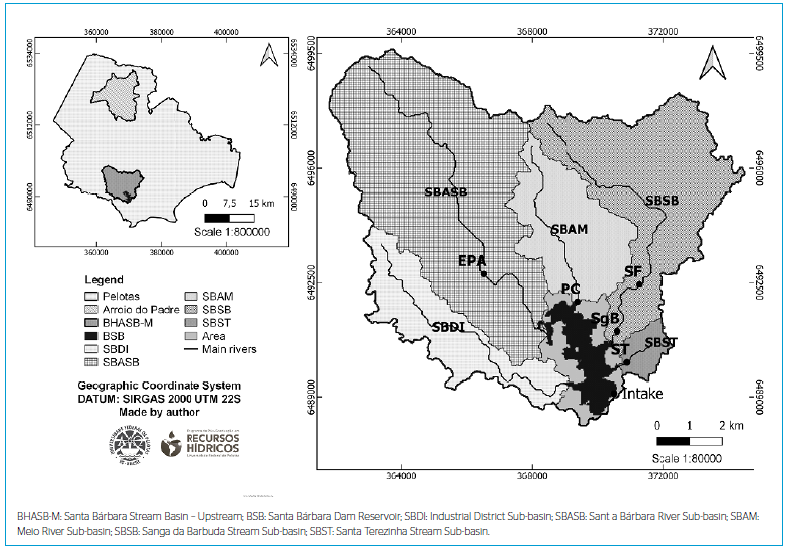
The study area comprises two aquifer systems: the Crystalline Basement Aquifer System II (fractured type, with a predominance of Argisols) and the Quaternary Coastal Aquifer System II (granular type, with a predominance of Planosols) (IBGE, 2021; Machado and Freitas, 2005). The area surrounding the reservoir is characterized by urban-industrial expansion and agricultural activities (Korb and Suertegaray, 2014). The main tributaries of the BSB are the Epaminondas (EPA) and Passo do Cunha (PC) rivers, and the Sítio Floresta (SF), Sanga da Barbuda (SgB), and Santa Terezinha (ST) streams. Figure 1 shows the location of the cities of Pelotas and Arroio do Padre, the Santa Bárbara stream basin - upstream (BHASB-M; upstream of the dam that originated BSB), the sub-basins delimited in this study, the reservoir itself, the location of the water intake point, and BSB tributaries.

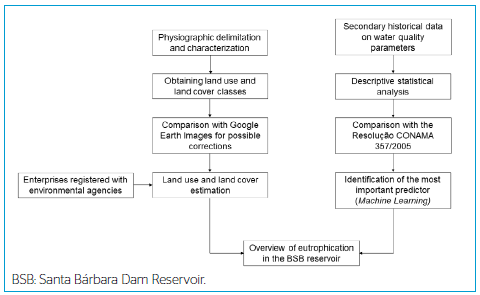
To assess the reservoir’s eutrophication status, LULC were evaluated. This evaluation incorporated historical water quality data provided by Pelotas Autonomous Sanitation Service (SANEP), the municipal basic sanitation agency. Additionally, the most impactful source of total phosphorus (TP) was investigated (see Figure 2).

In the analysis of LULC, BHASB-M and sub-basins were initially delimited using the SAGA (System for Automated Geoscientific Analyses) tools of the free software QGIS (QGIS Development, 2022), version 3.16.16 with GRASS 7.8.5, Shuttle Radar Topography Mission (SRTM) digital elevation model made available by the United States Geological Survey (USGS, 2022), shapefiles from the Brazilian Institute of Geography and Statistics (IBGE, 2019), and raster “Occurrence” from the Global Surface Water database, from 1984 to 2021, provided by the Joint Research Centre (Pekel et al., 2016). After delimitation, BHASB-M and sub-basins were subjected to unsupervised classification according to the MapBiomas Project, using the MapBiomas User Toolkit 1.19.0 - Land Use and Land Cover of the MapBiomas Platform for GEE (Siqueira, 2021) with the filters: Region: mapbiomas-brazil; Collection: collection8.0; Tables: biome; Properties: name_pt_br; Features: PAMPA; Data Type: Coverage; Buffer: none; Layers: “PAMPA 2000” and “PAMPA 2022” to select the years 2000 and 2022. Subsequently, 20 polygons were selected for comparison with Google Earth images (Google Earth, 2009) for visual comparison and reclassification, if necessary. To analyze the temporal evolution of the classes, the Global Rate of Change (GRC) was used (Mahamba et al., 2022). Additionally, the websites of the State Foundation for Environmental Protection (FEPAM) and the Secretariat of Environment and Infrastructure (SEMA) were consulted to verify which enterprises are registered in the area and their regulations for effluent disposal (FEPAM, 2023; SEMA, 2023).
Simultaneously, historical data on reservoir water quality and that of its contributors were tabulated and analyzed. The historical data on limnological parameters came from samples collected and analyzed by the SANEP Laboratory Division (DLA) in accordance with APHA (2005) during the period from 2016 to 2022.
For the parameters Biochemical Oxygen Demand (BOD5,20), TP, Ammoniacal Nitrogen (AN), Dissolved Oxygen (DO), pH, and Turbidity, the mean, standard deviation, maximum and minimum values, and percentage of samples outside the standard according to Class 2 of CONAMA Resolution 357/2005 (Brasil, 2005) were calculated. Boxplot graphs were also generated using Excel. Subsequently, using the Jamovi software (Jamovi, 2022), the presence or absence of statistically significant differences between groups was tested using one-way ANOVA, and correlation matrices were calculated using Spearman’s method after excluding cases with missing data.
To verify which tributary(ies) had the greatest influence on TP contribution to BSB, we chose machine learning, as hydrodynamic data was unavailable. Moreover, the small sample size of the TP dataset (n = 37) limits robust assessment of seasonal variability. After training with cross-validation, the data were modeled using the Random Forest method, considering TP concentrations in the streams as predictors of TP concentration in the reservoir. Training and validation were performed using the trainControl and train functions of the Caret package within the RStudio software environment (R Core Team, 2021). We utilized the k-fold cross-validation method (k = 10) and the Random Forest method with 500 trees (default parameters), respectively. Subsequently, the predictors were ranked according to their importance using a metric specific to the statistical package employed, referred to as “importance”. This metric indicates the relative significance of predictors, aligning with our objective to determine the degree of influence of each variable. The integration of the two approaches described allowed us to estimate a comprehensive overview of the BSB reservoir’s eutrophication status.
RESULTS AND DISCUSSION
The delimitation of BHASB-M revealed that the EPA, PC, SgB, and ST streams drain, respectively, the sub-basins of the Santa Bárbara river (SBASB), the Meio river (SBAM), the Sanga da Barbuda stream (SBSB), and the Santa Terezinha stream (SBST). There is no identification or monitoring of the tributary that drains the sub-basin of the industrial district (SBDI). According to Korb (2006), the EPA tributary is an intermittent stream with relatively well-preserved nature. The PC tributary is a perennial stream influenced by urbanization and agriculture, used for recreational activities. The SgB stream receives sewage, urban drainage, and agriculture, and all the input from SF. The ST stream is highly urbanized, receiving sewage, urban drainage, and livestock waste. Occupying 87.54 km2, 40.82% of BHASB-M’s area is covered by SBASB, 24.25% by SBSB, 12.96% by SBAM, 12.03% by SBDI, and 2.04% by SBST. The remaining 7.90% is occupied by the reservoir and direct drainages to it (diffuse contribution area, identified as “area” in Figure 1). BHASB-M is a 4th-order basin, characterized by a gently undulating relief (average slope = 4.67%), low drainage density (1.49 km.km-2), and low flooding tendency (Kc = 2.01). Regarding altitude, 73.47% of its total area is below or equal to 40m, and 82.96% of its relief varies from flat to gently undulating. The sub-basins all share a gently undulating relief (3.32 to 6.15%), low drainage density (1.06 to 1.70 km.km-2) and low flooding tendency (Kc from 1.63 to 2.87), with SBST being of 2nd order and the others of 3rd order.
The characteristics of most of BHASB-M suggest a tendency toward low surface runoff velocity and good infiltration rates, conditions that contribute to reduced soil erosion. However, the sandy characteristics of the soil overlying the granular aquifer and the greater erodibility near the springs (Schumann; Beskow and Bressiani, 2021) highlight the need to protect the banks of watercourses. This concern is also cited by the Municipal Basic Sanitation Plan (PMSB) (Sanep, 2018) in relation to the Santa Bárbara stream basin (BHASB). Furthermore, according to Tundisi and Matsumura-Tundisi (2008), particles of terrestrial origin transported to a reservoir undergo a sedimentation process involving adsorption/desorption of phosphate during displacement within the water mass and immobilization of nutrients in the bottom sediment. These nutrients become available to biogeochemical cycles according to their structural form - especially their oxidation state and degree of dissolution - thus favoring eutrophication.
Considering the classes proposed by the MapBiomas Project for the study area (MapBiomas, 2023), it was found that the polygons classified as “Forest Formation”, “Silviculture”, “Grassland Formation”, “Soybean”, “Other Temporary Crops”, “Other Non-Vegetated Areas”, “Urbanized Area”, “River, Lake, and Ocean”, “Mosaic of Uses” and “Flooded Field and Marshy Area” corresponded satisfactorily to the LULC observed in the satellite images for the years analyzed. Furthermore, in most of the polygons observed, the Mosaic of Uses class occurs close to the classes associated with Agriculture, primarily at the boundaries with other classes. It also occurs near the Forest and Grassland Formations, Silviculture, and Wooded Restinga, consisting, as its name suggests, of a mixture of different features.
The polygons classified as Wooded Restinga, however, correspond to Silviculture, considering the Google Earth Pro satellite images for the years under analysis. Knowing that restinga vegetation is characteristic of coastal regions, this spectral confusion may have occurred because Pelotas is part of the coastal municipalities of Brazil (CIRM, 1997), making this specific land use and occupation class applicable to the region. Therefore, it was decided to reclassify the Wooded Restinga class as Silviculture and to combine the Soybean, Rice, and Other Temporary Crops classes into their previous classification level, called Agriculture, for the two years analyzed. The study area now comprises the following classes: “Forest Formation”, “Silviculture”, “Flooded Field and Marshy Area”, “Grassland Formation”, “Agriculture”, “Mosaic of Uses”, “Urbanized Area”, “Other Non-Vegetated Areas,” and “River, Lake, and Ocean” (see Figure 3).

Table 1 shows the areas (in km2) from the maps shown in Figure 3, the relative percentages for each LULC type, and the percentage of increase or decrease in the area of each class during the analyzed period (GRC, %).
Table 1 shows that, according to the GRC, the following classes had an area increase, in decreasing order: Flooded Field and Marshy area (83.33%), Urbanized area (80.01%), Mosaic of Uses (55.74%), Agriculture (14.04%), and Silviculture (11.91%). A reduction in area occurred for the classes: Grassland Formation (-25.83%), Other Non-Vegetated Areas (-15.65%), River, Lake, and Ocean (-10.20%), and Forest Formation (-7.52%). Although a reduction occurred during the evaluated period, Grassland Formation continues to be the predominant class in BHASB-M, covering 26.97% of its total area in 2022. The 80.01% increase in the Urbanized Area is worth highlighting. Even though the largest increase occurred in the Flooded Field and Marshy class, the other expanding classes are associated not only with greater soil impermeability but also with increased nutrient input, such as the Urbanized Area and Agriculture classes, due to domestic sewage and fertilizers. In addition, there was a reduction in the Forest Formation class, which is equally important in preventing sediment transport via surface runoff.
The Forest Formation, Flooded Field and Marshy Area, and Grassland Formation classes together occupied 51.15% of BHASB-M in 2000, corresponding to an area of 44.94 km2. By 2022, this area had been reduced to 36.25 km2, now occupying 41.28% of the basin. Disregarding the aforementioned classes and the River, Lake, and Ocean class, which experienced a reduction of less than 0.5 km2, the other classes together occupied 38.74 km2 (44.10%) in 2000, increasing to 47.81 km2 (54.45%) in 2022. When considering the former as natural formations and the latter as anthropogenic formations, these results indicate an increase in the influence of human actions within BHASB-M, even with the relatively comfortable situation of retaining more than 40% of its area covered by natural formations.
Disconzi et al. (2016) compared land use and occupation in BHASB by applying supervised classification to single images from 1999, 2010 (Landsat 5), and 2016 (Landsat 8). They concluded that between 1999 and 2016, there was an increase in the quarry, urban, crop, and field classes, and a decrease in the reservoir and forest classes. The authors attributed the increase in the urban class to the natural development of the region, and the increase in the crop and field classes and decrease in the forest class to the return of rural producers and deforestation of reforested eucalyptus. Regarding the decrease in the reservoir class, the authors believe that it is associated with the date of acquisition of the satellite images used - specifically, the 1999 image being from August (wet season) and the 2016 image from February (dry season). It is worth noting that the analysis by Disconzi et al. (2016) refers to the entire BHASB, whose outlet is located in the São Gonçalo Channel, and not only to BHASB-M, whose outlet is located near the dam that formed BSB. In any case, the increase in the quarry, urban, crop, and field classes, all considered to be under anthropic influence, agrees with the conclusions of this study, as mentioned in the previous paragraph.
Table 2 shows a comparative summary of the results of the sub-basins, considering the same analysis logic used for BHASB-M.
Considering the Forest Formation, Flooded Field and Marshy Area, and Grassland Formation classes as having natural and semi-natural terrestrial vegetation, and the Agriculture, Silviculture, Mosaic of Uses, Urbanized Area, and Other Non-Vegetated Areas classes as anthropogenic areas, there was a decrease in natural cover and an increase in anthropogenic cover across most sub-basins. SBAM is an exception. It suffered minimal change, with natural cover remaining stable at approximately 45%, and anthropogenic cover was around 54% of its total area. Natural formations decreased from 45.24 to 34.11% in SBDI, 69.78 to 58.21% in SBASB, 33.52 to 19.77% in SBSB, and 30.84 to 18.37% in SBST. Concurrently, the increase in anthropogenic areas was from 49.76 to 61.64% in SBDI, 29.40 to 41.45% in SBASB, 65.85 to 79.71% in SBSB, and 69.16 to 81.63% in SBST.
Siqueira et al. (2019) analyzed LULC dynamics between 1953 and 2018 in the EPA river basin (corresponding to SBASB in the present study) to support a pilot project for Payment for Environmental Services (PES). The authors reported that by 2018, 78% of the 33.2 km2 drainage area was occupied for anthropogenic uses (mining, urbanization, agriculture, pasture, and Silviculture) and 21% by natural cover (grassland, forest, water bodies). In contrast, our 2022 assessment indicates that natural cover (specifically the sum of the Grassland and Forest Formation classes) now exceeds 50% of the SBASB coverage.
Figure 4 illustrates the location of active mining processes and industries (SEMA, 2023), and the water bodies receiving treated industrial effluents (FEPAM, 2023). Within the sub-basins, the industrial inventory comprises: a parboiled rice mill in SBDI; clay and granite mining, alongside plastics and grain-drying industries in SBASB; sand mining and a non-parboiled rice mill in SBAM; eight industrial units in SBSB, including parboiled and non-parboiled rice mills, grain-drying, a slaughterhouse, animal feed, fish and solid waste processing plants. Vegetable oil production and refining are located within the diffuse contribution area. Registered mining activities do not generate effluents (FEPAM, 2023). Notably, under CONAMA Resolution 430/2011 (Brasil, 2011), all registered industries are authorized to discharge treated liquid effluents into the public sewage network; three of these discharge points are highlighted in Figure 4. The plastics manufacturer is an exception, utilizing an on-site reservoir for effluent management.

LULC classification using MapBiomas and Google Earth imagery, integrated with environmental records, revealed distinct sub-basin characteristics. SBDI and SBASB are characterized by a predominance of grassland and agricultural areas, while SBAM is primarily composed of grassland. In contrast, SBST is highly urbanized. SBSB, which integrates agriculture, silviculture, and urban areas, concentrates the highest density of industrial facilities with high pollution potential. In this context, SBSB and SBST offer the greatest contamination risks to BSB, particularly through surface runoff, which was not quantified in this study due to data unavailability. Notably, the Urban Drainage Master Plan (Sanep, 2018), supplementary to the PMSB, proposes the implementation of several detention basins for runoff control in the Santa Bárbara Canal (downstream of the dam), encompassing part of the SBST drainage area. This project, once implemented, is expected to mitigate contamination risks to BSB waters via this pathway.
Table 3 summarizes descriptive statistics (mean, standard deviation, and maximum and minimum values) and the percentage of samples exceeding the Maximum Permissible Value (MPV) established for Class 2 waters under CONAMA Resolution 357/2005 (Brasil, 2005). Water quality data were collected between 2016 and 2022 at the BSB intake and the EPA, PC, SgB, and ST streams. The monitored parameters included BOD5,20, DO, Turbidity (measured as Nephelometric Turbidity Units (NTU)), pH, TP, and AN. The EPA, PC, SgB, and ST streams drain, respectively, SBASB, SBAM, SBSB, and SBST sub-basins. The MPVs for each parameter are as follows: BOD5,20 ≤ 5mg O2.L-1; DO ≥ 5mg O2.L-1; Turbidity ≤ 100 NTU; 6.0 ≤ pH ≤ 9.0; TP ≤ 0.03mg.L-1; and AN ≤ 2mg.L-1.
Mean ( , mg.L-1), standard deviation (sd, mg.L-1), minimum and maximum values, and percentage of samples exceeding the CONAMA 357/05 regulatory limits (Brasil, 2005).
Table 3 indicates that, except for TP, all parameters comply with the regulatory limits on average (Brasil, 2005). The percentages that exceeded the limits are primarily attributed to outliers, as the mean increased value of the standard deviation remains within the MPV (in the case of DO, both increased and decreased values). Therefore, BSB water quality can be considered suitable for public supply treatment. However, the recurrent eutrophic condition, evidenced by elevated TP levels, calls for strategies for the implementation of effective mitigation measures.
The analysis of Table 3 reveals that, except for Turbidity in EPA and pH in EPA, SgB and ST, all parameters exhibited values exceeding regulatory standards across all monitoring sites. TP concentrations exceeded MPV in 72 to 98% of observations for BSB, EPA, and PC, with a peak concentration of 1.53 mg.L-1 recorded at BSB. In contrast, SgB and ST showed 100% exceedance for TP, reaching a maximum of 12.58 mg.L-1 in SgB. Drained to SgB, SBSB is characterized by intensive agricultural land use, where the widespread application of phosphate-based fertilizers serves as a primary nutrient source.
Similarly, AN levels exceeded the MPV in 9.21 to 22.00% of samples for BSB, EPA, and PC, with a maximum of 5.60 mg.L-1 in the PC tributary. Regarding SgB and ST, AN levels exceeded MPV in 100% of the cases, reaching a maximum of 58.80 mg.L-1 in ST. The area drained by ST corresponds to SBST, whose contribution is predominantly urban, suggesting that domestic sewage and untreated urban runoff are the key drivers of nitrogen enrichment.
BOD5,20 concentrations exceeded regulatory limits most frequently in SgB and ST, which is consistent with the high organic loads received by these tributaries. However, the maximum value across all locations was recorded in EPA (195 mg.L-1). The EPA river drains SBASB, where land use is dominated by grassland and agriculture; the organic enrichment detected may be associated with extensive livestock grazing in these areas.
Furthermore, while DO levels fell below the standard in the EPA and PC tributaries, the lowest concentrations were observed in SgB and ST (0.30 and 0.40 mg.L-1, respectively). These tributaries also exhibited mean values below the regulatory threshold and a higher frequency of non-compliance. Such results are attributed to severe anthropogenic pollution, as previously discussed.
Coradi et al. (2009) evaluated several surface watercourses in the municipality of Pelotas, including BSB, using 1996 data collected during a reported drought event. The authors identified TP as the parameter with the most significant environmental impact, reporting a mean concentration of 16.3 mg.L-1 (ranging from 0.6 to 43.6 mg.L-1).
Previously, Piedras et al. (2006) characterized the eutrophication of BSB as “the most immediate challenge to be addressed” based on longitudinal studies published in the late 1970s. The authors evaluated BSB, PC, and SgB and obtained results in the same order of magnitude as those shown in Table 3 for the DO, pH, AN, and TP parameters. They concluded that the waters of BSB remained suitable for public supply treatment under Class 2 regulatory standards (Brasil, 2005) and that the reservoir maintained significant capacity to dilute the effluents received.
Figure 5 presents the boxplots for the six water quality parameters monitored at BSB and its tributaries. Notably, TP and AN concentrations are significantly elevated in the SgB and ST tributaries compared to the other monitoring sites. These results are attributed to intensive agricultural activities and urbanization in these drainage areas, including phosphate-based fertilizers and untreated domestic sewage. Similarly, BOD5,20 levels are higher in ST than in the remaining locations, further correlating with the high degree of urbanization in SBST. Finally, DO concentrations are markedly lower in the SgB and ST, which is consistent with the high organic and nutrient enrichment observed in these specific tributaries.
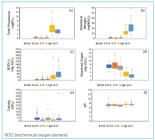
Boxplots of the analyzed water quality parameters: (a) Total Phosphorus (TP), (b) Ammoniacal Nitrogen (AN), (c) BOD5,20, (d) Dissolved Oxygen (DO), (e) Turbidity, and (f) pH.
A one-way Analysis of Variance (ANOVA) was performed to evaluate whether statistically significant differences existed between the monitoring sites for each parameter. The ANOVA results indicated significant differences among the sites evaluated, requiring post-hoc tests for pairwise comparisons. According to Levene’s test, pH exhibited homogeneity of variance; thus, Fisher’s adjustment and Tukey’s test were applied. For the remaining parameters, which displayed heteroscedasticity (heterogeneous variances), Welch’s ANOVA adjustment and Games-Howell post-hoc test were employed. The results are summarized in Table 4.
The results in Table 4 are consistent with the boxplot trends, as both indicate statistical similarities among BSB, PC, and EPA. These sites exhibited predominantly lower concentrations than SgB and ST, particularly for TP, AN, and BOD5,20, which function as key pollution indicators. The low DO levels in SgB and ST further support the classification of these tributaries as the most degraded.
The annual mean of TP, AN, and BOD5,20 across all monitoring sites from 2016 to 2022 is shown in Table 5.
Regarding TP concentrations, Table 5 indicates that the highest mean values were predominantly observed in the SgB tributary, followed by ST. This pattern is attributed to the fact that approximately 50% of SBSB, drained by SgB, is occupied by agriculture and silviculture, activities characterized by the intensive use of phosphate-based fertilizers. BSB and PC exhibited very similar mean concentrations. The maximum annual TP averages occurred in 2020 across all the sites monitored, likely due to the severe drought in the region, which caused reduced dilution capacity.
For AN, Table 5 reveals the highest annual mean concentrations in the ST tributary, followed by SgB. The ST drainage area, SBST, is primarily impacted by urban runoff and domestic sewage discharge. The maximum mean concentrations for this parameter were recorded in 2019 for ST, in 2022 for BSB, and in 2020 for the remaining sub-basins.
Based on the mean BOD5.20 concentrations presented in Table 5, the ST and SgB tributaries exhibited the highest annual levels, indicating a more pronounced state of water degradation. This assessment is corroborated by the lower DO concentrations recorded in these watercourses (see Table 3). Notably, mean BOD5,20 concentrations at the BSB site did not exceed the MPV established by CONAMA Resolution 357/2005 (BOD5,20 ≤ 5mg O2.L-1). The highest BOD5,20 values occurred in 2022 for SgB and ST, in 2018 for EPA, in 2019 for PC, and in 2017 for BSB.
These findings indicate that the SgB and ST tributaries are the most qualitatively degraded, which aligns with the LULC analysis regarding anthropogenic inputs from their respective sub-basins. At the catchment point (BSB), TP and AN concentrations were lower than those in SgB and ST, showing a similar order of magnitude as PC and EPA (see Figure 5, Table 3). This pattern may be attributed to nutrient uptake by phytoplankton organisms (Cunha; Calijuri and Lamparelli, 2013) and/or the dilution capacity provided by other tributaries, especially the PC tributary. Although flow measurements were not performed, field observations suggest that the PC tributary contributes with a significantly higher volume of water compared to the other sites.
To evaluate the correlations between parameters across different locations, variables were identified using acronyms combining the parameter and the location (e.g., “pH-EPA” represents pH value in the EPA tributary). Considering that most of the datasets did not follow a normal distribution, the Spearman’s rank correlation method (ρ) was employed.
Statistically significant Spearman correlations (p < 0.05) with coefficients (ρ) exceeding ± 0.6 were identified across ten parameter-site sets. For analytical clarity, these correlations were categorized into:
Tables 6 and 7 provide correlation values and the hypothesized mechanisms governing these relationships.
The correlation analysis did not identify any single tributary as a dominant influence on BSB water quality, as no coefficients exceeded the ± 0.6 threshold for any evaluated parameter.
Therefore, using TP concentration as the primary indicator of eutrophication (among the available parameters), a machine learning approach was employed to identify the most significant predictor(s) of TP-BSB among the tributaries. To achieve this, the dataset was trained with the Random Forest algorithm (500 trees, default parameters) and cross-validation (k = 10). Given the limited sample size (n = 37), the entire dataset was used for training and validation to maximize the model’s generalization ability, rather than splitting it into discrete training and testing sets. It should be emphasized that the objective of this procedure was to obtain the relative feature importance of each predictor rather than developing a predictive equation. The results of the “importance” metric revealed that the most influential predictor of TP-BSB was the PC tributary (0.57), followed by SgB (0.44), ST (0.32), and EPA (0.21). This hierarchy reinforces the reservoir dilution capacity and is consistent with the higher volumetric contribution on the PC tributary to BSB, as previously noted.
CONCLUSION
This study enhances understanding of the BHASB-M drainage area by identifying the SBSB and SBST sub-basins as the primary sources of nutrient loading, potentially causing BSB eutrophication. This finding is supported by the LULC characteristics of these sub-basins and high nutrient concentrations observed in water quality assessments. Notably, the lower nutrient levels observed in the reservoir indicate that inflows from less impacted sub-basins provide substantial dilution capacity, especially considering the importance of the PC tributary as a primary predictor of TP concentrations in the reservoir. This highlights its importance in mitigating nutritional loads through volumetric contribution.
Regarding LULC dynamics, despite 25.83% decline during the study period, Grassland Formation remains the predominant class in BHASB-M, occupying 26.97% of its total area in 2022. The increase in the area of classes considered non-natural formations highlights greater anthropic influence on land occupation, even though more than 40% of BHASB-M remains covered by natural vegetation. Although the Urbanized Area class represented only 6.80% of the total area of BHASB-M in 2022, the 80.01% increase from 2000 to 2022 emphasizes the urgent need for integrated sanitary planning (including stormwater management and domestic/industrial wastewater treatment). This is especially necessary in the most impacted sub-basins, SBSB and SBST. Additionally, considering pollutant dilution provided by the PC tributary, prioritizing the preservation of this sub-basin is essential. Implementing mitigation strategies for degraded areas in other sub-basins is also equally important.
Regarding the specific contributions of each sub-basin, SBSB, drained by the SgB tributary, characterized by predominance of agriculture, silviculture, and urbanized areas, had the highest TP concentrations. In SBST, where more than 75% of its surface is urbanized, AN was the dominant pollutant at the ST tributary. SBASB, drained by the EPA tributary, has more than 50% of its area covered by natural grassland and forest formations, and had the highest BOD5,20 concentrations, possibly because of organic matter decomposition. SBAM, predominantly occupied by silviculture and grassland, is drained by the PC tributary. Despite its lower pollutant concentrations, PC emerged as the primary predictor of TP concentration in the BSB, primarily due to its higher volumetric contribution, which provides substantial dilution capacity. The SBDI, which is mostly occupied by the Agriculture and Grassland Formation classes, does not have its tributaries monitored. Within this context, drainage of the SBSB and SBST sub-basins poses the greatest risks to BSB water quality. These areas exert the greatest influence on reservoir eutrophication due to their high nutrient loading.
Given the environmental and economic importance of the reservoir and its drainage to the municipality, investments in the management of BHASB-M are essential to reduce eutrophication and its associated consequences.
REFERENCES
- AMERICAN PUBLIC HEALTH ASSOCIATION (APHA). Standard methods for the examination of water and wastewater. 21. ed. Washington: APHA, AWWA, WEF, 2005. 1082 p.
- BARBOSA, Claudio Clemente Faria; NOVO, Evlyn Márcia Leão de Moraes; MARTINS, Vitor. Introdução ao Sensoriamento Remoto de Sistemas Aquáticos: princípios e aplicações. São José dos Campos: Instituto Nacional de Pesquisas Espaciais, 2019. 161 p.
-
BORGES, Vinícius Silva; OLIVEIRA, Wellington Nunes de. Análise multitemporal do uso e cobertura do solo da bacia hidrográfica do rio Meia Ponte. REEC - Revista Eletrônica de Engenharia Civil, v. 17, n. 1, p. 79-93, 2021. https://doi.org/10.5216/reec.v17i1.68192
» https://doi.org/https://doi.org/10.5216/reec.v17i1.68192 -
BRASIL. Comissão Interministerial para os Recursos do Mar (CIRM). Resolução nº 5, de 3 de dezembro de 1997. Aprova o Plano Nacional de Gerenciamento Costeiro II (PNGC II). Brasília: CIRM, 1997. Available at: https://antigo.mma.gov.br Accessed on: Jul. 17, 2023.
» https://antigo.mma.gov.br -
BRASIL. Conselho Nacional de Meio Ambiente. Resolução nº 357 de 17 de março de 2005. Dispõe sobre a classificação dos corpos de água e diretrizes ambientais para o seu enquadramento, bem como estabelece as condições e padrões de lançamento de efluentes, e dá outras providências. Diário Oficial da União: Brasília, 2005. p. 58-63. Available at: http://conama.mma.gov.br/?option=com_sisconama&task=arquivo.download&id=450 Accessed on: Jun. 24, 2023.
» http://conama.mma.gov.br/?option=com_sisconama&task=arquivo.download&id=450 - BRASIL. Ministério da Saúde. Fundação Nacional de Saúde. Manual de controle da qualidade da água para técnicos que trabalham em ETAS. Brasília: Funasa, 2014. 112 p.
-
BRASIL. Ministério do Meio Ambiente. Ecossistemas Bioma Pampa. Gov.br, 2022. Available at: https://www.gov.br/mma/pt-br/assuntos/ecossistemas-1/biomas/pampa Accessed on: Jun. 06, 2022.
» https://www.gov.br/mma/pt-br/assuntos/ecossistemas-1/biomas/pampa -
BRASIL. Ministério do Meio Ambiente. Conselho Nacional do Meio Ambiente. Resolução CONAMA nº 430, de 15 de maio de 2011. Dispõe sobre as condições e padrões de lançamento de efluentes, complementa e altera a Resolução nº 357, de 17 de março de 2005, do Conselho Nacional do Meio Ambiente-CONAMA. Brasília: Diário Oficial da União, 2011. Available at: https://www.legisweb.com.br/legislacao/?id=114770 Accessed on: Aug. 03, 2023.
» https://www.legisweb.com.br/legislacao/?id=114770 - CORADI, Paulo Carteri; PEREIRA-RAMIREZ, Orlando; FIA, Ronaldo; MATOS, Antônio Teixeira. Qualidade da água superficial da bacia hidrográfica da Lagoa Mirim. Revista de Ciências Ambientais, v. 3, n. 1, p. 53-64, 2009.
-
COSTA, Priscila da; BARROSO, Gabriela Rodrigues; DE OLIVEIRA, Karla Lorrane; STARLING, Maria Clara Vieira Martins; OLIVEIRA, Silvia. Dinâmica espaço temporal da qualidade das águas superficiais de dois grandes reservatórios de usinas hidrelétricas brasileiras. Engenharia Sanitaria e Ambiental, v. 27 n. 5, p. 893-907, 2022. https://doi.org/10.1590/S1413-415220210233
» https://doi.org/https://doi.org/10.1590/S1413-415220210233 -
CUNHA, Davi Gasparini Fernandes; CALIJURI, Maria do Carmo; LAMPARELLI, Marta Condé. A trophic state index for tropical/subtropical reservoirs (TSItsr). Ecological Engineering, v. 60, p. 126-134, 2013. https://doi.org/10.1016/j.ecoleng.2013.07.058
» https://doi.org/https://doi.org/10.1016/j.ecoleng.2013.07.058 -
DA SILVA, Vagner Paz; ORLANDA, José Fábio França. Evolução temporal do sensoriamento remoto no contexto da detecção de áreas degradadas na Amazônia: uma revisão sistemática. Revista Casa da Geografia de Sobral, v. 26, n. 1, p. 169-182, 2024. https://doi.org/10.35701/rcgs.v26.922
» https://doi.org/https://doi.org/10.35701/rcgs.v26.922 -
DAVIS, Felica; BHASKAR, Maruthi Sridhar Balaji. Assessment of water, soil contamination and land cover changes in Sims and Vince Bayou urban watersheds of Houston, Texas. Watershed Ecology and the Environment, v. 4, p. 73-85, 2022. https://doi.org/10.1016/j.wsee.2022.08.002
» https://doi.org/https://doi.org/10.1016/j.wsee.2022.08.002 -
DEMISSIE, Tamene Adugna. Land use and land cover change dynamics and its impact on watershed hydrological parameters: the case of Awetu watershed, Ethiopia. Journal of Sedimentary Environments, v. 7, p. 79-94, 2022 https://doi.org/10.1007/s43217-021-00084-1
» https://doi.org/https://doi.org/10.1007/s43217-021-00084-1 - DISCONZI, Pamela Bilhafan; HARTWIG, Marcelo Peske; TEIXEIRA-GANDRA, Claudia Fernanda Almeida; DAMÉ, Rita de Cássia Fraga; PEREIRA, Bernardo Rodrigues. Comparação de uso e ocupação da bacia da barragem Santa Bárbara, Pelotas/RS. In: XIII SIMPÓSIO DE RECURSOS HÍDRICOS DO NORDESTE, 2016, Aracaju, Anais [...]. Pelotas: Aracaju, 2016.
-
FUNDAÇÃO ESTADUAL DE PROTEÇÃO AMBIENTAL (FEPAM). Fundação Estadual de Proteção Ambiental Henrique Luiz Roessler. FEPAM, 2023. https://www.rs.gov.br/busca?q=&orgao=42 Acessed in: Jun. 24, 2023.
» https://www.rs.gov.br/busca?q=&orgao=42 -
GHOLIZADEH, Mohammad Haji; MELESSE, Assefa; REDDI, Lakshmi. A Comprehensive Review on Water Quality Parameters Estimation Using Remote Sensing Techniques. Sensors, n. 16, n. 8, 1298, 2016. https://doi.org/10.3390/s16081298
» https://doi.org/https://doi.org/10.3390/s16081298 -
GOOGLE EARTH. Google Earth, 2009. Available at: https://earth.google.com/web/search/Barragem+Santa+B%C3%A1rbara+-+Santa+Terezinha,+Pelotas+-+RS/@-31.71816643,-52.37326912,10.94565438a,405327.17567727d,1y,-0h,0t,0r/data=CjQiJgokCbqVMhdQcDVAEbuVMhdQcDXAGeG3ZEsi6khAIdfBLeOs1krAKgYIARIAGAFCAggBOgMKATBCAggASg0I____________ARAA?authuser=0 Accessed on: Feb. 12, 2024.
» https://earth.google.com/web/search/Barragem+Santa+B%C3%A1rbara+-+Santa+Terezinha,+Pelotas+-+RS/@-31.71816643,-52.37326912,10.94565438a,405327.17567727d,1y,-0h,0t,0r/data=CjQiJgokCbqVMhdQcDVAEbuVMhdQcDXAGeG3ZEsi6khAIdfBLeOs1krAKgYIARIAGAFCAggBOgMKATBCAggASg0I____________ARAA?authuser=0 - GORELICK, Noel; HANCHER, Matt; DIXON, Mike; ILYUSHCHENKO, Simon; THAU, David; MOORE, Rebecca. Google Earth Engine: Planetary-scale geospatial analysis for everyone. Remote Sensing of Environment, v. 202, p. 18-27, 2017. https://doi.org/10.1016/j.rse.2017.06.031
-
INSTITUTO BRASILEIRO DE GEOGRAFIA E ESTATÍSTICA (IBGE). Climatologia/Clima. IBGE, 2002. Available at: https://www.ibge.gov.br/geociencias/informacoes-ambientais/climatologia.html Accessed on: May 15, 2022.
» https://www.ibge.gov.br/geociencias/informacoes-ambientais/climatologia.html -
INSTITUTO BRASILEIRO DE GEOGRAFIA E ESTATÍSTICA (IBGE). Biomas e sistema costeiro-marinho do Brasil: compatível com a escala 1:250000. Coordenação de Recursos Naturais e Estudos Ambientais. Rio de Janeiro: IBGE, 2019. 168 p. Available at: https://biblioteca.ibge.gov.br/index.php/biblioteca-catalogo?view=detalhes&id=2101676 Accessed on: Jul. 26, 2022.
» https://biblioteca.ibge.gov.br/index.php/biblioteca-catalogo?view=detalhes&id=2101676 -
INSTITUTO BRASILEIRO DE GEOGRAFIA E ESTATÍSTICA (IBGE). Banco de Dados de Informações Ambientais (BDiA). IBGE, 2021. Available at: https://bdiaweb.ibge.gov.br/#/home Accessed on: Jul. 26, 2022.
» https://bdiaweb.ibge.gov.br/#/home -
INSTITUTO BRASILEIRO DE GEOGRAFIA E ESTATÍSTICA (IBGE). Estimativa populacional 2022. IBGE, 2022. Available at: https://cidades.ibge.gov.br/brasil/rs/pelotas/panorama Accessed on: Jul. 15, 2023.
» https://cidades.ibge.gov.br/brasil/rs/pelotas/panorama -
INSTITUTO NACIONAL DE METEOROLOGIA (INMET). Normais Climatológicas. INMET, 2023 Available at: https://portal.inmet.gov.br/normais Accessed on: May 24, 2023.
» https://portal.inmet.gov.br/normais - KHAN, M. Nasir; MOHAMMAD, Firoz. Eutrophication: challenges and solutions. In: ANSARI, Abid; GILL, Sarvajeet. (ed.). Eutrophication: Causes, Consequences and Control. Dordrecht: Springer, 2014. p. 1-15. v. 2.
- KORB, C. Identificação de depósitos tecnogênicos no reservatório Santa Bárbara, Pelotas (RS). 2006. 184 f. Dissertação (Mestrado em Geografia) - Instituto de Geociências, Universidade Federal do Rio Grande do Sul, Porto Alegre, 2006.
-
KORB, Carina Cristiane; SUERTEGARAY, Dirce Maria Antunes. Identificação de depósitos tecnogênicos em um reservatório de abastecimento de água da cidade de Pelotas (RS). Quaternary and Environmental Geosciences, v. 5, n. 1, p. 41-54, 2014. https://doi.org/10.5380/abequa.v5i1.33918
» https://doi.org/https://doi.org/10.5380/abequa.v5i1.33918 -
KUMAR, Lalit; MUTANGA, Onisimo. Google Earth Engine Applications Since Inception: Usage, Trends, and Potential. Remote Sensing, v. 10, n. 10, 1509, 2018. https://doi.org/10.3390/rs10101509
» https://doi.org/https://doi.org/10.3390/rs10101509 - LEANDRO, Diuliana (org.). Geotecnologias aplicadas às ciências ambientais: Volume 1. Pelotas: Laboratório de Geoprocessamento Aplicado a Estudos Ambientais, 2021.
- MACHADO, José Luiz Flores; FREITAS, Marcos Alexandre de. Projeto Mapa Hidrogeológico do Rio Grande do Sul: relatório final. Porto Alegre: CPRM, 2005.
-
MAHAMBA, Jonathan Ahadi; MULONDI, Gloire Kayitoghera; KAPIRI, Moïse Musubao; SAHANI, Walere Muhindo. Land Use and Land Cover Dynamics in the Urban Watershed of Kimemi River (Butembo/DRC). Journal of Geoscience and Environment Protection, v. 10, n. 6, p. 204-219, 2022. https://doi.org/10.4236/gep.2022.106013
» https://doi.org/https://doi.org/10.4236/gep.2022.106013 -
MALTHUS, Tim; LEHMANN, Eric; HO, Xavier; BOTHA, Elizabeth; ANSTEE, Janet. Implementation of a Satellite Based Inland Water Algal Bloom Alerting System Using Analysis Ready Data. Remote Sensing, v. 11, n. 24, 2954, 2019. https://doi.org/10.3390/rs11242954
» https://doi.org/https://doi.org/10.3390/rs11242954 -
MAPBIOMAS. Projeto de Mapeamento Anual do Uso e Cobertura da Terra no Brasil. Mapbiomas Brasil, 2023. Available at: https://plataforma.brasil.mapbiomas.org/ Accessed on: Dec. 06, 2023.
» https://plataforma.brasil.mapbiomas.org/ -
MUÑOZ-NÁJERA, Mario Alejandro; TAPIA-SILVA, Felipe Omar; BARRERA-ESCORCIA, Guadalupe; RAMÍREZ-ROMERO, Patricia. Statistical and geostatistical spatial and temporal variability of physico-chemical parameters, nutrients, and contaminants in the Tenango Dam, Puebla, Mexico. Journal of Geochemical Exploration, v. 209. 106435, 2020. https://doi.org/10.1016/j.gexplo.2019.106435
» https://doi.org/https://doi.org/10.1016/j.gexplo.2019.106435 -
OBAID, Altayeb; ADAM, Elhadi; ALI, K. Adem. Land Use and Land Cover Change in the Vaal Dam Catchment, South Africa: A Study Based on Remote Sensing and Time Series Analysis. Geomatics, v. 3, n. 1, p. 205-220. 2023. https://doi.org/10.3390/geomatics3010011
» https://doi.org/https://doi.org/10.3390/geomatics3010011 -
OSTI, João Alexandre Saviolo; CHAMIZO, Ana Carolina Peixoto; OLIVEIRA, Matheus Barbosa Herbst de; CARMO, Clóvis Ferreira do; SANTOS, Kayanne Suen Soares; MORAES, Munique de Almeida Bispo; MERCANTE, Cacilda Thais Janson. Aplicabilidade dos índices de diversidade fitoplanctônica e do estado trófico como indicadores do processo de eutrofização nas áreas do braço do Rio Grande e Corpo Central do reservatório Billings. Research, Society and Development, v. 13, n. 2, e1613244937, 2024. https://doi.org/10.33448/rsd-v13i2.44937
» https://doi.org/https://doi.org/10.33448/rsd-v13i2.44937 -
PEKEL, Jean-François; COTTAM, Andrew; GORELICK, Noel; BELWARD, Alan S. High-resolution mapping of global surface water and its long-term changes. Nature, v. 540, n. 7633, p. 418-422, 2016. https://doi.org/10.1038/nature20584
» https://doi.org/https://doi.org/10.1038/nature20584 -
PIEDRAS, Sérgio Renato Noguez; BAGER, Alex; MORAES, Paulo Roberto Rocha; ISOLDI, Loraine André; FERREIRA, Otoniel Geter Lauz; HEEMANN, Christiane. Macroinvertebrados bentônicos como indicadores de qualidade de água na Barragem Santa Bárbara, Pelotas, RS, Brasil. Ciência Rural, v. 36, n. 2, p. 494-500, 2006. https://doi.org/10.1590/S0103-84782006000200020
» https://doi.org/https://doi.org/10.1590/S0103-84782006000200020 -
PINHEIRO, João Gabriel de Moraes. Modelagem da expansão da mancha urbana do município de Eunápolis/BA através das imagens do satélite Lansat. Revisa Tocantinense de Geografia, v. 13, n. 30, p. 201-216, 2024. https://doi.org/10.70860/rtg.v13i30.18425
» https://doi.org/https://doi.org/10.70860/rtg.v13i30.18425 -
PREIS, Christian Milanez; FRANCO, Davide; VARELA, Sophia Cavalcante. Avaliação do uso e ocupação do solo na bacia hidrográfica do rio Itajaí e simulação para 2027. Geociências, v. 40, n. 2, p. 407-414, 2021. https://doi.org/10.5016/geociencias.v40i02.14321
» https://doi.org/https://doi.org/10.5016/geociencias.v40i02.14321 -
QGIS DEVELOPMENT TEAM. QGIS Geographic Information System. Version 3.16. Open Source Geospatial Foundation Project. QGIS, 2022. Available at: https://qgis.org/ Accessed on: Oct. 31, 2022.
» https://qgis.org/ -
R CORE TEAM. R: A Language and environment for statistical computing. (Version 4.1) [Software]. Viena: R Core Team, 2021. Available at: https://cran.r-project.org (R packages retrieved from MRAN snapshot 2022-01-01). Accessed on: Oct. 21, 2022.
» https://cran.r-project.org -
SANTOS, Arthur Pereira dos; ARANTES, Leticia Tondato; PAULA, Ana Laura de; CUNHA E SILVA, Darllan Colluns da. Avaliação da expansão agropecuária como forma de indicador de degradação ambiental na mesorregião Noroeste do estado de Minas Gerais, Brasil. GeoFocus, Revista Internacional de Ciencia y Tecnología de la Información Geográfica, v. 33, p. 7-26, 2024. http://doi.org/10.21138/GF.839
» https://doi.org/http://doi.org/10.21138/GF.839 - SCHUMANN, Paula Krummreich; BESKOW, Samuel; BRESSIANI, Danielle. Estimativa da perda anual de solo e análise do fator topográfico em uma bacia hidrográfica urbana. In: XXX CONGRESSO DE INICIAÇÃO CIENTÍFICA, 7ª Semana Integrada UFPel, 2021, Pelotas. Congresso [...]. Pelotas: UFPel, 2021.
-
SECRETARIA DO MEIO-AMBIENTE E INFRAESTRUTURA (SEMA). Dados gerais das Bacias Hidrográficas. RS.gov.br, 2023 Available at: https://www.sema.rs.gov.br/bacias-hidrograficas Accessed on: Jul. 15, 2023.
» https://www.sema.rs.gov.br/bacias-hidrograficas -
SERVIÇO AUTÔNOMO DE SANEAMENTO DE PELOTAS (SANEP). Decreto Nº 6.114, de 17 de setembro de 2018. Institui o Plano Municipal de Saneamento Básico (PMSB) do Município de Pelotas/RS e dá outras providências. Pelotas: Prefeitura Municipal de Pelotas, 2018. Available at: https://portal.sanep.com.br/arquivos Accessed on: Jul. 17, 2023.
» https://portal.sanep.com.br/arquivos -
SERVIÇO AUTÔNOMO DE SANEAMENTO DE PELOTAS (SANEP). Estações de Tratamento. SANEP, 2024. Available at: https://portal.sanep.com.br/esgoto/estacoes-tratamento Accessed on: May 02, 2024.
» https://portal.sanep.com.br/esgoto/estacoes-tratamento -
SHEKAR, Padala Raja; MATHEW, Aneesh. Detection of land use/land cover changes in a watershed: A case study of the Murredu watershed in Telangana state, India. Watershed Ecology and the Environment, v. 5, p. 46-55, 2023. https://doi.org/10.1016/j.wsee.2022.12.003
» https://doi.org/https://doi.org/10.1016/j.wsee.2022.12.003 -
SIQUEIRA, João. MapBiomas User-toolkit. MapBiomas, 2021. Available at: https://github.com/mapbiomas-brazil/user-toolkit Accessed on: Oct. 11, 2021.
» https://github.com/mapbiomas-brazil/user-toolkit - SIQUEIRA, Rodrigo de Oliveira; BIERHALS, Daiana Fonseca; SPIERING, Viviane; DE SOUSA, Letícia Penno; GUARINO, Ernestino de Souza Gomes; SANTOS, Jacira Porto dos. Cobertura e uso da terra como subsídio ao programa de pagamento por serviços ambientais em Pelotas (Rio Grande do Sul). In: XVIII SIMPÓSIO BRASILEIRO DE GEOGRAFIA FÍSICA APLICADA - SBGFA, 2019, Fortaleza. Anais [...]. Fortaleza, SBGFA, 2019.
-
THE JAMOVI PROJECT. jamovi. (Version 2.3) [Software]. Sydney: The Jamovi Project, 2022. Available at: https://www.jamovi.org Accessed on: Dec. 14, 2022.
» https://www.jamovi.org - TUNDISI, José Galizia; MATSUMURA-TUNDISI, Takako. Limnologia. São Paulo: Oficina de Textos, 2008.
-
UNITED STATES GEOLOGICAL SURVEY (USGS). Shuttle Radar Topography Mission (SRTM). USGS, 2022. Available at: https://www.usgs.gov/ Accessed on: Jun. 09, 2022.
» https://www.usgs.gov/ - VON SPERLING, Marcos. Introdução à qualidade das águas e ao tratamento de esgotos. Minas Gerais: DESA-UFMG, 1996.
-
WANG, Lei; XU, Min; LIU, Yang; LIU, Hongxing; BECK, Richard; REIF, Molly; EMERY, Erich; YOUNG, Jade; WU, Qiusheng. Mapping Freshwater Chlorophyll-a Concentrations at a Regional Scale Integrating Multi-Sensor Satellite Observations with Google Earth Engine. Remote Sensing, v. 12, n. 20, 3278, 2020. https://doi.org/10.3390/rs12203278
» https://doi.org/https://doi.org/10.3390/rs12203278 -
WANG, Sonam Wangyel; MUNKHNASAN, Lamchin; LEE, Woo-Kyun. Land use and land cover change detection and prediction in Bhutan’s high altitude city of Thimphu, using cellular automata and Markov chain. Environmental Challenges, v. 2, 100017, 2021. https://doi.org/10.1016/j.envc.2020.100017
» https://doi.org/https://doi.org/10.1016/j.envc.2020.100017 -
WIECZOREK, Kinga; TUREK, Anna; SZCZESIO, Małgorzata; WOLF, Wojciech. A holistic approach to the spatio-temporal variability investigation of the main river water quality - The importance of tributaries. Science of The Total Environment, v. 906, 167588, 2024. https://doi.org/10.1016/j.scitotenv.2023.167588
» https://doi.org/https://doi.org/10.1016/j.scitotenv.2023.167588 -
ZHANG, Xiao; CHEN, Xiaomin; ZHANG, Wanshun; PENG, Hong; XU, Gaohong; ZHAO, Yanxin; SHEN, Zhenling. Impact of Land Use Changes on the Surface Runoff and Nutrient Load in the Three Gorges Reservoir Area, China. Sustainability, v. 14, n. 4, 2023, 2022. https://doi.org/10.3390/su14042023
» https://doi.org/https://doi.org/10.3390/su14042023