
 The short-term blurring effect on water security: the connection between watershed quality and water treatment costs
Abstract
It is widely acknowledged that appropriate land use management within watersheds can prevent additional water treatment costs. However, the short-term economic benefits are relatively modest, often discouraging administrators from committing resources to watershed conservation. The existing literature lacks a comprehensive explanation of how watershed quality affects water treatment costs in the long term. Within this context, this study employs operational and water quality data from five drinking water treatment plants in Caxias do Sul, southern Brazil, to define, quantify, and illustrate the “short-term blurring effect” on water security. This effect refers to situations in which small short-term variations in treatment costs mask substantial long-term economic risks. In the short term, results show that a one-unit improvement in the water quality index yields an average reduction of only 0.0002 USD·m-3 in chemical treatment costs. Nevertheless, in the long term, the cumulative effect of watershed quality deterioration may require the adoption of more sophisticated treatment technologies, such as membrane filtration, ultimately augmenting costs by approximately 83 to 242%. These findings demonstrate that reliance on short-term economic indicators can distort water security planning and highlight the need to incorporate long-term treatment costs into watershed management decisions.
Keywords:
land use; water supply; water security.
Resumo
A gestão adequada do uso do solo em áreas de mananciais evita custos adicionais com o tratamento de água. No entanto, os benefícios econômicos de curto prazo são relativamente modestos, o que frequentemente desestimula os gestores a investir na conservação das bacias hidrográficas. A literatura ainda carece de uma explicação sobre como a qualidade da bacia pode afetar os custos de tratamento da água a longo prazo. Nesse contexto, este estudo utiliza dados operacionais e de qualidade da água de cinco sistemas de tratamento de água localizados em Caxias do Sul, RS, para definir, quantificar e ilustrar o chamado “efeito de curto prazo” sobre a segurança hídrica. Esse efeito refere-se a situações em que pequenas variações de curto prazo nos custos de tratamento escondem altos riscos econômicos no longo prazo. Os resultados revelam que, em um horizonte de curto prazo, uma melhoria de uma unidade no índice de qualidade da água resulta em uma diminuição marginal de apenas 0,0002 USD·m-3 nos custos de tratamento. No entanto, no longo prazo, o efeito cumulativo da degradação da qualidade da bacia hidrográfica pode exigir a implementação de tecnologias de tratamento mais sofisticadas, como a filtração por membranas, aumentando os custos em aproximadamente 83 a 242%. A dependência em apenas dados econômicos de curto prazo pode comprometer o planejamento em segurança hídrica, evidenciando a necessidade de incorporar custos de tratamento de longo prazo na gestão de bacias de captação.
Palavras-chave:
uso do solo; abastecimento público; segurança hídrica.
INTRODUCTION
The intensification of land use has contributed to the introduction of several allochthonous constituents into bulk water, prompting the implementation of more stringent water quality regulations. In Brazil, where the majority of drinking water treatment plants (DWTPs) follow conventional methods, the number of regulated contaminants has substantially increased since the 1970s (Brasil, 1997; 1990; 2004; 2011; 2021). Conventional DWTPs are not expected to remove synthetic organic contaminants, pesticides, herbicides, taste, or odor (Elder and Budd, 2011), nor cyanotoxins or disinfection by-products (DBPs) and their precursors (Davis, 2010; Summers, Knappe and Snoeyink, 2011). In addition, international regulatory trends indicate growing concerns regarding new organic and inorganic contaminants, which are expected to lead to future standards with more parameters and stricter maximum contaminant levels (Libânio, 2010).
Source-water protection is widely recognized as a cost-effective strategy for mitigating future treatment complexity, as higher raw water quality generally allows simpler, less chemically intensive treatment processes (Crittenden et al., 2012) and reduced drinking water tariffs. Although this trend is well-recognized, there remains a gap in understanding the precise impact of enhanced bulk water quality on treatment costs, particularly when assessed over different temporal horizons. This interconnectedness between source water quality and drinking water standards raises a critical question for water security planning: Can treatment technologies alone ensure safe water supplies without imposing excessive long-term financial burdens on consumers in the form of higher water tariffs?
Several studies have quantified water treatment costs associated with watershed protection (Dearmont, McCarl and Tolman, 1998; Heberling et al., 2015; Price and Heberling, 2018; Warziniack et al., 2017). These studies consistently show that marginal improvements in raw water quality are associated with relatively small short-term reductions in treatment costs. However, much of the current literature in this field has paid limited attention to how these modest short-term signals may distort long-term decision-making, particularly when watershed degradation ultimately forces utilities to adopt more advanced and costly treatment technologies.
In this study, we introduce and formalize the concept of the “short-term blurring effect”. In the context of water resources management, this effect refers to situations in which short-term data, cost signals, or analytical frameworks misrepresent long-term consequences, leading to decisions that appear economically rational in the short term but generate substantial long-term costs. This concept is particularly relevant when evaluating trade-offs between watershed conservation and drinking water treatment costs, which are ultimately reflected in water tariffs to consumers.
The objective of this paper is therefore to quantify how short-term changes in raw-water quality influence DWTP operational and maintenance (O&M) costs and to demonstrate how these short-term effects can obscure long-term economic risks. Using data from five conventional DWTPs, we
-
correlate chemical treatment costs with watershed quality, the latter expressed using the water quality index introduced by CCME (2001);
-
estimate the long-term incremental O&M costs associated with the need for advanced membrane treatment under watershed degradation scenarios; and
-
illustrate how reliance on short-term cost indicators can blur the perception of long-term water security risks.
By highlighting the blurring effect, it underscores the importance of aligning present water and land allocation decisions with a long-term perspective, rather than solely focusing on short-term economic gains. And by explicitly linking watershed quality, operational costs, and long-term treatment requirements, this study contributes to the integration of water supply planning and watershed management, and provides insights beyond the specific case study.
Area of study
Five conventional DWTP systems, operated by the Public Water and Wastewater of Caxias do Sul (SAMAE) in southern Brazil, were analyzed. Caxias do Sul is a medium-sized municipality with a population of around half a million inhabitants (IBGE, s.d.b), with the second-largest economy of the state of Rio Grande do Sul and a Gross Domestic Product (GDP) of US$ 7.82 billion in 2023 (Rio Grande do Sul, 2025). The region features a subtropical climate characterized by humid winters and mild summers, alongside an uneven distribution of annual rainfall, ranging from 1,750 to 2,300 mm (Belladona and De Vargas, 2017).
Due to its geographical location and geomorphological characteristics, Caxias do Sul relies on a group of relatively small reservoirs formed by damming headwater streams for its water supply. Each reservoir serves a local DWTP, operating independently from the others. Figure 1 depicts the municipal watersheds, the pipeline network, and the locations of the respective DWTPs. Table 1 summarizes key quantitative information for each system, including plant capacity, expressed as both current treatment flow and maximum design capacity, according to the population served. Isolated rural communities are supplied by local groundwater systems.

METHODOLOGY
The methodology employed in this study comprises two sequential steps. The initial step involves establishing a water quality index to assess the existing quality of each watershed, allowing for a correlation with the chemical costs of the respective DWTP. Finally, to illustrate the potential economic repercussions, particularly the incremental O&M costs associated with variable water quality in the long term, we estimate the costs of implementing advanced membrane treatment as a supplementary treatment following the conventional treatment process. Data were obtained from SAMAE and from the literature.
Correlation between watershed quality and chemical treatment costs
Turbidity is a common parameter measured in treatment facilities, often serving as a surrogate for water quality assessment. However, it fails to capture the multiple physical, chemical, and biological stressors associated with land use change at the watershed, and does not accurately reflect the direct treatment costs, since the addition of polymer during coagulation in conventional treatment is not directly proportional to nephelometric turbidity units (NTU) (Crittenden et al., 2012). To address this limitation, we employed the Water Compliance Index (WCI), adapted from the CCME (2001) methodology, as a proxy for watershed quality and land use pressure.
Water quality indexes offer a concise means to summarize intricate water quality data, reducing processing time and enhancing comprehension for both administrative and general audiences (CCME, 2001; Ho et al., 2019). The model outlined by CCME (2001) incorporates data routinely monitored at water utilities, incorporating three factors and a minimum of four variables sampled at least four times within the specified period. In line with our quality objective, which aimed to comply with Level 2 of the Brazilian water quality guidelines regulation (Brasil, 2005), we refer to this index as the WCI. The WCI ranges from 0 (indicating the poorest quality) to 100 (representing the highest quality).
For the composition of the WCI, we selected six routinely monitored parameters in conventional DWTPs, encompassing biological, chemical, and physical pollutants: dissolved oxygen (DO), cyanobacteria, turbidity, manganese, nitrite, and pH. DO and manganese influence water taste and odor, while cyanobacteria can synthesize highly toxic biologically active substances (Goncharuk, 2014). Turbidity levels exceeding four NTUs render water visually unacceptable for consumption (Pandit and Kumar, 2019). Although pH typically has no direct impact on consumers, it is preferred to be less than eight to facilitate effective water clarification and disinfection (WHO, 2017). Nitrite poses health risks in drinking water, potentially leading to conditions such as methemoglobinemia, which can result in cyanosis (Semitsoglou-Tsiapou et al., 2016). These parameters are directly influenced by land use practices. For example, turbidity and nitrite are closely associated with surface runoff from agricultural and urban areas. Cyanobacteria proliferation reflects nutrient enrichment, and manganese mobilization is often linked to erosion and reservoir stratification.
Annual chemical costs (coagulants, disinfectants, and powdered activated carbon (PAC)) were correlated with WCI values using Pearson’s correlation, which examines linear relationships (Frost, 2019), and least-squares linear regression. Chemical costs were selected because they respond most directly to short-term changes in raw water quality, whereas labor and energy costs are also influenced by plant design and operational constraints. The relationship between the two variables was elucidated through the least-squares regression line (f(x) = α·x+β) (Spiegel and Stephens, 2018). Table 2 provides a conventional interpretation of Pearson’s correlation coefficients (R).
Estimation of advanced membrane treatment costs
To represent long-term treatment escalation under watershed degradation, we estimated O&M costs for membrane-based advanced treatment using full-scale data reported in the literature.
Before conducting our analysis, all cost figures and indexes were adjusted to United States dollar (USD) values of December 2019 using the Consumer Price Index (CPI) (BLS, s.d.). Leveraging the literature data and recognizing the non-linearity of the distribution, we employed nonlinear regression based on the power law model f(x) = a·xb, where a and b represent the coefficients of the model (Gallant, 1975; Rhinerhart, 2016). These nonlinear regression models were fitted to plant-capacity data, explicitly capturing economies of scale, which are particularly relevant for large systems. Additionally, we performed an exploratory data analysis (Tukey, 1977).
Capital costs were excluded from the quantitative analysis to maintain consistency with the short-term O&M focus. However, capital expenditure often represents the primary barrier to technology adoption (Thirumal et al., 2024).
Data on operational and maintenance costs for conventional treatment
O&M expenses for conventional treatment were primarily sourced from SAMAE for the period spanning from 2011 to 2019. These O&M costs encompass both fixed and variable costs. Fixed costs typically include labor and administrative expenses, while variable costs include chemicals, electricity, repairs, and other supplies and services essential for plant operation (McGivney and Kawamura, 2008).
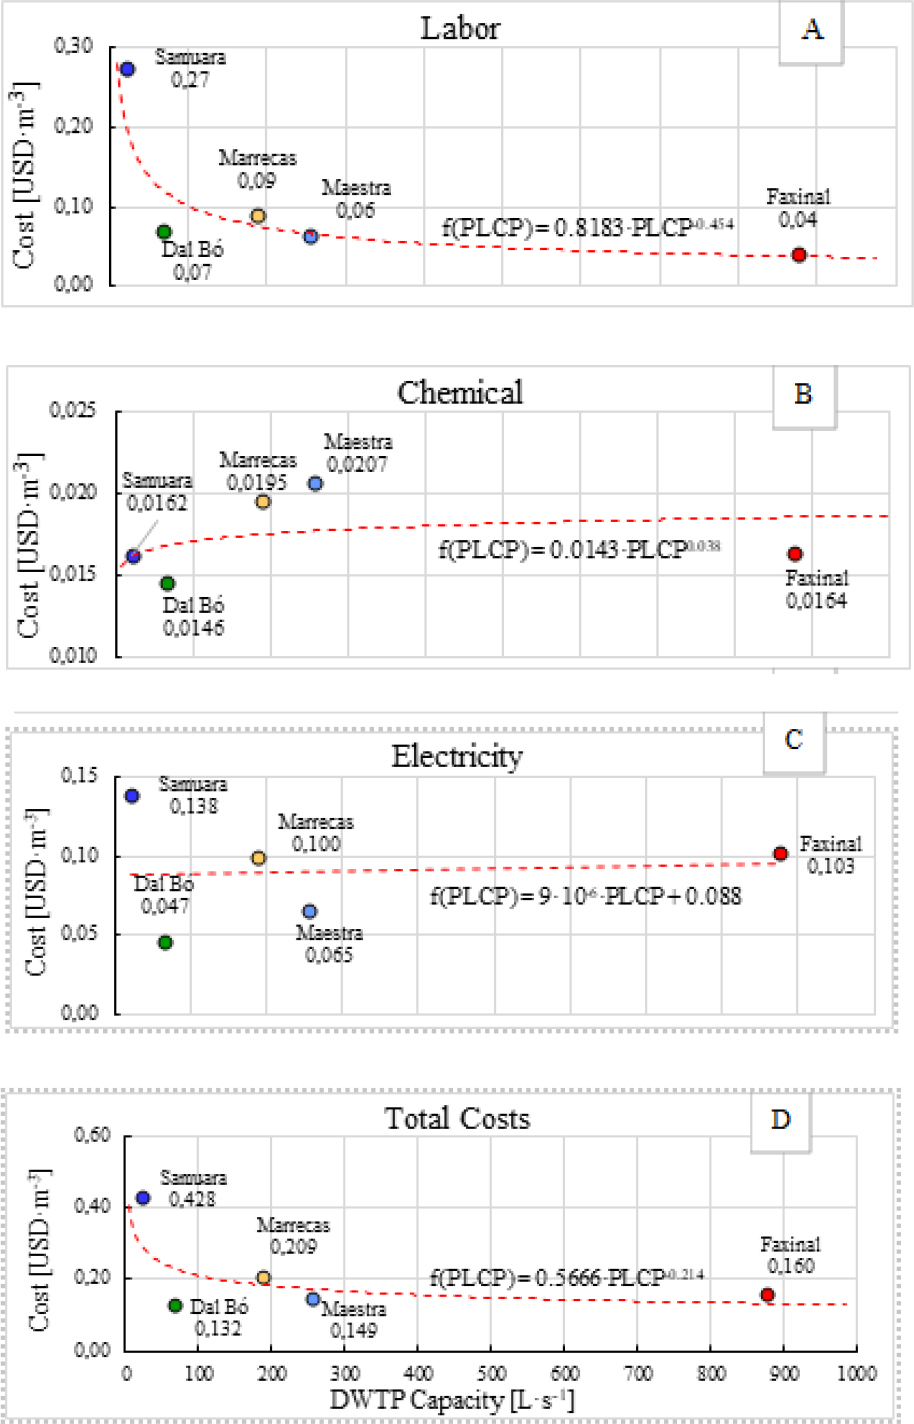
Given that this research examines costs from the watershed to treatment, our definition of O&M costs is restricted to the sum of expenses associated with labor, chemicals, and electricity. Consequently, distribution, administration, and opportunity costs of the systems were not factored into this analysis. Capital costs were also excluded, aligning with the objective of this study on quantifying the incremental O&M costs associated with variable water quality. Figure 2 illustrates the mean O&M costs from January 2011 to December 2019. All costs are expressed in USD, with historical costs adjusted to December 2019 using the IPCA (IBGE, s.d.a), and an exchange rate of 1 USD to 4.10 BRL was applied according to the Central Bank of Brazil (BCB, s.d.).

Treated flow and water quality data for each drinking water treatment plant
Monthly treated water volumes at each DWTP and raw water quality data were obtained from SAMAE for the period from 2011 to 2019. To comply with environmental and water quality legislation, regular testing of bulk water quality is necessary. Sampling is conducted at frequent intervals at the water inlet tower of each SAMAE’s reservoir, before reaching the pumping station. However, only one analysis per month is required for each system to establish the WCI.
Reference for advanced membrane treatment costs
Since the quality requirements of both raw water and drinking water play a pivotal role in the design of the treatment process (McGivney and Kawamura, 2008), and considering that the interaction between membrane properties and water quality is generally not thoroughly understood (Alspach et al., 2008), our database compiles the costs associated with treating various water sources. These sources include seawater, brackish water, reclaimed water, groundwater, and surface water. Furthermore, the database encompasses the most commonly utilized filtration systems, such as microfiltration (MF), ultrafiltration (UF), nanofiltration (NF), and reverse osmosis (RO) (Zoubeik et al., 2018). The data related to these costs were derived from bibliographic sources.
RESULTS AND DISCUSSION
Water quality, chemical costs, and risk perception
The relationship between WCI and chemical costs differed substantially among the five systems (Figure 3). In several cases, treatment decisions were influenced not only by measured raw water quality but also by perceived risk, particularly regarding episodic contamination events.

Water Compliance Index and chemical costs behavior for each drinking water treatment plant system.
This behavior is especially evident for the Faxinal system, the largest DWTP in the municipality. Despite a gradual improvement in WCI over the study period, chemical costs increased, resulting in a positive α coefficient (0.0002 - Table 3). This apparent anomaly reflects a risk-averse operational strategy, in which continuous or precautionary PAC dosing was maintained to safeguard supply reliability. In large systems such as Faxinal, economies of scale reduce unit costs, effectively “dissolving” the marginal impact of water quality improvements and reinforcing discretionary chemical use.
Least-squares equation (f(x) = ax+β) constants and Pearson’s correlation coefficients for each drinking water treatment plant system.
The Maestra system consistently exhibited the lowest WCI, while incurring the highest costs. However, the values in this period remained relatively constant.
By contrast, smaller systems such as Samuara and Dal Bó exhibited strong inverse correlations, where declining WCI values directly translated into higher chemical costs. These systems lack buffering capacity and are therefore more sensitive to short-term watershed disturbances.
Regrettably, the relatively short operational history of the Marrecas system limits a more comprehensive assessment of its long-term behavior. The WCI in this system remained comparatively stable after 2015, decreasing only marginally from 79.8 to 76.5. Nevertheless, chemical costs have increased discernibly, rising from 0.018 to 0.023 USD·m-3. This trend can be attributed to the increased production levels and to a prevailing perception of risk associated with raw water quality.
Table 3 reveals statistically significant relationships between the WCI and chemical costs in the Faxinal, Marrecas, Dal Bó, and Samuara systems. Notably, these correlations were not consistently inverse, as reflected by the α coefficient, which represents the rate of change in chemical costs in response to variations in the WCI. In the case of the Faxinal system, a direct relationship was identified, with chemical costs increasing as the WCI improved. This direct correlation exhibited considerable variability over the study period while maintaining a moderate correlation strength, as indicated by an R value of 0.488.
By contrast, there is limited evidence of a meaningful relationship between chemical usage and watershed quality in the Maestra system. Although the correlation coefficient is low (R = 0.135), the associated p-value indicates that the relationship is statistically significant, suggesting a weak but non-random association between these variables.
Specifically for the Marrecas, Dal Bó, and Samuara systems, the results reveal inverse correlations between the WCI and chemical costs, indicating that declines in watershed quality are associated with increased chemical expenditures. Pearson’s correlation coefficients indicate strong relationships in the Marrecas and Samuara systems and a moderate relationship in the Dal Bó system. The negative sign of the α coefficient confirms that deteriorating water or watershed quality leads to higher chemical treatment costs, whereas improvements in the WCI are associated with cost reductions.
When assessed jointly (Figure 4), the five DWTP systems in Caxias do Sul reveal potential risks to urban water security. Watershed degradation may ultimately translate into higher water tariffs, as it requires greater inputs within treatment processes. In this aggregated analysis, the least-squares regression equation was determined as y = -0.0002·x + 0.0326, exhibiting a moderate correlation (R = 0.45) and a highly significant p-value (< 0.0001). This relationship implies a marginal change of only 0.0002 USD·m-3 in chemical treatment costs for a one-unit change in the WCI across the municipality.

Correlation between chemical treatment costs and the Water Compliance Index for all drinking water treatment plant systems.
Similar patterns have been reported in previous studies. Dearmont et al. (1998) estimated that a 1% reduction in turbidity corresponded to a decrease of only 0.27% in chemical costs (0.000083 USD·m-3·year-1) for the plant studied. Freeman et al. (2007) also associated higher treatment costs with lower water quality indices, reporting chemical costs ranging from 0.0046 to 0.1274 USD·m-3·year-1. This wide cost range was attributed to varying operational procedures, economies of scale, and regional pricing structures. Similarly, Abildtrup, Garcia and Stenger (2013) estimated the economic value of forest ecosystem services for water quality protection, finding that a 1% increase in forest cover would lead to a reduction of 0.00904 USD·m-3 in treatment costs.
The marginal cost reduction associated with a one-unit improvement in the WCI may appear insufficient to motivate action in the short term. As a result, investments aimed at watershed conservation and raw water quality enhancement may seem unattractive to both public and private utilities. However, such short-term economic reasoning can contribute to a short-term blurring effect on urban water security. Conventional treatment processes have inherent limitations and can only accommodate a finite degree of surface water degradation. They are ineffective at removing synthetic organic contaminants, cyanotoxins, DBPs and their precursors, and taste and odor compounds (Crittenden et al., 2012; Davis, 2010; Teixeira et al., 2020).
In scenarios where short-term political or economic incentives fail to align with watershed conservation and raw water quality deteriorates beyond the capacity of conventional treatment to ensure potability, utilities are typically faced with two alternatives: importing water from more distant sources or integrating advanced treatment technologies, such as membrane filtration, into existing treatment trains. In both cases, substantial increases in treatment costs are expected.
Additional treatment costs with membrane filtration
To estimate the O&M costs associated with the implementation of membrane filtration as a complement to conventional treatment under scenarios of declining watershed quality, we compiled membrane treatment cost data from published studies that met predefined selection criteria (Figure 5). The resulting dataset includes a range of water sources (not limited exclusively to fresh surface waters) and encompasses four types of pressure-driven membrane processes: MF, UF, NF, and RO.

Normalized operational and maintenance costs for membrane-based treatment systems reported worldwide.
This broad compilation was necessary due to the limited availability of full-scale studies reporting membrane filtration O&M costs specifically for the treatment of fresh surface water. Furthermore, as previously noted, there remains limited empirical understanding of the interplay between membrane performance, fouling behavior, and raw water quality characteristics (Alspach et al., 2008). Consequently, the use of a heterogeneous dataset represents a pragmatic approach to capturing the order of magnitude of potential cost increases associated with the adoption of advanced treatment. The regression equations derived from the literature, along with the corresponding cost data, are shown in Table 4.
Curve regression equations for membrane advanced operational and maintenance treatment costs.
In this analysis, the dependent variable corresponds to the normalized O&M cost per cubic meter of treated water, while plant capacity serves as the independent variable. For example, reported O&M costs for advanced membrane treatment at a DWTP with a capacity of approximately 3,000 L·s-1 range from 0.04 to 1.72 USD·m-3. For smaller systems, such as DWTPs with capacities of 30 L·s -1 and 1,000 L·s,-1,the corresponding cost increase to 0.11–2.96 USD·m -3 and 0.06-1.96 USD·m-3, respectively. These wide ranges underscore the substantial variability in reported membrane treatment costs and are consistent with observations by McGivney and Kawamura (2008), who noted that O&M expenditures may vary considerably even among plants with similar design capacities and instrumentation, including within the same company.
The influence of economies of scale is further illustrated in Figure 6, which presents box- and-whisker plots of membrane treatment costs as a function of plant capacity. Most costs exceeding 1 USD·m-3 are identified as outliers, predominantly associated with RO and NF applications in low-capacity systems. In the context of this study, the median costs decrease from approximately 0.50 USD·m-3 for a 20 L·s-1 DWTP to about 0.13 USD·m-3 for a 3,000 L·s-1 DWTP, a trend primarily attributed to economies of scale.

Figure 6 also reveals a positive skewness in the cost distributions, particularly for larger production plants, indicating that most observations cluster near the lower end of the cost spectrum, with relatively few high-cost values exerting disproportionate influence. Given that outliers can significantly bias statistical analyses and lead to misleading interpretations (Barnett and Lewis, 1978; Pearson, 2018), these values were excluded from subsequent regression analyses.
After removing outliers, the median O&M costs ranged from 0.38 to 0.13 USD·m-3 across the evaluated capacity range. The mean and median cost trends were then fitted using power-law relationships, yielding the following equations and Pearson’s correlation coefficients:
-
f(PLCP)mean = 0.744 × PLCP-0.164, R = 0.982.
-
f(PLCP)median = 0.755 × PLCP-0.208, R = 0.992.
These strong correlations confirm the dominant role of plant capacity in shaping membrane treatment costs.
To further illustrate the influence of outliers, Table 5 compares the median, mean, and standard deviation values computed using the full dataset and the dataset excluding outliers. The removal of outliers resulted in a 48.1% reduction in the mean cost value, despite the exclusion of only 11.2% of records. The standard deviation decreased even more markedly, by 71.3%, highlighting the disproportionate impact of extreme values on summary statistics.
Influence of outliers in membrane treatment cost on median, mean, and standard deviation values.
These results demonstrate that while membrane filtration can substantially increase treatment costs relative to conventional processes, the magnitude of this increase is highly dependent on system scale. Importantly, even median cost estimates for large plants represent a significant escalation relative to conventional treatment, reinforcing the argument that long-term watershed degradation can impose substantial financial burdens that are not captured by short-term operational cost indicators.
The short-term blurring effect and long-term water security implications
The intensification of land use, growing concerns over emerging organic and inorganic contaminants, and the prospect of increasingly stringent drinking water quality standards collectively challenge the long-term viability of conventional water treatment systems. In this evolving trend, utilities may be compelled either to explore alternative water sources, where available, or to integrate supplementary treatment processes, particularly in municipalities where watershed protection is limited or absent.
The short-term blurring effect emerges when decision-makers focus on marginal short-term savings while overlooking the substantial long-term consequences of watershed degradation. They often weigh substantial and immediate economic gains associated with intensive land use against the apparently modest short-term benefits of avoided water treatment costs. This asymmetry in perceived benefits contributes to what we define as the short-term blurring effect.
Table 6 summarizes the current O&M costs of conventional treatment for the five analyzed DWTPs and presents the estimated median additional costs associated with the adoption of advanced membrane filtration, based on each plant’s treatment capacity. The results indicate a substantial escalation in long-term operational expenditures, with total O&M costs increasing by 83 to 242% when membrane treatment is required to complement conventional processes. These findings are consistent with the broader literature, including McDonald et al. (2016), which highlights the economic vulnerability of drinking water systems to declining watershed conditions.
Total operational and maintenance costs and estimated additional membrane treatment costs for the five drinking water treatment plants.
Taken together, these results illustrate how the short-term blurring effect constitutes a tangible long-term risk to urban water security. Although the marginal increase in treatment costs associated with incremental watershed degradation may appear modest (for example, not exceeding 0.0017 USD·m-3 per unit change in the WCI, as observed for the Marrecas system), such changes can accumulate over time and across systems. In short-term decision-making contexts, these marginal costs may fail to justify investments in watershed conservation, particularly when political, institutional, or financial constraints limit available resources.
Ultimately, however, the transition toward advanced treatment technologies entails significant cost transfers to consumers through higher water tariffs, with potential repercussions for the social and economic well-being of the municipality. This dynamic partially shifts attention away from preventive watershed management and toward reactive treatment solutions, diverging from the broader and more integrated notion of water security emphasized by the United Nations (UN, 2013).
CONCLUSIONS
This study contributes to the understanding of long-term economic and environmental trade-offs in urban water supply systems by linking watershed quality, treatment costs, and decision-making horizons. The results underscore the importance of land use planning in assessing water treatment costs, while supporting four main conclusions:
-
The WCI proved to be an effective proxy for capturing variations in source water quality associated with land use dynamics, enabling a consistent assessment of how watershed conditions influence drinking water treatment costs. Its application supports integrated economic and environmental analyses and provides a practical indicator for evaluating risks to urban water security.
-
Watershed conservation strategies may appear economically unattractive when evaluated solely through short-term cost signals, particularly when marginal reductions in treatment costs are small. This study demonstrates that such limited short-term benefits can generate a short-term blurring effect, masking the substantial long-term costs of cumulative watershed degradation.
-
The escalation of treatment costs driven by declining source water quality manifests predominantly in the long term, often when conventional treatment processes become insufficient to meet regulatory or operational requirements. Although technological advances may partially offset these costs over time, significant uncertainty and financial risk remain.
-
The findings provide a conceptual and analytical basis for the development of more forward-looking water and land use policies, emphasizing preventive watershed management over reactive treatment-based solutions. Such policies are better suited to anticipate future treatment requirements and mitigate long-term economic and social impacts, including increases in consumer water tariffs.
Despite these contributions, this study has limitations. The relationship between chemical consumption at DWTPs and raw water quality is influenced by multiple factors, including land use heterogeneity, operational practices, and risk perception among utilities. In addition, the continuous expansion of regulated contaminants and increasingly stringent drinking water standards are likely to further constrain the effectiveness of conventional treatment systems, reinforcing the need for watershed conservation.
By formalizing the short-term blurring effect, this research contributes a conceptual and analytical framework applicable to other regions characterized by small reservoirs, variable hydrology, and increasing land use pressure. Although based on a Brazilian case study, the findings are relevant to international contexts facing similar regulatory and environmental challenges.
Future research should prioritize the compilation of longer-term datasets, integrating water quality, treatment performance, and cost information. Such efforts would strengthen decision-making frameworks aimed at safeguarding urban water security.
DATA AVAILABILITY STATEMENT
The datasets generated and/or analyzed during the current study are available from the corresponding author upon reasonable request.
-
Funding:
National Council for Scientific and Technological Development (Conselho Nacional de Desenvolvimento Científico e Tecnológico – CNPq), under grant number 311263/2023-2.
REFERENCES
-
ABILDTRUP, Jens; GARCIA, Serge; STENGER, Anne. The Effect of Forest Land Use on the Cost of Drinking Water Supply: A Spatial Econometric Analysis. Ecological Economics, v. 92, p. 126-136, 2013. https://doi.org/10.1016/j.ecolecon.2013.01.004
» https://doi.org/10.1016/j.ecolecon.2013.01.004 -
AKOGLU, Haldun. User’s Guide to Correlation Coefficients. Turkish Journal of Emergency Medicine, v. 18, n. 3, p. 91-93, 2018. https://doi.org/10.1016/j.tjem.2018.08.001
» https://doi.org/10.1016/j.tjem.2018.08.001 -
ALSPACH, Brent; ADHAM, Samer; COOKE, Trevor; DELPHOS, Paul; GARCIA-ALEMAN Jesus; JACANGELO, Joe; KARIMI, Ali; PRESSMAN, Jonathan; SCHAEFER, Jim; SETHI, Sandeep. Microfiltration and Ultrafiltration Membranes for Drinking Water. Journal American Water Works Association, v. 100, n. 12, p. 84-97, 2008. https://doi.org/10.1002/j.1551-8833.2008.tb09801.x
» https://doi.org/10.1002/j.1551-8833.2008.tb09801.x -
BANCO CENTRAL DO BRASIL – BCB. Currency Conversion. Banco do Brasil, [s.d.]. Available at: https://www.bcb.gov.br/en/currencyconversion Accessed on: Oct. 20, 2020.
» https://www.bcb.gov.br/en/currencyconversion - BARNETT, Vic; LEWIS, Toby. Outliers in Statistical Data Bath: John Wiley & Sons, 1978.
-
BELLADONA, Rossano; DE VARGAS, Tiago. Space-Time Precipitation Distribution and the Relevance of the Orography of Caxias Do Sul, Brazil. Revista Brasileira de Cartografia, v. 69, n. 3, p. 607-620, 2017. https://doi.org/10.14393/rbcv69n3-44353
» https://doi.org/10.14393/rbcv69n3-44353 -
BHOJWANI, Sumay; TOPOLSKI, Kevin; MUKHERJEE, Rajib; SENGUPTA, Debalina; EL-HALWAGI, Mahmoud. Technology Review and Data Analysis for Cost Assessment of Water Treatment Systems. Science of the Total Environment, v. 651, p. 2749-2761, 2019. https://doi.org/10.1016/j.scitotenv.2018.09.363
» https://doi.org/10.1016/j.scitotenv.2018.09.363 -
BRADSHAW, Jonathan; ASHOORI, Negin; OSORIO, Mauricio; LUTHY, Richard. Modeling Cost, Energy, and Total Organic Carbon Trade-Offs for Stormwater Spreading Basin Systems Receiving Recycled Water Produced Using Membrane-Based, Ozone-Based, and Hybrid Advanced Treatment Trains. Environmental Science and Technology, v. 53, n. 6, p. 3128-3139, 2019. https://doi.org/10.1021/acs.est.9b00184
» https://doi.org/10.1021/acs.est.9b00184 - BRASIL. Ministério da Saúde. Portaria No 56 BSB/MS, de 14 de março de 1977. Aprova a primeira regulamentação sobre qualidade da água para consumo humano a ser aplicada em todo o território nacional. Ministério da Saúde, Brasília, 1977.
- BRASIL. Ministério da Saúde. Portaria N° 36 GM/MS, de 19 de janeiro de 1990. Aprova normas e o padrão de potabilidade da água para consumo humano em todo o território nacional. Ministério da Saúde, Brasília, 1990.
- BRASIL. Ministério da Saúde. Portaria No 518, de 25 de março de 2004. Estabelece os procedimentos e responsabilidades relativos ao controle e vigilância da qualidade da água para consumo humano e seu padrão de potabilidade, e dá outras providências. Ministério da Saúde, Brasília, 2004.
- BRASIL. Conselho Nacional do Meio-Ambiente – CONAMA. Resolução No 357, de 18 de Março de 2005. Dispõe sobre a classificação dos corpos de água e diretrizes ambientais para o seu enquadramento, bem como estabelece as condições e padrões de lançamento de efluentes, e dá outras providências. CONAMA, Brasil, 2005.
- BRASIL. Ministério da Saúde. Portaria No 2914, de 12 de dezembro de 2011. Dispõe sobre os procedimentos de controle e de vigilância da qualidade da água para consumo humano e seu padrão de potabilidade. Ministério da Saúde, Brasília, 2011.
- BRASIL. Ministério da Saúde. Portaria No 888 GM/MS, de 4 de Maio de 2021. Altera o Anexo XX da Portaria de Consolidação nº 5/GM/MS, de 28 de setembro de 2017, para dispor sobre os procedimentos de controle e de vigilância da qualidade da água para consumo humano e seu padrão de potabilidade. Ministério da Saúde, Brasília, 2021.
-
BUREAU OF LABOR STATISTICS - BLS. Consumer Price Index-CPI. U.S. Bureau of Labor Statistics, [s.d.]. Available at: https://www.bls.gov/cpi/. Accessed on: Dec. 12, 2020.
» https://www.bls.gov/cpi/. - CANADIAN COUNCIL OF MINISTERS OF THE ENVIRONMENT – CCME. Canadian Water Quality Guidelines for the Protection of Aquatic Life: CCME Water Quality Index 1.0, User’s Manual. Winnipeg: Canadian Council of Ministers of the Environment, 2001.
-
CHELLAM, Shankar; SERRA, Christophe.; WIESNER, Mark Robert. Estimating Costs for Integrated Membrane Systems. Journal American Water Works Association, v. 90, n. 11, p. 96-104, 1998. https://doi.org/10.1002/j.1551-8833.1998.tb08537.x
» https://doi.org/10.1002/j.1551-8833.1998.tb08537.x - CRITTENDEN, John; TRUSSELL, R. Rhodes; HAND, David; HOWE, Kerry; TCHOBANOGLOUS, George. MWH’s Water Treatment: Principles and Design. 3. ed. New Jersey, USA: John Wiley & Sons, 2012.
- DAVIS, Mackenzie. Water and Wastewater Engineering: Design, Principles and Practice. New York: McGraw-Hill, 2010.
-
DEARMONT, David; MCCARL, Bruce; TOLMAN, Deborah. Cost of Water Treatment Due to Diminished Water Quality : A Case Study in Texas. Water Resources Research, v. 34, n. 4, p. 849-853, 1998. https://doi.org/10.1029/98WR00213
» https://doi.org/10.1029/98WR00213 - ELDER, Doug; BUDD, George. Overview of Water Treatment Processes. In: EDZWALD, James. (Ed.). Water Quality and Treatment: A Handbook on Drinking Water New York: McGraw-Hill, 2011. p. 5.1-5.38.
-
FREEMAN, Jade; MADSEN, Rebecca; HART, Kelley. Statistical Analysis of Drinking Water Treatment Plant Costs, Source Water Quality, and Land Cover Characteristics. Trust for Public Land, 2007. Available at: http://cloud.tpl.org/pubs/landwater_9_2008_whitepaper.pdf. Accessed on: Aug. 29, 2020.
» http://cloud.tpl.org/pubs/landwater_9_2008_whitepaper.pdf. - FROST, Jim. Regression Analysis: An Intuitive Guide for Using and Interpreting Linear Models. California: Jim Publishing, 2019.
-
GALLANT, A. Ronald. Nonlinear Regression. The American Statistician, v. 29, n. 2, p. 73-81, 1975. https://doi.org/10.1080/00031305.1975.10477374
» https://doi.org/10.1080/00031305.1975.10477374 - GONCHARUK, Vladyslav. Drinking Water: Physics, Chemistry and Biology. Cham: Springer International Publishing, 2014.
-
HEBERLING, Matthew; NIETCH, Hale; THURSTON, Christopher; ELOVITZ, Michael; BIRKENHAUER, Kelly; PANGULURI, Srinivas; RAMAKRISHNAN, Balaji; HEISER, Eric; NEYER, Tim. Comparing Drinking Water Treatment Costs to Source Water Protection Costs Using Time Series Analysis. Water Resources Research, v. 51, n. 11, p. 8741-8756, 2015. https://doi.org/10.1002/2014WR016422
» https://doi.org/10.1002/2014WR016422 -
HO, Jun Yung; AFAN, Haitham Abdulmohsin; EL-SHAFIE, Amr; KOTING, Suhana Binti; MOHD, Nuruol Syuhadaa; JAAFAR, Wan Zurina Binti; SAI, Hin Lai; MALEK, Marlinda Abdul; AHMED, Ali Najah; MOHTAR, Wan Hanna Melini Wan; ELSHORBAGY, Amin; EL-SHAFIE, Ahmed. Towards a Time and Cost Effective Approach to Water Quality Index Class Prediction. Journal of Hydrology, v. 575, p. 148-165, 2019. https://doi.org/10.1016/j.jhydrol.2019.05.016
» https://doi.org/10.1016/j.jhydrol.2019.05.016 -
INSTITUTO BRASILEIRO DE GEOGRAFIA E ESTATÍSTICA - IBGE. Índice Nacional de Preços Ao Consumidor Amplo - IPCA. IBGE, [s.d.a]. Available at: https://www.ibge.gov.br/estatisticas/economicas/precos-e-custos/9256-indice-nacional-de-precos-ao-consumidor-amplo.html?=&t=series-historicas. Accessed on: Jul. 3, 2020.
» https://www.ibge.gov.br/estatisticas/economicas/precos-e-custos/9256-indice-nacional-de-precos-ao-consumidor-amplo.html?=&t=series-historicas -
INSTITUTO BRASILEIRO DE GEOGRAFIA E ESTATÍSTICA - IBGE. Cidades e Estados do Brasil. IBGE, [s.d.b]. Available at: https://cidades.ibge.gov.br/. Accessed on: Oct. 17, 2023.
» https://cidades.ibge.gov.br/. - LIBÂNIO, Marcelo. Fundamentos de Qualidade e Tratamento de Água. 3. ed. Campinas: Editora Átomo, 2010.
-
MCDONALD, Robert I.; WEBER, Katherine F.; PADOWSKIC, Julie; BOUCHER, Tim; SHEMIE, Daniel. Estimating Watershed Degradation over the Last Century and Its Impact on Water-Treatment Costs for the World’s Large Cities. Proceedings of the National Academy of Sciences of the United States of America, v. 113, n. 32, p. 9117-9122, 2016. https://doi.org/10.1073/pnas.1605354113
» https://doi.org/10.1073/pnas.1605354113 - MCGIVNEY, William; KAWAMURA, Susumu. Cost Estimating Manual for Water Treatment Facilities Hoboken: John Wiley & Sons, 2008.
- PANDIT, Aniruddha Bhalchandra; KUMAR, Jyoti Kishen. Drinking Water Treatment for Developing Countries: Physical, Chemical and Biological Pollutants. London: Royal Society of Chemistry, 2019.
- PEARSON, Ronald K. Exploratory Data Analysis Using R Boca Raton: CRC Press, 2018.
-
PLUMLEE, Megan; STANFORD, Benjamin; DEBROUX, Jean-François; HOPKINS, D. Cory; SNYDER, Shane Allen. Costs of Advanced Treatment in Water Reclamation. Ozone: Science & Engineering, v. 36, n. 5, p. 485-495, 2014. https://doi.org/10.1080/01919512.2014.921565
» https://doi.org/10.1080/01919512.2014.921565 -
PRICE, James; HEBERLING, Matthew. The Effects of Source Water Quality on Drinking Water Treatment Costs: A Review and Synthesis of Empirical Literature. Ecological Economics, v. 151, p. 195-209, 2018. https://doi.org/10.1016/j.ecolecon.2018.04.014
» https://doi.org/10.1016/j.ecolecon.2018.04.014 - RHINERHART, Robert Russell. Nonlinear Regression Modeling for Engineering Applications: Modeling, Model Validation, and Enabling Design of Experiments. Hoboken: John Wiley & Sons, 2016.
-
RIO GRANDE DO SUL. Secretaria de Planejamento, Governança e Gestão. Departamento de Economia e Estatística. PIB dos municípios do RS em 2022 e 2023 Nota Técnican. 123/2025. Porto Alegre, 2025. Available at: https://estado.rs.gov.br/upload/arquivos/202512/nt-123-pib-dos-municipios-do-rs-em-2022-e-2023.pdf. Accessed on: Apr. 24, 2026.
» https://estado.rs.gov.br/upload/arquivos/202512/nt-123-pib-dos-municipios-do-rs-em-2022-e-2023.pdf. -
SCHOBER, Patrick; BOER, Christa; SCHWARTE, Lothar Andreas. Correlation Coefficients: Appropriate Use and Interpretation. Anesthesia and Analgesia, v. 126, n. 5, p. 1763-1768, 2018. https://doi.org/10.1213/ANE.0000000000002864
» https://doi.org/10.1213/ANE.0000000000002864 -
SEMITSOGLOU-TSIAPOU, Sofia; MOUS, Astrid; TEMPLETON, Michael; GRAHAM, Nigel; LEAL, Lucía Hernández; KRUITHOF, Joop. The Role of Natural Organic Matter in Nitrite Formation by LP-UV/H2O2 Treatment of Nitrate-Rich Water. Water Research, v. 106, p. 312-319, 2016. https://doi.org/10.1016/j.watres.2016.10.001
» https://doi.org/10.1016/j.watres.2016.10.001 -
SERVIÇO AUTÔNOMO MUNICIPAL DE ÁGUA E ESGOTO - SAMAE. Recursos Hídricos. SAMAE, [s.d]. Available at: http://www.samaecaxias.com.br/Pagina/Index/10044. Accessed on: Jul. 11, 2025.
» http://www.samaecaxias.com.br/Pagina/Index/10044. - SPIEGEL, Murray; STEPHENS, Larry. Statistics 6. ed. New York: McGraw-Hill, 2018.
- STANFORD, Benjamin; DEBROUX, Jean François; PLUMLEE, Megan; REINERT, Allison. Costs of Advanced Treatment in Water Reclamation. In: 86TH ANNUAL WATER ENVIRONMENT FEDERATION TECHNICAL EXHIBITION AND CONFERENCE, 10, 2013, Chicago. Conference [...]. Chicago: WEFTEC, 2013. p. 6388-6395.
- SUMMERS, R. Scott; KNAPPE, Detlef; SNOEYINK, Vernon. Adsorption of Organic Compounds by Activated Carbon. In: EDZWALD, James. (Ed.). Water quality and treatment: a handbook on drinking water. New York: McGraw-Hill, 2011. p. 14.1-14.105.
- TEIXEIRA, Margarida Ribau; ROSA, Maria João; SORLINI, Sabrina; BIASIBETTI, Michela; CHRISTOPHORIDIS, Christophoros; EDWARDS, Christine. Removal of Cyanobacteria and Cyanotoxins by Conventional Physical-Chemical Treatment. In: HISKIA, Anastasia; TRIANTIS, Theodoros; ANTONIOU, Maria.; KALOUDIS, Triantafyllos; DIONYSIOU, Dionysios. (Ed.). Water treatment for purification from cyanobacteria and cyanotoxins. Hoboken: John Wiley & Sons, 2020. p. 69-89.
-
THIRUMAL, Sivanuja; UDAWATTA, Nilupa; KARUNASENA, Gayani; AL-AMERI, Riyadh. Barriers to Adopting Digital Technologies to Implement Circular Economy Practices in the Construction Industry: A Systematic Literature Review. Sustainability, v. 16, n. 8, 3185, 2024. https://doi.org/10.3390/su16083185
» https://doi.org/10.3390/su16083185 - TUKEY, John Wilder. Exploratory Data Analysis Reading: Addison-Wesley, 1977.
- UNITED NATIONS – UN. Water Security and the Global Water Agenda: A UN-Water Analytical Brief. Ontario: United Nations University, 2013.
- UNITED STATES ENVIRONMENTAL PROTECTION AGENCY – EPA. Technologies and Costs Document for the Final Long Term 2 Enhanced Surface Water Treatment Rule and Final Stage 2 Disinfectants and Disinfection Byproducts Rule [S.l.]: EPA, 2005. 309 p.
-
WARZINIACK, Travis; SHAM, Chi Ho; MORGAN, Robert; FEFRHOLTZ, Yasha. Effect of Forest Cover on Water Treatment Costs. Water Economics and Policy, v. 3, n. 4, 1750006, 2017. https://doi.org/10.1142/S2382624X17500060
» https://doi.org/10.1142/S2382624X17500060 - WORLD HEALTH ORGANIZATION - WHO. Guidelines for Drinking-Water Quality: Fourth Edition Incorporating the First Addendum. 4. ed. Geneva: WHO, 2017.
-
ZHOU, Yuan; TOL, Richard Sijbren Jelle. Evaluating the Costs of Desalination and Water Transport. Water Resources Research, v. 41, n. 3, p. 1-10, 2005. https://doi.org/10.1029/2004WR003749
» https://doi.org/10.1029/2004WR003749 -
ZOUBEIK, Mohamed; ISMAIL, Mohamed; SALAMA, Amgad; HENNI, Amr. 2018. New Developments in Membrane Technologies Used in the Treatment of Produced Water: A Review. Arabian Journal for Science and Engineering, v. 43, n. 5, p. 2093-2118, 2018. https://doi.org/10.1007/s13369-017-2690-0
» https://doi.org/10.1007/s13369-017-2690-0
Edited by
-
Editor:
Jorge Manuel Guieiro Pereira Isidoro https://orcid.org/0000-0002-6901-5652


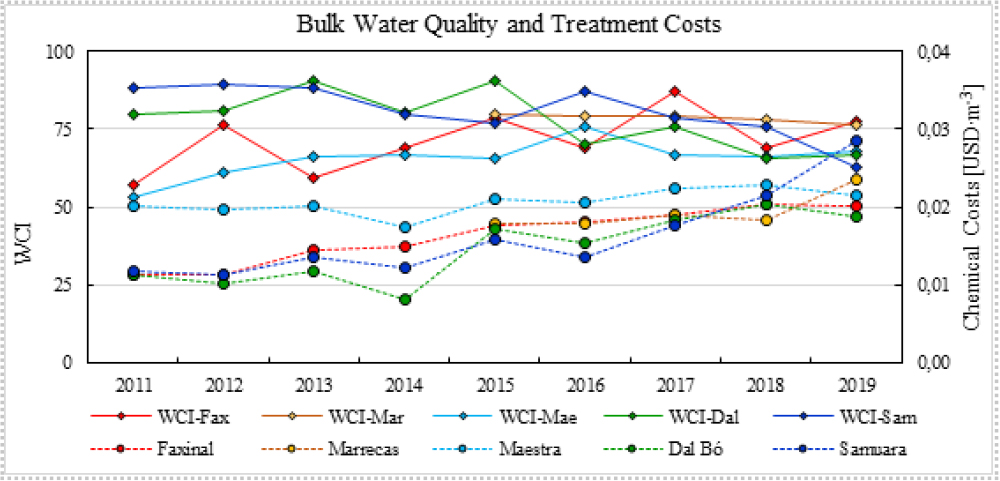 The dashed lines represent the evolution of chemical costs over the study period, whereas the continuous lines depict variations in the Water Compliance Index between January 2011 and December 2019.

 The abscissa represents plant capacity, while the ordinate shows operational and maintenance costs normalized per unit volume treated (USD∙m-3). The dataset includes applications involving reclaimed water (Recl), seawater (SeaW), brackish water (BraW), groundwater (GroW), surface water (SurfW), river water (RivW), and water softening process (Soft), as identified in the legend. The wide dispersion of data points reflects differences in membrane type, raw water characteristics, operational strategies, and regional cost structures (
 Symbol “⁕” represents the far-out value outliers. Symbol “○” corresponds to the outside value outliers (