
 Evaluation of sewage system management in a large Brazilian city following a public–private partnership
ABSTRACT
This study assesses the impact of a 2015 public–private partnership on sewage system management in a large city in Brazil’s SoutheastRregion, using 14 performance indicators from the National Sanitation Information System for 2007–2014 and 2015–2022. Interrupted Time Series models and complementary tests detected no statistically significant immediate level change at the public–private partnership initiation for ten indicators, while eight indicators improved in the post-intervention trend — most notably treated sewage volumes and urban/total service coverage rates. After adjusting for official inflation, the average sewage tariff increased by 32 percentage points in 2015–2022 compared with 25 percentage points in 2007–2014, alongside higher sector investment, indicating tariff and investment dynamics consistent with service expansion.
Keywords:
sewage system management; performance indicators; public–private partnership; sanitation legal framework; interrupted time series.
INTRODUCTION
National wastewater context
The relevance of sanitary sewage systems in preserving water bodies is evident in several ways. For decades, the literature has alluded to the relationship between deaths from diarrheal diseases and the sanitary conditions of populations in developing countries. In this context, it is estimated that contaminated water — predominantly from sewage — is the second leading cause of child deaths on the planet (Gates Foundation, 2023).
In Brazil, in 2023, approximately 59.7% of the total population was served by a sewage collection network, a percentage that rises to 67.5% in urban areas and drops dramatically to 5.6% in rural areas. Of the sewage collected volume, approximately 78.7% receives some type of treatment. These percentages were based on a sample that covered 87.4% of the urban population in 2,754 municipalities and 51.7% of the rural population (Ministério das Cidades, 2024). These statistics are partially mitigated by the small percentage of the Brazilian population served by adequate individual systems, usually septic tanks and percolating filters, mainly in less densely populated urban areas such as horizontal condominiums on the outskirts of medium and large cities.
An analysis of efforts to universalize water supply and sewage services in Brazil reveals the complexity and scope of the challenges faced in this crucial sector. Annual investments of R$ 15 billion, corresponding to about 0.20% of gross domestic product (GDP), reveal a considerable discrepancy in relation to the estimated R$ 30 billion per year needed to achieve universal access, representing approximately 0.45% of GDP. The notable presence of private participation in these services, although on the rise since 2014, has been linked to a significant drop in public investment (Rocha and Ribeiro, 2022).
However, there is no consensus on the amount to be invested to achieve these goals. Studies have pointed to a total investment of approximately R$ 753 billion between 2020 and 2033, according to an analysis by the Brazilian Association of Private Water and Sewage Service Concessionaires (ABCON; KPMG, 2020). The study also points out that, if the pace of investment and the progress in service coverage rates of recent years are maintained, universal access to water and sewage services in Brazil would only be achieved in 2055. Despite the discrepancies between estimates of the necessary resources, it is evident that the amounts required are significant, demanding a strategic and integrated approach to address the challenges of universalizing water and sewage services in the country.
Significant changes were made to the sanitation legal framework (Law 14,026/2020), considered the most significant intervention in the sector since the National Sanitation Plan (Planasa) in 1970 (Sousa, 2020) that promoted the creation of state sanitation companies. The changes were justified as necessary to modernise legislation and establish conditions for competition between companies, allowing private investors greater security for the contribution of resources aimed at serving 99 and 90% of the Brazilian population by 2033 with water supply and sewage collection and treatment, respectively. As a result of the aforementioned Legal Framework for Sanitation, it is estimated that in 881 municipalities (15.8%), water supply and/or sewage systems are operated by private companies, either exclusively or in partnership with public providers, with 11% in the form of public-private partnership (PPP), as in the object of this study (ABCON; SINDCON, 2024).
In this scenario, it is essential to understand the stages of the privatization process in order to comprehend the modalities associated with it, whether privatization, characterized by the sale of a company or state assets to the private sector, or concession, which can be defined as the temporary transfer of public service provision to the private sector (BNDES, 2016). According to the legislation, there are two types of concession: common (regulated by Law No. 8,987/1995) and PPP, which can be subdivided into sponsored and administrative (regulated by Law No. 11,079/2004) (BNDES, 2016; Brasil, 2021; Souza, Silva and Araújo, 2015). Figure 1 summarizes divestiture pathways.

According to CBIC (2016), Souza, Silva and Araújo (2015), the main differences between the two types are risk sharing and the requirement for financial compensation subsidized by the government. In Brazil, concessions are the most commonly used model to compensate for the lack of public investment in sectors that are fundamental to development, such as infrastructure, including roads, electricity generation, and sanitation. This model involves the transfer of responsibility for all services, including operation, management, expansion, and modernization, for a period ranging from 15 to 30 years, which may be renewed, while the assets remain under public ownership (Rio and Sales, 2009).
In a traditional concession, there is a temporary transfer of public services with the collection of user fees and other administrative revenues sufficient to remunerate the concessionaire. In a PPP, there is no user fee collection, or it is insufficient to remunerate the private company for providing the service, leading to some type of payment by the public agency. In this sense, there are two types of PPP concessions — administrative and sponsored. Administrative concessions do not involve charging fees, and remuneration for the service provided depends totally or partially (when other service administration revenues are present) on payment by the public agency. In sponsored concessions, on the other hand, fees are charged, but when added to other revenues from service administration, they are insufficient to remunerate the private company, requiring some form of payment by the public agency (BNDES, 2016).
The most intelligible way to conceptualize indicators is to define them as variables capable of synthesizing relevant information, commonly expressed in a number, describing the state of a phenomenon or an environment in which such information is inserted. It is interesting to note that qualitative indicators often end up converted into quantitative indicators and/or variables. Frequently, the aggregate set of various indicators — with a weight associated with each one — results in an index, such as the recently proposed Water Supply Service Quality Index (Hamdan, Libânio and Costa, 2023).
In the field of sanitation, performance indicators are used to monitor service delivery, regulation, and planning to achieve goals, and are of paramount importance to public administration, since they make it possible to evaluate and monitor the progress of actions implemented by service providers (Nirazawa and Oliveira, 2018).
In Brazil, there are still several entities that monitor and disseminate reports based on the use of indicators and indices. Noteworthy examples include the Associação Brasileira de Agências de Regulação (ABAR, Brazilian Regulatory Association), which regulates water supply and sewage services using indicators, and the Associação Brasileira de Engenharia Sanitária e Ambiental (ABES, Brazilian Association of Sanitary and Environmental Engineering), which awards the National Sanitation Quality Award to companies according to evaluation criteria based on indicators.
Performance indicators applied to the management of sewage systems must have certain characteristics (ABNT, 2012):
-
i)
explicit definition, with a concise and unambiguous interpretation;
-
ii)
assessability based on easily measurable variables and at a reasonable cost;
-
iii)
able to express the actual level of performance achieved in a given area;
-
iv)
relation to a specific time period (e.g., annual, quarterly);
-
v)
capability to allow explicit comparison with the desired objectives and to simplify analysis that would otherwise be complex; and
-
vi)
simplicity, objectivity, verifiability, ease of understanding, and avoidance of any personal or subjective interpretation.
According to Ribeiro (2011), in the context of contract oversight, the proper definition of performance indicators is crucial to encourage private initiative to provide services with the quality stipulated in the contract. These indicators are at the heart of common concession and PPP contracts and should be geared toward the end result to be achieved by the government and the user, thereby transferring decisions on inputs, materials, technology, personnel, and equipment to the private partner.
In this context, it is worth noting that the concession contract signed between the state sanitation company and the private company, that is the subject of this study, includes an annex dedicated to the definition of performance targets and indicators. According to the document, the performance index is composed of metrics that evaluate the main aspects related to the construction and operation of the sanitary sewage system in two indices: Construction Performance Indices and Operation Performance Indices. These indices impact, respectively, the fixed and variable portions of the remuneration passed on to the concessionaire by the public authority.
Given the above, the main objective of this study was to evaluate, using performance indicators, the impact of the public-private partnership on the management of the sewage system, which began in 2015, in a large city with a population of around 520,000 inhabitants in the Southeast region of Brazil. Additionally, the study proposes to:
-
i)
select the performance indicators available in the Sistema Nacional de Informações sobre Saneamento (SNIS, National Sanitation Information System) associated with the management of sanitary sewage systems;
-
ii)
statistically evaluate the behavior of the selected performance indicators before and after the implementation of the public-private partnership.
METHODOLOGY
Definition of the performance indicators
Initially, it was decided to use performance indicators exclusively applicable to sanitary sewage systems available on the website of the SNIS. Established by Law No. 11,445/2007, the SNIS has been serving as the official national database for regulating and evaluating the performance of service providers in relation to established targets. With institutional, administrative, operational, managerial, economic-financial, accounting, and quality information, the SNIS provides more than 200 pieces of information and indicators, published annually, relating to water supply, sewage, solid waste, and urban stormwater drainage and management services (Brasil, 2023).
Although it has remained self-reported, tools have been developed over time to increase the reliability of the information entered by providers included in the SNIS. The improvement in data quality is a natural part of the system’s maturation process and results from initiatives such as ACERTAR, which aims to promote the certification of system information through reliability and accuracy tests (Gama, Costa and Ferreira, 2019).
In addition, the performance indicators stipulated in the PPP contract with the state sanitation company are not publicly available and, in accordance with the contractual clauses, may be renegotiated by agreement between the parties involved.
One exception concerned annual Investment in Water Supply (FN023), included to benchmark wastewater investment levels. Apart from this exception, the following assumptions were adopted for the selection of indicators:
-
i)
exclusion of joint water supply and sewage indicators;
-
ii)
collection of indicators for the period from 2007 to 2022, aiming to obtain an equal number of records before and after the PPP started in 2015; and
-
iii)
inclusion of only one performance indicator with 15 records — seven after the PPP — with the others presenting all 16 records for the period from 2007 to 2022.
Statistical analysis
Several authors report that environmental data exhibit a non-normal distribution and positive asymmetry, which hinders the application of parametric methods (Helsel et al., 2020). Nevertheless, the normality of the data was verified using the Shapiro–Wilk test for a significance level of 5%. Based on the normality test, it was possible to define the statistical strategies to be adopted in the data analysis.
To identify trends in time series data (before and after the implementation of the PPP), robust statistical tests were applied to evaluate monotonic or linear variations over time.
For an in-depth analysis of the implementation of the PPP in 2015 in the management of the sanitary sewage system of the city under study, the Interrupted Time Series (ITS) technique was used. Considering the limited number of observations available (eight records before and after the intervention, except for indicator IN024 (Urban Sewage Service Index for Municipalities Supplied with Water), which has seven records after the intervention), caution was exercised in interpreting the results. However, the robustness of the analysis is enhanced when the data are distributed evenly in the pre- and post-intervention periods, as is the case in this study (Zhang, Anita and Ross-Degnan, 2011).
For this analysis, a segmented regression model with an autoregressive error structure was applied, which controls the temporal correlation between observations, as shown in Equation 1.
Where:
Yt: value of the dependent variable at time t;
β0: baseline level of the series at the initial time point (T = 0);
T: continuous time;
β1: expected change in the indicator associated with each additional unit of time before the intervention;
X: binary indicator variable (0 for the years before the intervention and 1 for the years after);
β2: difference in the slope of the series between the pre- and post-intervention periods, which captures the change in the indicator trend after the intervention; and et: random error term, which accounts for temporal serial correlation.
The main results obtained through the application of ITS analysis to each indicator evaluated are summarized. From the segmented regression models, the following were extracted and organized for each time series: the adjusted coefficient of determination (adjusted R2), as a measure of the model’s explanatory power; the standard error, which expresses the accuracy of the estimates; the overall significance of the model evaluated by analysis of variance (ANOVA); and the central parameters of the analysis — pre-intervention trend, immediate impact of the intervention, and post-intervention trend — all accompanied by their respective levels of statistical significance (Ewusie et al., 2020). In addition, graphs demonstrating the temporal behavior of each indicator are also presented.
The information is presented in an integrative and comparative view of the indicators in relation to the intervention event — the start of the PPP. This approach facilitates the identification of indicators showing statistically significant level shifts and/or trend changes after the intervention. This approach contributes to clarity and rigor in the interpretation of results, strengthening the discussion on the practical impacts of the PPP in the analyzed context and facilitating the understanding of the main findings by the scientific community.
In addition, for cases in which no significant trend was observed in the ITS analysis, comparative statistical tests were performed between the pre- and postintervention periods. These tests were not applied to all indicators, since, in the presence of statistically significant temporal trends, there is evidence of residual autocorrelation in the data, a situation in which the application of paired t-tests (for parametric data) and Wilcoxon tests (for non-parametric data) can lead to invalid conclusions, as pointed out by Ewusie et al. (2020) and Linden (2015). The selection of the statistical comparison test was defined based on the normality test (Hair et al., 2009; Levine et al., 2008). The statistical tests were conducted at a significance level of 5% and implemented using the Action add-in and the Excel Data Analysis tool.
RESULTS AND DISCUSSION
Selected performance indicators
Based on the assumptions outlined in the Methods Section, 14 performance indicators were selected from the SNIS database, listed in Table 1, of which 13 have 16 records (one for each year from 2007 to 2022).
Some performance indicators were discarded due to uncertainty in the records or because they did not cover the entire period under evaluation (2007–2022). Among these, the indicators related to electricity consumption and overflows in the collection networks stand out. It should also be noted that there are no indicators listed in the SNIS referring to the efficiency of wastewater treatment plants in terms of the removal of biochemical oxygen demand (BOD), chemical oxygen demand (COD), total suspended solids, or nutrients.
Descriptive statistics
Table 2 presents the descriptive statistics for the 14 performance indicators listed in Table 1 for the periods before (2007–2014) and after (2015–2022) the implementation of the PPP.
Descriptive statistics for the 14 performance indicators for sanitary sewage system management before and after the PPP.
For financial indicators, it is important to note that between 2007 and 2022, the average and cumulative official inflation rates were 5.72 and 171.52%, respectively, as measured by the Índice Nacional de Preços ao Consumidor Amplo (IPCA, Broad Consumer Price Index).
Beyond the descriptive statistics presented in Table 2 and considering the cumulative inflation in the period prior to (55.25%) and after (74.90%) the PPP, the analysis of the two main financial indicators — Average Sewage Tariff (IN006) and Investment in Sanitary Sewage Systems (FN024) — allows for some observations.
Initially, in relation to the first indicator (IN006), in the period prior to the PPP, the rate increase (R$ 2.34.m-3 in 2014) was around 25 percentage points (or 45%) above inflation for the period. After the PPP, the tariff (R$ 4.83.m-3 in 2022) rose approximately 32 percentage points (or 42%) above inflation. In short, in 16 years, the sewage tariff increased by approximately 100 percentage points (or 58%) above the official inflation rate for the period.
Similarly, comparing investment in 2007 and 2022, in relation to indicator FN024, investment in the sewage system rose by 628%, a result that is 456 percentage points above inflation. Before the implementation of the PPP, from 2007 to 2014, investments increased by approximately 86%, resulting in a real increase of around 55% above inflation. In the period 2015–2022, investments grew by 165%, which corresponds to an increase of 120% above official inflation.
It is also worth noting the third indicator, Number of Active Sewage Connections (ES002), which is related to financial indicators. In the period 2007– 2022, the city’s population increased by approximately 24%. In contrast, in the same period, indicator ES002 increased by 173%, reaching 89,463 active connections in 2022. In the period prior to the PPP, indicator ES002 rose by 44%. After the implementation of the PPP, the ES002 indicator rose by 90%, a percentage practically identical to that observed considering inactive sewage connections.
Statistical analysis
Interrupted time series
Initially, the ITS technique, summarized in Table 3, was applied to the annual results of the 14 performance indicators in the period studied.
The comparison test is appropriate for cases where no correlation is observed, either pre- or post-intervention. Therefore, it can be applied to indicators IN021 (Extension of the Sewer Network per Connection) and FN023 (Investment in Water Supply). For other cases, as there is a significant trend before and/or after the intervention, comparison tests are not recommended.
In the case of FN023, the data are normally distributed, indicating the use of the paired t-test. Comparing the pre- and post-intervention periods, a p-value of 0.0011 was found. As this value is lower than 0.05, there is a statistically significant difference between the values before and after the implementation of the PPP.
In the case of IN021, the data show a non-normal distribution, indicating the use of the Wilcoxon test. Comparing the pre- and post-intervention periods, a p-value of 0.1953 was found. As this value is higher than 0.05, there is no statistically significant difference between the values before and after the implementation of the PPP.
Given the limited sample size (8 pre, 8 post; 7 post for IN024), estimates should be interpreted with caution. However, the robustness of the analysis is enhanced when the data are distributed evenly in the pre- and post-intervention periods, as is the case in this study (Zhang, Anita and Ross-Degnan, 2011).
Performance indicators
To optimize the analysis, performance indicators with some correlation were evaluated in pairs before and after the implementation of the PPP, as detailed bellow:
i) Volume of Collected Sewage (ES005) and Volume of Treated Sewage (ES006)
As shown in Table 2, both indicators present high adjusted coefficients of determination, suggesting that more than 92% of the variation in the indicators is explained by the variables included in the models. The indicator ES005 presented a standard error of the residuals (512.95) that indicates moderate variability in the estimates. The analysis of variance confirms the overall significance of the model, presenting a high F value (17.08) and p < 0.001, which reinforces the relevance of the independent variables in explaining the changes in this indicator.
Regarding indicator ES006, the standard error of the residuals is relatively high (869.93), reflecting greater variability in the observations compared to indicator ES005. The analysis of variance revealed that the model is statistically significant, with an F value of 15.16 and p < 0.001, indicating that the independent variables contribute significantly to explaining the variations in this indicator.
Figure 2 shows the temporal variation of performance indicators ES005 and ES006 in the period studied.

Temporal evolution of performance indicators ES005 (Volume of Collected Sewage – 1,000 m3.year-1) and ES006 (Volume of Treated Sewage – 1,000 m3.year-1) throughout the study period.
Still in relation to the ES005 indicator, the analysis of the residuals showed a balanced distribution, with no evident systematic patterns, which reinforces the reliability of the adjusted model. In summary, the analysis indicates that ES005 indicator showed a significant upward trend before the PPP, and that this trend increased even more in the period after the PPP, with no abrupt change in the indicator level at the time of intervention.
Also for indicator ES006, the analysis of the residuals did not show any obvious systematic patterns, although there is a certain greater variability at some points, consistent with the standard error presented. Figure 2 shows a substantial change in the trend after the implementation of the PPP, without any immediate abrupt impact on the indicator level at the time of the intervention.
ii) Extension of the Sewer Network (ES004) and Extension of the Sewer Network per Connection (IN021)
The ES004 indicator, Extension of the Sewer Network, showed a high adjusted coefficient of determination (0.99). The standard error of the residuals (29.31) indicates moderate variability in the estimates. Once again, the analysis of variance confirmed that the model is significant, with a high F value (367.34) and p < 0.001, which reinforces the overall relevance of the independent variables in explaining the temporal variations of the indicator.
As for indicator IN021, the regression results indicate a poor fit of the model to the data, evidenced by the low adjusted coefficient of determination (0.099). The standard error of the residuals was 0.75, indicating moderate variability in the estimates. The analysis of variance did not demonstrate statistical significance of the overall model, presenting a low F value (1.55) and a high p-value (0.253), indicating that the independent variables do not significantly explain the variations in the indicator over time.
Figure 3 shows the temporal variation of the two performance indicators in the period studied.

Temporal evolution of performance indicators ES004 (Extension of the Sewer Network – km) and IN021 (Extension of the Sewer Network per Connection – m.connection-1) throughout the study period.
The model reveals that indicator ES004 showed a significant upward trend before the intervention and that this trend intensified in the post-intervention period, with no clear evidence of immediate change in the indicator level with the implementation of the PPP.
For indicator IN021, the model did not provide robust statistical evidence to confirm whether there were significant changes in the trend or level associated with the implementation of the PPP. It is possible that other factors not captured by the model may be influencing the behavior of the indicator.
iii) Investment in Sanitary Sewage Systems (FN024) and Investment in Water Supply (FN023)
The regression model for indicator FN024 showed reasonable adjustment to the data, with an adjusted coefficient of determination of 0.74. The standard error of the residuals was high (10,877,904.01), suggesting considerable unexplained variability. The analysis of variance confirmed the overall significance of the model (F = 15.21; p < 0.001), showing that at least one of the independent variables contributes to explaining the temporal variation of the indicator.
The regression model for indicator FN023 showed only moderate adjustment to the data, evidenced by the adjusted coefficient of determination of 0.33. The standard error of the residuals was high (15,199,253.73), suggesting high unexplained variability and low precision in the estimates. The analysis of variance revealed that the model as a whole did not achieve robust statistical significance (F = 3.45; p = 0.052), falling within the traditional level of significance (5%), suggesting that the independent variables may not be sufficient to explain the variations observed in indicator FN023 over time.
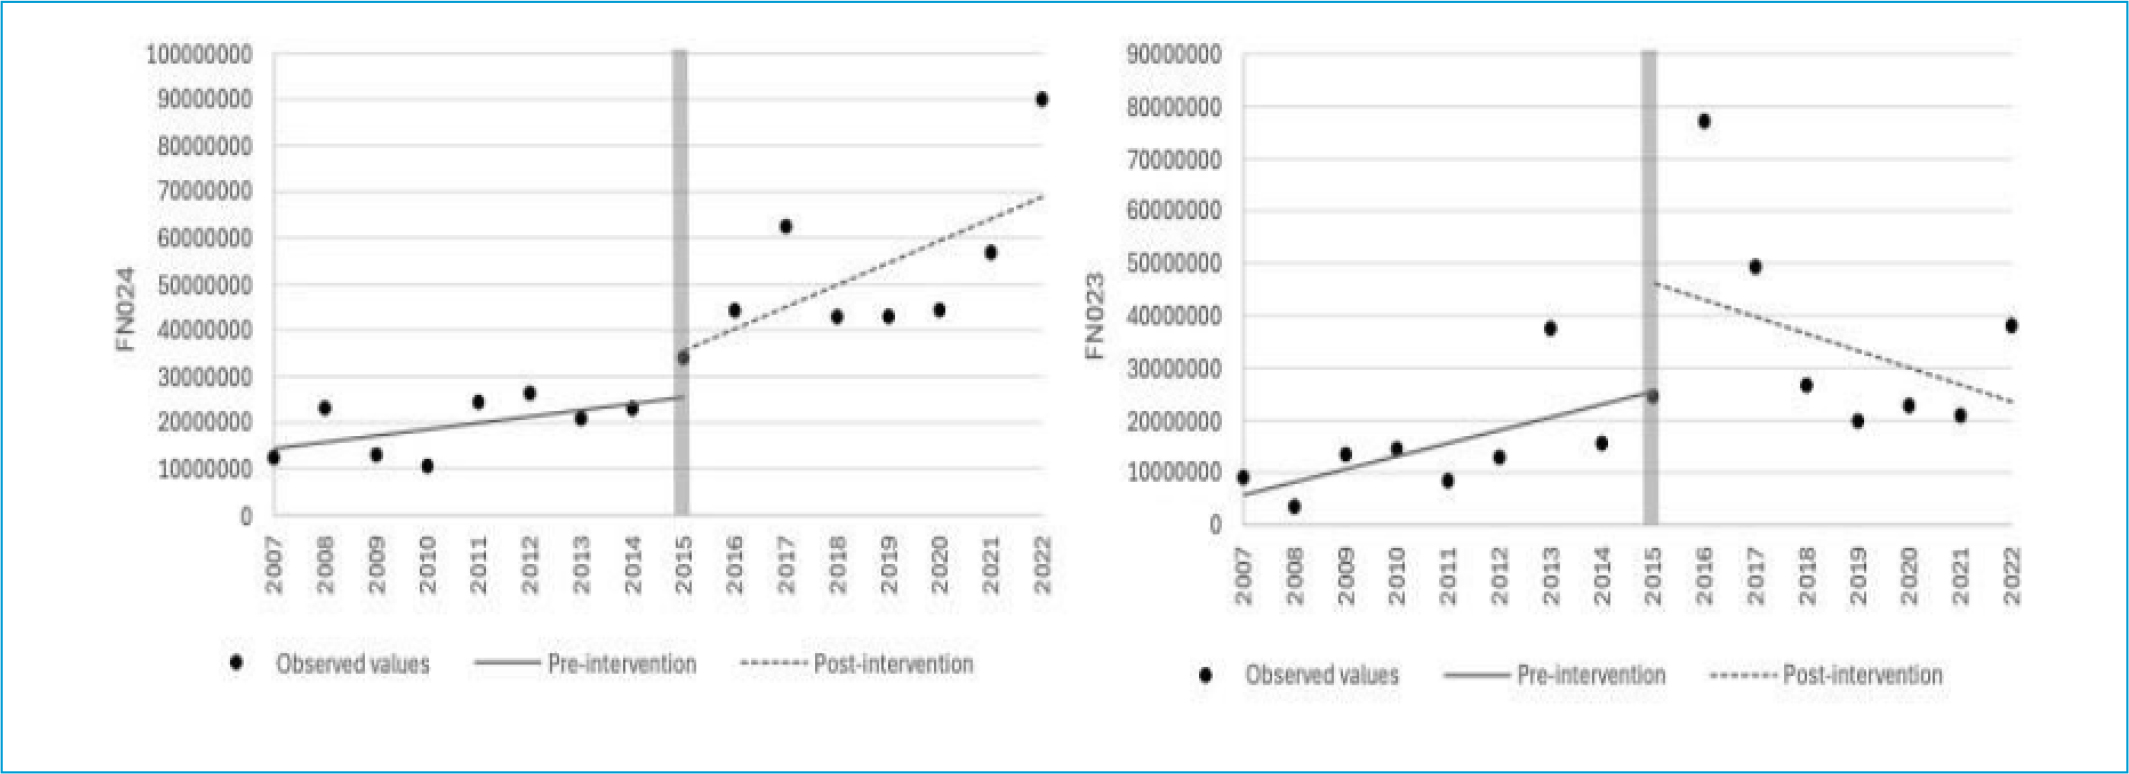
Figure 4 shows the temporal variation of performance indicators FN024 and FN023 in the period studied.

Temporal evolution of performance indicators FN024 (Investment in Sanitary Sewage Systems – R$.year-1) and FN023 (Investment in Water Supply – R$.year-1) throughout the study period.
For indicator FN024, the analysis of the residuals showed some dispersion and, despite the adjustment explained by the coefficient of determination, the absence of statistical significance in the coefficients suggests that there were no clear and robust changes associated with the intervention. The adjusted model for indicator FN024 found no statistically significant evidence of a trend or immediate effect of the intervention. Caution is recommended in the interpretation, as other factors may be influencing the behavior of the indicator or there may be limitations in the statistical power of the study.
The analysis of the residuals for indicator FN023 revealed high variability and the absence of a systematic pattern, which, combined with the low explanatory power of the model, suggests that other factors not included may influence the behavior of the indicator. The adjusted model did not identify statistically significant trends or a relevant immediate impact of the implementation of PPP on indicator FN023. However, as previously mentioned, the comparison test between the pre- and post-intervention periods indicates that there is a statistically significant difference between the periods before and after the implementation of PPP, with a higher mean value observed in FN023 in the post-PPP period.
iv) Urban Sewage Service Index for Municipalities Supplied with Water (IN024) and Total Sewage Service Coverage Index for Municipalities Supplied with Water (IN056)
The regression results indicated excellent model fit to the data for both indicators, evidenced by high adjusted coefficients of determination (> 0.945). For indicator IN024, the standard error of the residuals was 2.57, indicating good accuracy in the estimates. The analysis of variance showed that the model is statistically significant, with a high F value (12.44) and p < 0.001, which reinforces the relevance of the independent variables in explaining the variations in the indicator over the period studied.
Similarly, for indicator IN056, the standard error of the residuals was 2.57, indicating good accuracy in the estimates. The analysis of variance showed that the model is statistically significant, with a high F value (12.44) and p < 0.001, which points to the relevance of the independent variables in explaining the variations in the indicator over time.
Figure 5 shows the temporal variation of performance indicators IN024 and IN056 in the period studied.

Temporal evolution of performance indicators IN024 (Urban Sewage Service Index for Municipalities Supplied with Water – %) and IN056 (Total Sewage Service Coverage Index for Municipalities Supplied with Water – %) over the study period.
For both indicators, the analysis of the residuals revealed a relatively balanced distribution with no obvious systematic patterns, which reinforces the suitability of the models for describing the temporal behavior of the indicator. The models indicate that the two indicators did not show a clear pre-intervention trend, but underwent a significant change in level (or trend) at the time of intervention, followed by a significant positive upward trend in the period after the implementation of the PPP.
v) Number of Active Sewage Connections (ES002) and Average Sewage Tariff (IN006)
Again, both indicators showed excellent model fit to the data with high adjusted coefficients of determination (> 0.968). For indicator ES002, the standard error of the residuals (2,126.63) indicates moderate variability in the estimates. The analysis of variance showed that the model is significant, with a very high F value (394.04) and p < 0.001, confirming that the independent variables included in the model are relevant to explaining the temporal variations of the indicator.
For indicator IN006, the standard error of the residuals was small (0.198), indicating accuracy in the estimates. The analysis of variance also confirmed the overall significance of the model, presenting a very high F value (150.90) with p < 0.001, which demonstrates the relevance of the independent variables in explaining the variations in the indicator.
Figure 6 shows the temporal variation of performance indicators ES002 and IN006 during the period studied.
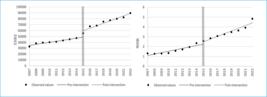
Temporal evolution of performance indicators ES002 (Number of Active Sewer Connections – connection) and IN006 (Average Sewage Tariff – R$.m-3) over the study period.
Once again, for both indicators, the analysis of the residuals revealed a relatively balanced distribution with no obvious systematic patterns, which reinforces the suitability of the models for describing the temporal behavior of the indicators.
Indicator ES002 showed a considerable upward trend before the implementation of the PPP, with a significant immediate increase at the time of the intervention and an additional acceleration in the upward trend in the postintervention period, as shown in Figure 6.
For indicator IN006, the situation is almost identical. There was an upward trend before the intervention, and this trend intensified after the intervention. However, there was no immediate jump in the indicator level at the time of the intervention.
vi) Sewage Treatment Index (IN016) and Treated Sewage Index relative to Water Consumed (IN046)
For indicator IN016, Treated Sewage Index, a moderate fit of the model to the data was found, evidenced by an adjusted coefficient of determination of 0.607. The standard error of the residuals was 6.38, showing moderate variability in the estimates. The analysis of variance revealed that the model is statistically significant, with an F value of 8.72 and p = 0.0024, confirming that, despite the moderate fit, the independent variables considered are relevant to explaining the temporal variation of the indicator.
The regression results indicated a good fit of the model to the data for indicator IN046 (Treated Sewage Index relative to Water Consumed), evidenced by the adjusted coefficient of determination of 0.910. The standard error of the residuals was 2.93, revealing moderate variability in the estimates. The analysis of variance showed that the model is statistically significant, with an F value of 14.04 and p < 0.001, confirming the overall relevance of the independent variables in explaining the temporal variations of the indicator.
Figure 7 shows the temporal variation of performance indicators IN016 and IN046 in the period studied.
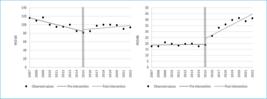
Temporal e volution of performance indicators IN016 (Sewage Treatment Index – %) and IN046 (Treated Sewage Index Relative to Water Consumption – %) over the study period.
or both indicators, the analysis of residuals did not show any obvious systematic patterns, with residuals distributed in a relatively balanced manner, which reinforces the adequacy of the models. Indicator IN016 showed a significant downward trend before the intervention, which reversed to a significant upward trend in the post-intervention period, without any rapid change in the indicator level at the exact moment of PPP implementation.
The IN046 indicator showed stability and no significant trend before the intervention but underwent a positive and significant change in its trend after the intervention, again without any immediate impact on its level at the point of interruption.
vii) Share of Sewage Operating Revenue in Total Operating Revenue (IN041) and Total Number of Sewage Connections (Active + Inactive) to the Sewer System (ES009)
Finally, once again, both indicators showed excellent model fit to the data with high adjusted coefficients of determination (> 0.968). Indicator IN041 showed a low standard error of the residuals (1.36), indicating good accuracy in the estimates. The analysis of variance showed that the model is statistically significant, with a very high F value (27.51) and p < 0.001, confirming the overall relevance of the independent variables in explaining the variations in the indicator.
Regarding indicator ES009, Total Number of Sewage Connections (Active + Inactive) to the Sewer System, the standard error of the residuals (3,465.58) indicates moderate variability in the estimates. The analysis of variance showed that the model is significant, with a very high F value (1108.93) and p < 0.001, confirming the robustness of the independent variables in explaining the variations in the indicator.
Figure 8 shows the temporal variation of performance indicators IN041 and ES009 in the period studied.

Temporal evolution of performance indicators IN041 (Share of Sewage Operating Revenue in Total Operating Revenue – %) and ES009 (Total Number of Sewage Connections [Active + Inactive] to the Sewer System – connection) over the study period.
For indicator IN041, the residuals appear to be evenly distributed, with no clear indications of systematic bias, reinforcing the validity of the adjusted model. As for indicator ES009, the analysis of the residuals did not reveal any systematic patterns, despite the presence of some occasional variations, which reinforces the overall adequacy of the model.
The model indicates consistent growth of indicator IN041 over time, with an immediate positive and significant impact at the time of intervention, but no significant change in the trend after PPP implementation. With some similarity, indicator ES009 showed a significant upward trend before the intervention, with no clear evidence of immediate change in the level or trend of the indicator after PPP.
CONCLUSIONS
Based on the analysis of 14 performance indicators, before (2007–2014) and after (2014–2022) the implementation of the PPP in the management of the sewage system, the following conclusions can be drawn:
-
i)
Initially, it should be emphasized that the research findings should be analyzed with caution due to the low number (16) of records for almost all of the performance indicators evaluated. Subsequent years of operation may allow for a more accurate assessment of the impact of the PPP on sewage system management;
-
ii)
The results indicate that there was no deterioration in the quality of sewage services provided in the city evaluated after the implementation of the PPP;
-
iii)
Adjusted for official inflation, there was a greater real increase in the average sewage tariff before the implementation of the PPP (45%) compared to the increase that occurred in the subsequent period (42%). However, without considering inflation, the increase in the tariff was more pronounced in the period after the PPP (106% increase). This assertion is corroborated by indicator IN006, which showed an upward trend before the PPP, a trend that intensified after the intervention;
-
iv)
There was an increase in the number of active sewage connections that exceeded the increase in the city’s population. This increase was more than double after the implementation of the PPP compared to the previous period;
-
v)
Despite the real increase in the tariff, no evidence of a statistically significant increase was found in investments in the sewage system after the implementation of the PPP. However, the real increase in investments — discounting inflation — was more than twice as high after the implementation of the PPP compared to the previous period;
-
vi)
For ten of the 14 selected performance indicators, there was no abrupt change immediately after the implementation of the PPP. Such a change seems to have manifested itself for the four indicators related to service rates, the number of connections, and the share of sewage operating revenue in total revenue; and
-
vii)
Finally, for eight performance indicators, there was a positive change after the implementation of the PPP. Of these, four indicators stand out, linked to the percentages of treated sewage volume and related to water consumption, and to urban and total sewage service rates.
DATA AVAILABILITY STATEMENT
The datasets generated and/or analyzed during the current study are available from the corresponding author upon request.
Funding:
REFERENCES
- ASSOCIAÇÃO BRASILEIRA DE NORMAS TÉCNICAS - ABNT. NBR 24511: Atividades relacionadas aos serviços de água potável e esgoto – Diretrizes para a gestão dos prestadores de serviços de esgoto para a avaliação dos serviços de esgoto. Rio de Janeiro: ABNT, 2012.
-
ASSOCIAÇÃO DAS CONCESSIONÁRIAS PRIVADAS DE SERVIÇOS PÚBLICOS DE ÁGUA E ESGOTO – ABCON; KPMG. Quanto custa universalizar o saneamento no Brasil? São Paulo: KPMG, 2020. Available at: https://assets.kpmg.com/content/dam/kpmg/br/pdf/2020/07/kpmg-quanto-custa-universalizar-o-saneamento-no-brasil.pdf Accessed in: May 01, 2023.
» https://assets.kpmg.com/content/dam/kpmg/br/pdf/2020/07/kpmg-quanto-custa-universalizar-o-saneamento-no-brasil.pdf - ASSOCIAÇÃO DAS CONCESSIONÁRIAS PRIVADAS DE SERVIÇOS PÚBLICOS DE ÁGUA E ESGOTO - ABCON; SINDICATO DAS CONCESSIONÁRIAS PRIVADAS DE SERVIÇOS PÚBLICOS DE ÁGUA E ESGOTO - SINDCON. Panorama da participação privada no saneamento: Saneamento se destaca no futuro da infraestrutura. São Paulo: ABCON, SINDCON, 2024. 145 p.
-
BANCO NACIONAL DE DESENVOLVIMENTO - BNDES. As etapas do processo de desestatização: Infográfico. Banco Nacional de Desenvolvimento, 2016. Available at: https://www.bndes.gov.br/wps/portal/site/home/conhecimento/noticias/noticia/infografico-etapas-desestatizacao Accessed in: Aug. 21, 2025.
» https://www.bndes.gov.br/wps/portal/site/home/conhecimento/noticias/noticia/infografico-etapas-desestatizacao - BRASIL. Agência Nacional de Águas e Saneamento Básico. Cartilha para atendimento ao Decreto nº 10.710/2021, que estabelece metodologias para comprovação da capacidade econômico-financeira dos prestadores de serviços públicos de abastecimento de água potável e/ou de esgotamento sanitário. Brasília: ANA, 2021. 124 p.
-
BRASIL. Ministério da Integração e do Desenvolvimento Regional. Sistema Nacional de Informações Sobre Saneamento. Painel de informações sobre saneamento. Gov.br, 2023. Available at: https://www.gov.br/mdr/pt-br/assuntos/saneamento/snis/painel Accessed in: Nov. 27, 2024.
» https://www.gov.br/mdr/pt-br/assuntos/saneamento/snis/painel - CÂMARA BRASILEIRA DA INDÚSTRIA DA CONSTRUÇÃO – CBIC. PPPs e Concessões - Guia sobre Aspectos Jurídicos e Regulatórios. Brasília: CBIC, 2016.
-
EWUSIE, Joycelyne; SOOBIAH, Charlene; BLONDAL, Erik; BEYENE, Joseph; THABANE, Lehana; HAMID, Jemila. Methods, applications and challenges in the analysis of interrupted time series data: a scoping review. Journal of Multidisciplinary Healthcare, v. 13 p. 411-423, 2020. https://doi.org/10.2147/JMDH.S241085
» https://doi.org/10.2147/JMDH.S241085 -
GAMA, Jessica Rocha; COSTA, Samuel Alves Barbi; FERREIRA, Rita Cavaleiro de. Metodologia Acertar: Uma abordagem crível para melhorar a confiança das informações e indicadores de desempenho do setor de saneamento no Brasil. In: ASSOCIAÇÃO BRASILEIRA DE AGÊNCIAS REGULAÇÃO - ABAR. Coletânea Regulação Saneamento Básico. Brasília: ABARA, 2019. p. 64-80. Available at: http://www.acertarbrasil.com/wp-content/uploads/2019/08/Coleta%CC%82nea-Regulac%CC%A7a%CC%83o-do-Saneamento-Ba%CC%81sico-2019.pdf Accessed in: Aug. 27, 2025.
» http://www.acertarbrasil.com/wp-content/uploads/2019/08/Coleta%CC%82nea-Regulac%CC%A7a%CC%83o-do-Saneamento-Ba%CC%81sico-2019.pdf -
GATES FOUNDATION. Water, Sanitation & Hygiene. Gates Foundation, 2023. Available at: https://www.gatesfoundation.org/our-work/programs/global-growth-and-opportunity/water-sanitation-and-hygiene Accessed in: Nov. 30, 2024.
» https://www.gatesfoundation.org/our-work/programs/global-growth-and-opportunity/water-sanitation-and-hygiene - HAIR, Joseph; ANDERSON, Rolph; TATHAM, Ronald; BLACK, William. Análise multivariada de dados. 6. ed. Porto Alegre: Bookman, 2009. 688 p.
-
HAMDAN, Otávio Henrique Campos; LIBÂNIO, Marcelo; COSTA, Veber Afonso Figueiredo. Proposal of a regulatory index of quality of water supply services – RIQS. Environmental Science and Pollution Research, v. 18, p. 93564-93581, 2023. https://doi.org/10.1007/s11356-023-28880-4
» https://doi.org/10.1007/s11356-023-28880-4 - HELSEL, Dennis; HIRSCH, Robert; RYBERQ, Karen; ARCHFIELD, Stacey; GILROY, Edward. Tests for normality. In: Statistical methods in water resources. USA: U.S. Geological Survey, 2020. p. 107-111. (Techniques and Methods, book 4, chap. A3).
- LEVINE, David; STEPHAN, David; KREHBIEL, Timothy; BERENSON, Mark. Estatística: teoria e aplicações. 5. ed. Rio de Janeiro: LTC, 2008. 752 p.
-
LINDEN, ARIEL. Conducting interrupted time-series analysis for single and multiple-group comparisons. The Stata Journal: Promoting Communications on Statistics and Stata, v. 15, n. 2, p. 480-500, 2015. https://doi.org/10.1177/1536867X1501500208
» https://doi.org/10.1177/1536867X1501500208 - MINISTÉRIO DAS CIDADES. Sistema Nacional de Informações sobre Saneamento - SNIS. Diagnóstico Temático dos Serviços de Água e Esgotos - 2022. Brasília: SINIS, 2023.
- NIRAZAWA, Alyni Nomoto; OLIVEIRA, Sonia Valle Walter Borges de. Indicadores de saneamento: uma análise de variáveis para elaboração de indicadores municipais. Revista de Administração Pública, v. 52, n. 4, p. 753-763, 2018.
- RIBEIRO, Mauricio Portugal. Concessões e PPPs: melhores práticas em licitações e contratos. São Paulo: Editora Atlas, 2011. 232 p.
- ROCHA, Igor Lopes; RIBEIRO, Rafael Saulo Marques. Infraestrutura no Brasil: Contexto histórico e principais desafios. In: SILVA, Mauro Santos (Org.). Concessões e Parcerias Público-Privadas: Políticas Públicas para Provisão de Infraestrutura. Brasília: Instituto de Pesquisa Econômica Aplicada (IPEA), 2022. p. 23-43.
-
RIO, Gisela Aquino Pires do; SALES, Alba Valéria de Souza. Os Serviços de água e esgoto no estado do Rio de Janeiro: Regulação e privatização. GEOgraphia, v. 6, n. 12, p. 67-86, 2009. https://doi.org/10.22409/GEOgraphia2004.v6i12.a13480
» https://doi.org/10.22409/GEOgraphia2004.v6i12.a13480 - SOUSA, Ana Cristina Augusto de. O que esperar do novo marco do saneamento? Cadernos de Saúde Pública, v. 36, n. 12, e00224020, 2020.
- SOUZA, Ezequias Ferreira de; SILVA, Wendel Alex Castro; ARAÚJO, Elisson Alberto Tavares. Identificação das variáveis determinantes da eficácia de uma concessão pública, segundo a percepção de seus usuários. Revista de Gestão, v. 22, n. 3, p. 315-336, 2015.
-
ZHANG, Fang; WAGNER, Anita; ROSS-DEGNAN, Dennis. Simulation-based power calculation for designing interrupted time series analyses of health policy interventions. Journal of Clinical Epidemiology, v. 64, n. 11, p. 12521261, 2011. https://doi.org/10.1016/j.jclinepi.2011.02.007
» https://doi.org/10.1016/j.jclinepi.2011.02.007


 Source: Authors, 2026.
 Source: Authors, 2026.
 Source: Authors, 2026.
 Source: Authors, 2026.
 Source: Authors, 2026.
 Source: Authors, 2026.
 Source: Authors, 2026.