Extreme precipitation events in the state of São Paulo, Brazil: Spatiotemporal patterns and associated atmospheric mechanisms
ABSTRACT
Extreme precipitation events (EPEs) are major drivers of natural disasters, often resulting in economic and social losses, infrastructure damage, and fatalities. In this context, advancing the understanding of their spatial behavior, frequency, and underlying atmospheric mechanisms is essential for improving preparedness and disaster risk reduction. This study examined EPEs across the state of São Paulo, the most populous region in Brazil, using daily rainfall data from 21 pluviometric stations for the period 1970–2022. Extreme events were defined using the 99th percentile (P99) threshold for each station. Results revealed a marked spatial contrast: the highest P99 values occurred in the northern and northwestern regions of the state, whereas the lowest thresholds were observed in the southern sector. On the other side, the frequency of days exceeding P99 showed the opposite pattern, with more EPEs recorded in southern São Paulo than in the north. Based on the days that exceeded P99, the atmospheric systems associated with EPEs were classified for the 1996–2022 period. Cold fronts accounted for 46% of the events, followed by the South Atlantic Convergence Zone (SACZ) at 28% and convective mesoscale systems at 26%. These findings highlight the distinct spatial and synoptic controls on extreme rainfall across São Paulo and underscore the need for region-specific monitoring and early warning strategies.
Keywords:
rainfall; extreme precipitation events; atmospheric mechanisms; warnings; decision-makers
INTRODUCTION
Extreme precipitation events (EPEs) remain one of the leading causes of environmental and socioeconomic losses worldwide. Modern societies increasingly face complex challenges associated with these events, including infrastructure damage, transportation disruptions, impacts on tourism, landslides, waterborne diseases, and fatalities. Such consequences impose economic and social costs, becoming a persistent challenge for authorities and public managers, including in Brazil. According to the Center for Studies and Research in Engineering and Civil Defense (CEPED/UFSC, 2013), most disaster records in Brazil are directly related to EPEs. Over the centuries, human action has further aggravated these impacts: unplanned urban growth, deforestation, land-use change for agricultural and industrial expansion, and pollution emissions directly affect hydrological systems and water resources (Farias Júnior; Botelho, 2011). Goerl et al. (2017) highlight the intrinsic relationship between population growth and the increasing frequency of natural disasters, emphasizing that rapid urbanization without adequate planning amplifies exposure and vulnerability to intense rainfall.
In addition to anthropogenic pressures, the state of São Paulo exhibits geographical and meteorological conditions that favor the formation of EPEs. Marengo et al. (2020) identifies southeastern Brazil (SEB) as one of the regions most vulnerable to extreme weather phenomena, such as heavy rainfall and flooding, due to the combined influence of tropical and extratropical systems. Rolim et al. (2007) attribute the spatial variability of precipitation in São Paulo to its complex topography, latitudinal position, and the interaction of distinct air masses. Between 2000 and 2008, the State Civil Defense Coordination (CEDEC) reported 944 flood-related incidents across São Paulo, almost 40% of which occurred in the Alto Tietê basin — encompassing much of the São Paulo Metropolitan Area (RMSP). These records illustrate how topographic contrasts and high urban impermeability contribute to severe hydrological responses. The economic repercussions are also significant: floods resulting from extreme rainfall in the RMSP are estimated to cause annual losses exceeding R$ 762 million (Haddad; Teixeira, 2015). Understanding the spatial and temporal behavior of these events, as well as the large-scale atmospheric mechanisms that favor their development, is therefore essential for risk mitigation and long-term urban planning.
Several studies have examined the climatology of rainfall extremes in São Paulo and southeastern Brazil using different methodological frameworks (Dufek; Ambrizzi, 2008; Sugahara et al., 2009; Marengo et al., 2013; 2020; Carvalho et al., 2014; Obregón et al., 2014; Zilli et al., 2017; Ballarin et al., 2022; Cortez et al., 2022). These works have demonstrated pronounced spatial heterogeneity and temporal variability of precipitation extremes, applying techniques such as nonstationary frequency analysis, extreme value theory, and percentile-based indices. For instance, Dufek and Ambrizzi (2008) and Sugahara et al. (2009) investigated variability and non-stationarity in São Paulo's rainfall series, while Marengo et al. (2013; 2020) and Obregón et al. (2014) documented trends toward intensification of extreme precipitation and associated hydrometeorological disasters in the RMSP. More recent studies, such as Zilli et al. (2017), Ballarin et al. (2022), and Cortez et al. (2022), have reported increasing trends in the frequency and magnitude of rainfall extremes in southeastern Brazil, emphasizing the role of non-stationarity and climate change in shaping precipitation behavior. Carvalho et al. (2014) further identified significant long-term changes in annual maximum daily rainfall across southern and southeastern regions.
Within this context, percentile-based indices have become a standard methodology for assessing extreme precipitation, consistent with the recommendations of the Expert Team on Climate Change Detection and Indices (ETCCDI) (Zhang et al., 2011) and the methodological refinements proposed by Schär et al. (2016). This statistical approach enables the identification of rare events while allowing intercomparison across different climatic regimes and temporal scales. It provides a robust framework for detecting changes in the frequency and intensity of heavy precipitation, which are critical for understanding regional climate variability and assessing hydrometeorological risks. However, despite advances in statistical and trend-based analyses, few studies have combined these quantitative approaches with a systematic examination of the meteorological mechanisms underlying extreme precipitation. Understanding how atmospheric mechanisms trigger rainfall extremes in São Paulo remains a critical need for improving operational procedures and anticipatory actions undertaken by Civil Defense agencies. Establishing a clear link between the statistical frequency of EPEs and their atmospheric drivers is essential to elucidate their physical nature and enhance predictive capabilities in highly urbanized environments.
Therefore, the main objective of this study is to perform a spatiotemporal analysis of EPEs in the state of São Paulo between 1970 and 2022 and to identify the meteorological systems associated with their occurrence. Specifically, we calculate percentile-based precipitation thresholds for each rainfall station, analyze annual and seasonal variability in EPE frequency and intensity, and classify events based on the dominant atmospheric drivers in each case. This integrated statistical–synoptic approach offers a physically consistent interpretation of how large-scale and local processes interact to produce extreme rainfall, contributing to a more comprehensive understanding of EPE dynamics in southeastern Brazil and supporting improved strategies for disaster prevention and urban risk management.
Extreme rainfall events
The concept of extreme events has been widely discussed in scientific literature, reflecting its multidisciplinary relevance and the diversity of approaches used to define it. From a mathematical and climatological perspective, extreme events are significant deviations from the mean or typical state of a given system, with observed values differing from the climatological average (Sarewitz; Pielke Jr., 2001; Seneviratne et al., 2021; Silva et al., 2022). In the context of precipitation, this deviation is characterized by infrequent rainfall events that can have profound hydrological and societal impacts. Another perspective, frequently employed in disaster research and climate-risk management, defines EPEs based on their impacts rather than on their purely meteorological magnitude. In such cases, rainfall is considered extreme when it causes socioeconomic or environmental losses, regardless of its statistical rarity. McPhillips et al. (2018) found that 23% of 244 scientific papers analyzed used socioeconomic consequences as the primary criterion for defining extreme events. The World Meteorological Organization (WMO, 2017) also highlights that EPEs often cause floods, landslides, agricultural losses, and fatalities, emphasizing their growing relevance for sustainable development and climate adaptation planning.
From a quantitative perspective, however, the most objective approach is the use of statistical or index-based definitions, which enable consistent identification and comparison of extremes across regions and timescales. In this study, the 99th percentile (P99) was adopted as the threshold for defining EPEs, meaning that only 1% of all daily rainfall observations exceed this value. This method allows consistent intercomparison among stations with distinct climatic regimes and has been widely employed in Brazil and abroad (Santos, 2008; Schär et al., 2016; Silva et al., 2020; Ballarin et al., 2022). Recent assessments by the Intergovernmental Panel on Climate Change (IPCC, 2021) indicate that EPEs have become more intense and frequent in several regions of the world, particularly in southeastern South America. In Brazil, Marengo (2016) and Marengo et al. (2020) identified southeastern Brazil as one of the most vulnerable regions to heavy rainfall and flooding, reinforcing IPCC projections linking the intensification of EPEs to anthropogenic climate change. Such alterations in rainfall regimes have more severe consequences in highly urbanized regions like São Paulo, where population concentration, impervious surfaces, and complex infrastructure exacerbate hydrological impacts.
Several meteorological mechanisms modulate precipitation in São Paulo. The central synoptic systems include the South Atlantic Convergence Zone (SACZ), cold fronts, and subtropical and extratropical cyclones (Carvalho et al., 2002; Lima et al., 2010). Cold fronts are associated with extratropical cyclones and originate from the interaction between contrasting air masses (Bjerknes; Solberg, 1922), while the SACZ corresponds to a quasi-stationary, northwest–southeast-oriented band of cloudiness that channels moisture from the southern Amazon Basin toward southeastern Brazil (Carvalho et al., 2004; Cavalcanti, 2012). The SACZ frequently produces multi-day rainfall events during late spring and summer, often responsible for large-scale flooding and landslides (Silva et al., 2020). On a smaller scale, sea-breeze circulations along the coast also play a key role in local convection. Vernado and Pereira Filho (2016) and Perez and Silva Dias (2017) observed that sea-breeze-induced convection accounts for nearly half of the annual precipitation at the University of São Paulo Institute of Astronomy, Geophysics, and Atmospheric Sciences (IAG-USP) station, illustrating the importance of mesoscale processes in the state's rainfall climatology.
In addition to continental and topographic factors, the Southwestern Atlantic Ocean exerts a crucial influence on rainfall variability and the occurrence of extreme precipitation in southeastern Brazil. Variations in sea surface temperature (SST) in this sector affect moisture fluxes, atmospheric instability, and the positioning of synoptic systems such as the SACZ. Recent studies have identified a positive trend in SSTs and an increase in the frequency and intensity of marine heat waves in the South Atlantic, conditions that enhance local evaporation and low-level moisture transport toward the continent (Vasconcellos et al., 2023). These processes intensify convective activity during the warm season and may contribute to the observed rise in the magnitude and persistence of heavy rainfall events in southeastern Brazil. Consequently, oceanic warming emerges as an additional driver modulating the interannual variability and long-term behavior of EPEs in the region.
Taken together, these conceptual and physical frameworks demonstrate that EPEs in São Paulo result from the complex interplay among large-scale circulation patterns, mesoscale dynamics, and local geographic features. The statistical–synoptic perspective adopted in this study, based on the P99 threshold, provides a consistent means of identifying and comparing extremes while supporting a physically grounded interpretation of the atmospheric processes that generate them.
DATA AND METHODOLOGY
Study area
The area of interest of this work comprises the entire state of São Paulo (Figure 1), which is located latitudinally between 20 and 25° south of the Equator, that is, around the Tropic of Capricorn. Its longitudinal extent spans from the Atlantic coast to more than 600 km inland. The state's topography is highly heterogeneous, ranging from low coastal plains to elevated plateaus exceeding 1,000 m in altitude, which influences local rainfall patterns and orographic enhancement. São Paulo is also the most populous and affluent state in Brazil (Egler et al., 2013), underscoring the need for studies on it. Figure 1 also shows the pluviometric stations (white circles) used in this study. Initially, we intended to use all stations available in the Department of Water and Electric Energy of São Paulo (DAEE-SP) database. However, many stations in the state were decommissioned in recent years or exhibited lengthy interruptions in data recording over the past decades. In addition, we identified excessive spurious values and multi-month gaps in the record, leading to the exclusion of several stations. The final set of 21 stations was purposefully selected to ensure spatial coverage across the state of São Paulo. Among the chosen stations, some still have occasional missing data, but these do not exceed 1% of the total daily records for each station.

Geographic location of the study area and spatial distribution of the 21 rainfall stations used in this study across the state of São Paulo, Brazil.
Rainfall database
Twenty-one rainfall stations (Table 1) from the DAEE-SP network were used for this study, with data extracted from its hydrological database (DAEE-SP, 2023). The dataset consists of daily rainfall from 1970 to 2022. The P99 of daily precipitation was computed for each station to characterize extreme events.
Characterization of extreme precipitation events
The threshold adopted in this study to characterize precipitation events as extreme is P99. This criterion has been widely used in the literature, as demonstrated by several authors. Santos (2008) investigated EPEs in the state of Bahia, while Oyama and Oliveira (2016) used P99 to analyze extreme events at the Alcântara Launch Center. In addition, Silva et al. (2020) applied this threshold to examine extreme rainfall in Minas Gerais. The P99 calculation was performed in Python using data-processing libraries. The calculation was carried out for each of the 21 rainfall stations, all of which have daily data covering the period from 1970 to 2022, with missing records not exceeding 1% of the total dataset for each station. Initially, the P99 was computed considering the entire historical series of each station. Subsequently, a second scenario was evaluated, with P99 calculated for each season: summer (DJF), autumn (MAM), winter (JJA), and spring (SON). To avoid distortions caused by the predominance of zero-precipitation days typical of tropical climates, only wet days (daily precipitation ≥ 1 mm) were considered in the percentile calculation, following the WMO (2017) convention for defining wet days in climatological analyses. This conditioning allows a more representative characterization of rainfall intensity, although it slightly reduces the sample size and may introduce minor differences among stations with distinct rainfall regimes.
After calculating the P99 for each rainfall station in both scenarios, the Quantum GIS (QGIS) software (QGIS Development Team, 2024) was used to generate maps for visualizing the spatial distribution of the values. For this, the Inverse Distance Weighted (IDW) method was used, which estimates unknown values as a weighted average of known values, assigning greater weight to the closest points and less to the most distant ones. The second step was to calculate the number of days with precipitation exceeding P99 in each season, both across the entire historical series and for each season of the year. These results were also represented on maps generated in QGIS using the IDW method, allowing the identification of regions of the state of São Paulo with the highest frequency of days with extreme events.
Identification of the meteorological mechanisms associated with extreme precipitation events
The identification and classification of the meteorological systems associated with EPEs were conducted through an integrated synoptic and climatological analysis. This approach combined multiple authoritative datasets to ensure temporal continuity and methodological consistency throughout the study period. The Climanálise bulletins produced by the Center for Weather Forecasting and Climate Studies (CPTEC/INPE) were examined for the period 1996–2014, as they provide monthly narrative assessments of the central synoptic systems affecting Brazil, including frontal activity, the SACZ, and convective disturbances. Complementarily, daily synoptic charts issued by CPTEC and the Brazilian Navy Hydrography Center (CHM) were analyzed for the broader period 1996–2022, enabling the identification of atmospheric circulation patterns at the surface and in the lower troposphere.
The year 1996 was adopted as the initial reference because Climanálise bulletins were unavailable for earlier years, thereby ensuring consistency between the documentary and chart-based analyses. The classification criterion for attributing each EPE to a specific meteorological system relied on the convergence of evidence among the three sources (CPTEC bulletins, CPTEC synoptic charts, and CHM synoptic charts). Through this cross-validation procedure, it was possible to clearly distinguish events predominantly influenced by cold fronts, SACZ episodes, or localized convection, which represent the main mechanisms responsible for extreme rainfall over southeastern Brazil.
RESULTS AND DISCUSSION
Spatial distribution of rainfall in the state of São Paulo
Figure 2 shows the spatial distribution of average annual precipitation in the state of São Paulo, based on daily data from 21 rainfall stations over the 53 years analyzed. The highest rainfall volumes are concentrated in the southern portion and coastal areas, where annual precipitation exceeds 1,600 mm, as well as in parts of the northeastern region, where topographic influence is evident. Conversely, a gradual decrease is observed toward the northwest and western portions of the state, where annual totals approach 1,200 mm and the continentality effect becomes more pronounced. The state average is approximately 1,420 mm, consistent with the findings of Nunes et al. (2023), who reported lower precipitation in the western sector and higher values in the south and coastal zones, estimating an average of around 1,500 mm for 1973–2012. However, some comparatively lower values were found in areas of higher elevation along Serra do Mar, where rainfall typically exceeds 1,800 mm according to previous studies (e.g., Reboita et al., 2010; Lemes et al., 2019). This underestimation likely results from the exclusion of several coastal and mountain stations during the data consistency stage, as these sites exhibited prolonged gaps and discontinuities in their historical records.

Spatial distribution of average annual precipitation in the state of São Paulo, Brazil, for the period 1970–2022, based on daily rainfall data from 21 stations of the DAEE-SP network.
The observed spatial gradients result from the combined effects of orographic lifting, moisture advection from the South Atlantic, and the passage of frontal systems, which tend to weaken as they progress inland and lose oceanic influence (Reboita et al., 2010; Escobar et al., 2016). In the southern and coastal regions, the interaction between transient fronts and the steep slopes of Serra do Mar enhances local convergence and precipitation. In contrast, inland areas are dominated by subsidence associated with subtropical high-pressure systems, which favor drier conditions. The northern and northeastern sectors are seasonally modulated by convective activity related to the SACZ, which channels moisture from the Amazon Basin toward southeastern Brazil during the summer months (Carvalho et al., 2002; Zilli et al., 2017). Overall, the spatial pattern highlights how the interplay between large-scale circulation, topography, and local convective processes shapes São Paulo's rainfall regime, while revealing the sensitivity of regional averages to the density and spatial representativeness of the rain gauge network.
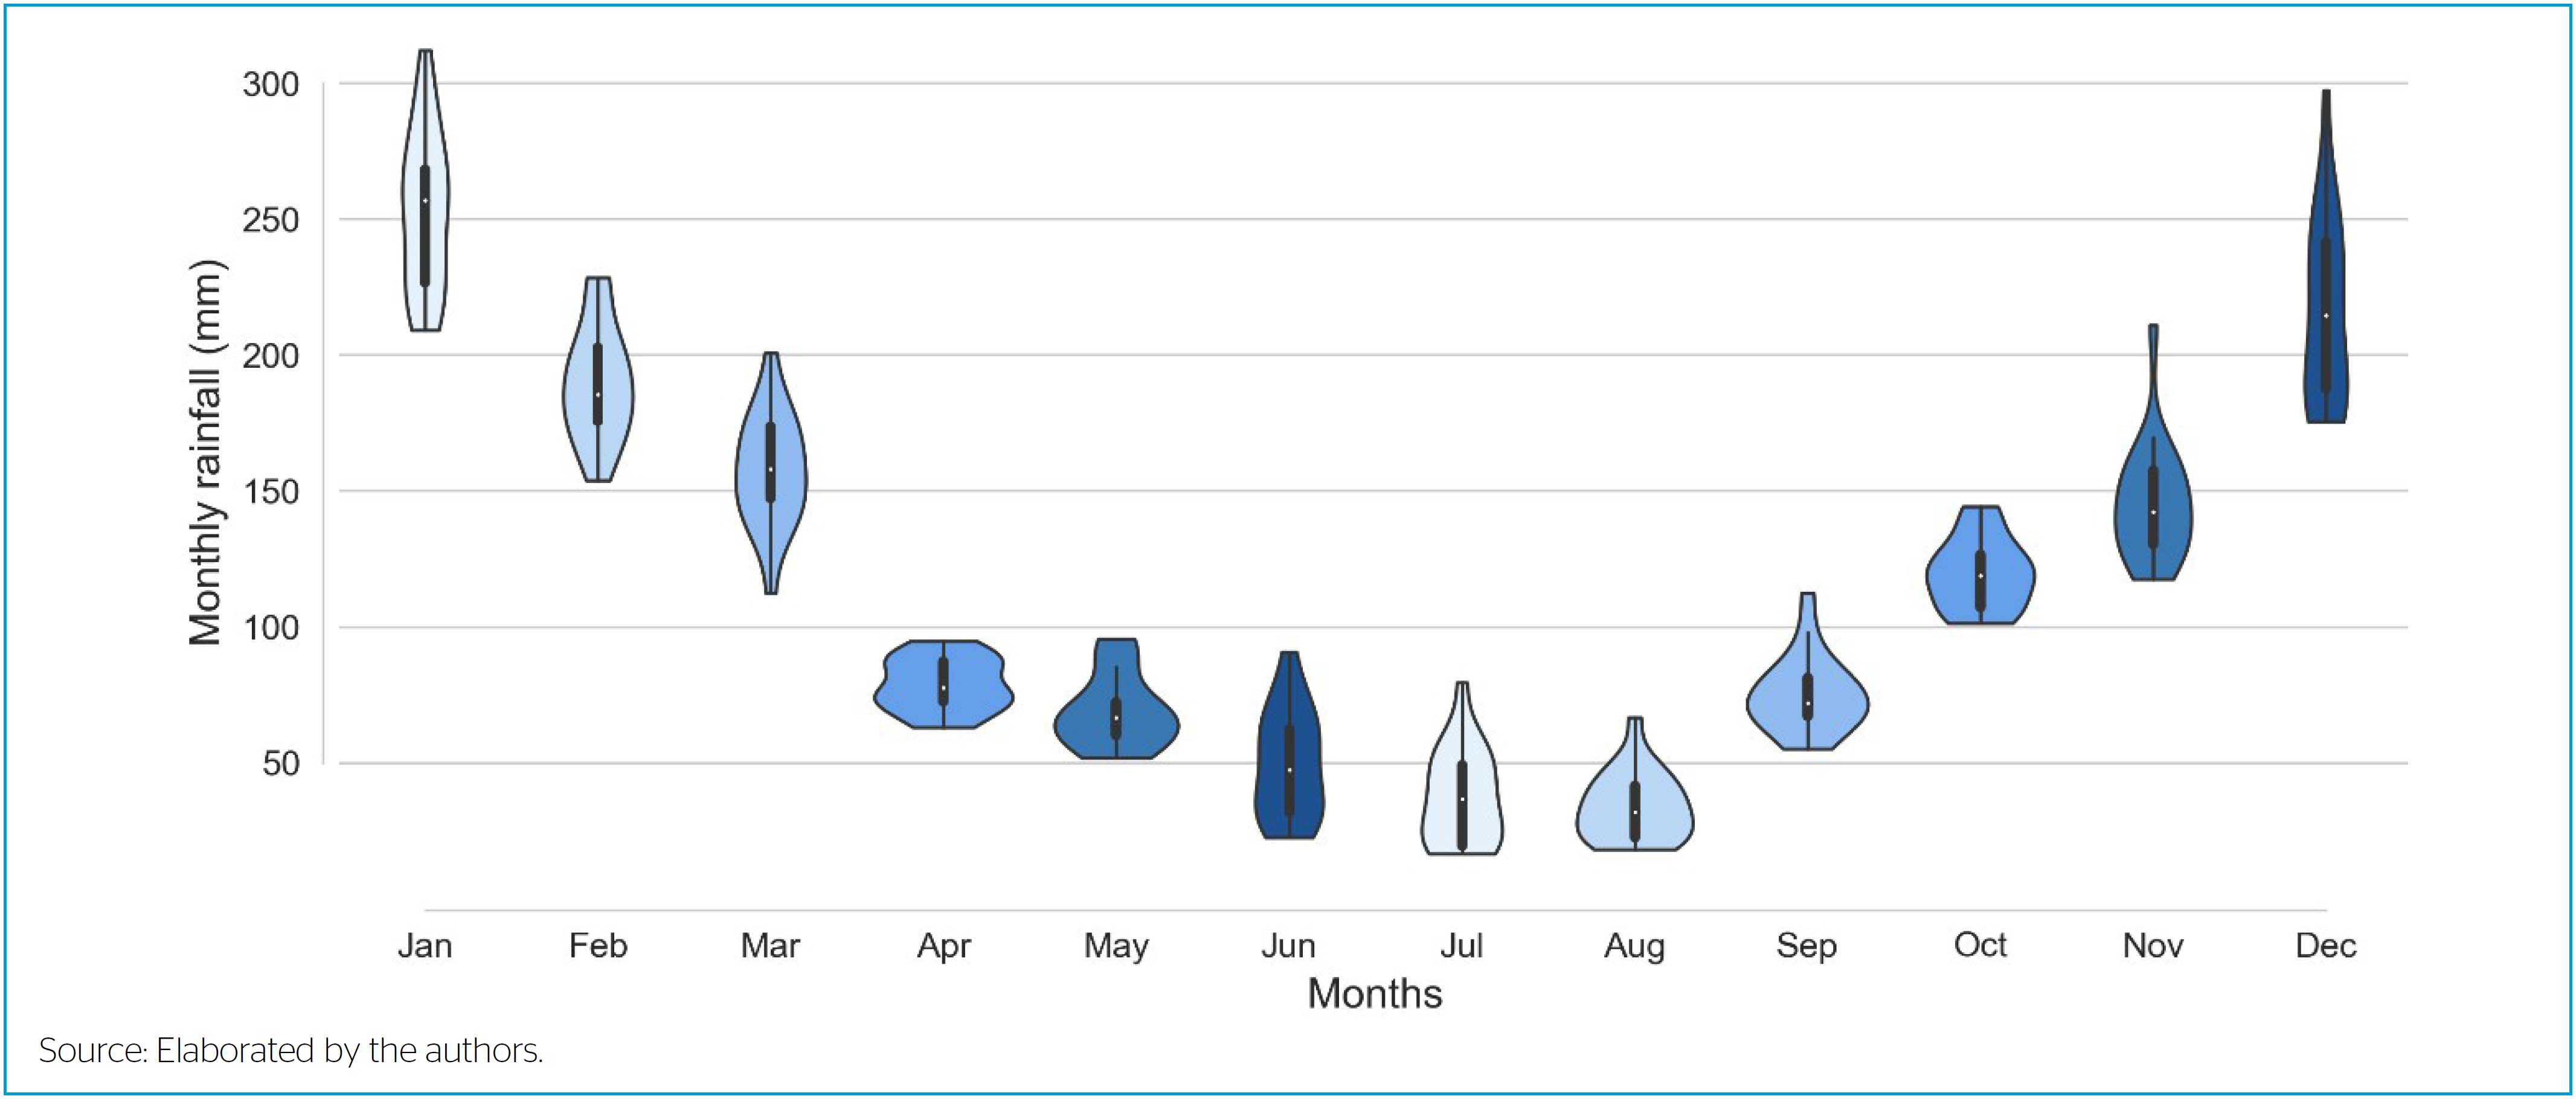
Figure 3 presents the violin plots for the monthly rainfall distribution across the 21 DAEE-SP stations in São Paulo State for the 1970–2022 period. The plots reveal a well-defined seasonal cycle, with markedly higher rainfall during the austral summer (December–March) and a sharp decrease during the winter months (June–August). The wet-season maximum corresponds to the period of convective activity in southeastern Brazil, when large-scale moisture convergence and local thermodynamic instability act together to sustain prolonged rainfall episodes. This variability reflects the alternating influence of the SACZ, which is responsible for persistent, widespread rainfall and transient cold fronts that periodically enhance moisture flux and convection. In contrast, the minimum winter results from the dominance of subtropical high-pressure systems and dry air advection from the South Atlantic, which suppresses vertical motion and inhibits convective development.

Violin plots of monthly rainfall distribution based on data from 21 DAEE-SP stations in São Paulo State during the 1970–2022 period.
From a statistical perspective, the violin plots illustrate the amplitude of monthly variability across the station network. Broader shapes during the summer months (especially January and December) indicate high interstation variability and the frequent occurrence of extreme rainfall, while the narrow, flattened violins in winter denote consistently low totals and reduced spatial dispersion. Transitional months such as April and October show asymmetric distributions skewed toward higher values, suggesting that isolated heavy rainfall events can occur outside the core rainy season due to late or early intrusions of frontal systems or mesoscale convective complexes. Overall, the figure highlights how São Paulo's rainfall regime is modulated by the interplay between large-scale atmospheric circulation and regional convective processes, consistent with previous climatological studies for southeastern Brazil (e.g., Carvalho et al., 2004; Reboita et al., 2010; Silva Dias et al., 2013).
Figure 4 shows the spatial distribution of average seasonal precipitation in the state of São Paulo, highlighting a well-defined annual cycle. During summer (Figure 4a, December–February), precipitation reaches its maximum, with values above 200 mm across the entire state and exceeding 260 mm in the northern region. This pattern reflects the intensified moisture transport from the Amazon Basin and the frequent establishment of the SACZ (Lemes et al., 2019), combined with enhanced surface heating that promotes deep convection.

Spatial distribution of average seasonal precipitation in the state of São Paulo, Brazil, for (a) summer, (b) autumn, (c) winter, and (d) spring, during the period 1970–2022.
In autumn (Figure 4b, March–May), rainfall decreases markedly, with average accumulations below 120 mm across the state. This reduction becomes even more pronounced in winter (Figure 4c, June–August), when limited moisture availability and reduced radiative heating result in scarce precipitation (Reboita et al., 2010). An exception occurs in the southern portion of the state, which records slightly higher volumes—near 80 mm—due to the passage of cold fronts that continue to organize rainfall (Escobar et al., 2016). Spring (Figure 4d, September–November) marks a gradual transition toward wetter conditions, with values exceeding 140 mm in northern São Paulo. This increase reflects the progressive re-establishment of atmospheric conditions favorable to convection, including renewed moisture influx and the onset of cloud bands frequently associated with the SACZ, as reported by Nogués Peagle et al. (2002) and Barbosa (2003).
The 99th percentile
Figure 5 shows the spatial distribution of the daily P99 of rainfall in the state of São Paulo between 1970 and 2022. The annual spatial distribution of P99 in the state of São Paulo exhibits a well-defined pattern from 1970 to 2022, characterized by a contrast between the northern and southern regions (Figure 5). The highest values were recorded in the north, northwest, and central areas, with numbers close to 80 mm, with the northwest region standing out, where values reach around 90 mm. Such a result means that, for there to be an EPE in these locations, using the annual P99 calculation, records must exceed 80-90 mm of rain in 24 hours. On the other hand, the southern and coastal regions showed lower P99 values, ranging from 60 mm to 70 mm. Therefore, for there to be an EPE in these locations, using the annual P99 calculation, records must exceed a lower threshold: 60–70 mm of rain in 24 hours.

Spatial distribution of the daily 99th percentile of rainfall in the state of São Paulo between 1970 and 2022.
However, when analyzing the frequency of days exceeding the P99 threshold (Figure 6), the pattern inverts from that in Figure 5. The northern, northwestern, and central regions recorded lower recurrence of EPEs, with approximately 45–50 days above P99 during the 1970–2022 period. Conversely, the southern and coastal regions show a higher frequency, ranging from 55 to 65 days above P99. It is important to note that the P99 values were calculated based solely on wet days (daily precipitation equal to or greater than 1 mm). This conditioning helps to avoid distortions caused by the predominance of zero-precipitation days typical of tropical climates, allowing a more representative description of rainfall intensities. Nevertheless, because this approach changes the adequate sample size, slight differences in the absolute number of exceedances among stations may reflect differences in rainfall regimes rather than purely statistical contrasts. This limitation should be considered when interpreting the spatial patterns.

Spatial distribution of the number of days exceeding the 99th percentile of daily precipitation at each station in the state of São Paulo for the period 1970–2022.
This contrast indicates that the southern and coastal portions of São Paulo experienced, on average, about 44 % more extreme precipitation days than the northern, northwestern, and central areas. The results, therefore, reveal that the northern region tends to exhibit more intense but less frequent EPEs, while the southern region shows less intense but more frequent EPEs. This pattern suggests that EPEs in the southern portion of the state are primarily associated with transient systems, such as cold fronts that frequently affect this region throughout the year (Andrade, 2005). Orographic barriers along the coast tend to restrict the inland penetration of these systems, leading to a decrease in frequency and intensity towards the interior. Conversely, extreme events in the northern region may be more related to the formation of the SACZ, whose northwest–southeast orientation primarily influences that part of the state.
The monthly distribution of EPEs from 1970 to 2022 is shown in Figure 7. The figure represents the total number of days exceeding the P99 threshold aggregated across all 21 rainfall stations in the state of São Paulo. A higher incidence of EPEs is observed between December and March, with each month registering more than 100 events statewide. January stands out as the month with the highest frequency, with 279 cases (27% of all events observed), followed by December with 188 cases (18%). From April onward, there is a marked reduction in EPE occurrence, with the lowest frequencies in July, August, and September. Among these, August has the fewest events, with only 6 cases—about 1% of the 1,043 total records aggregated for the entire period. This pattern reflects the seasonality of rainfall extremes in southeastern Brazil, with maxima during the austral summer when convective activity and moisture availability are most significant.

Monthly distribution of extreme precipitation events aggregated for all 21 rainfall stations in the state of São Paulo during 1970–2022. Values represent the total number of days exceeding each station's P99 threshold.
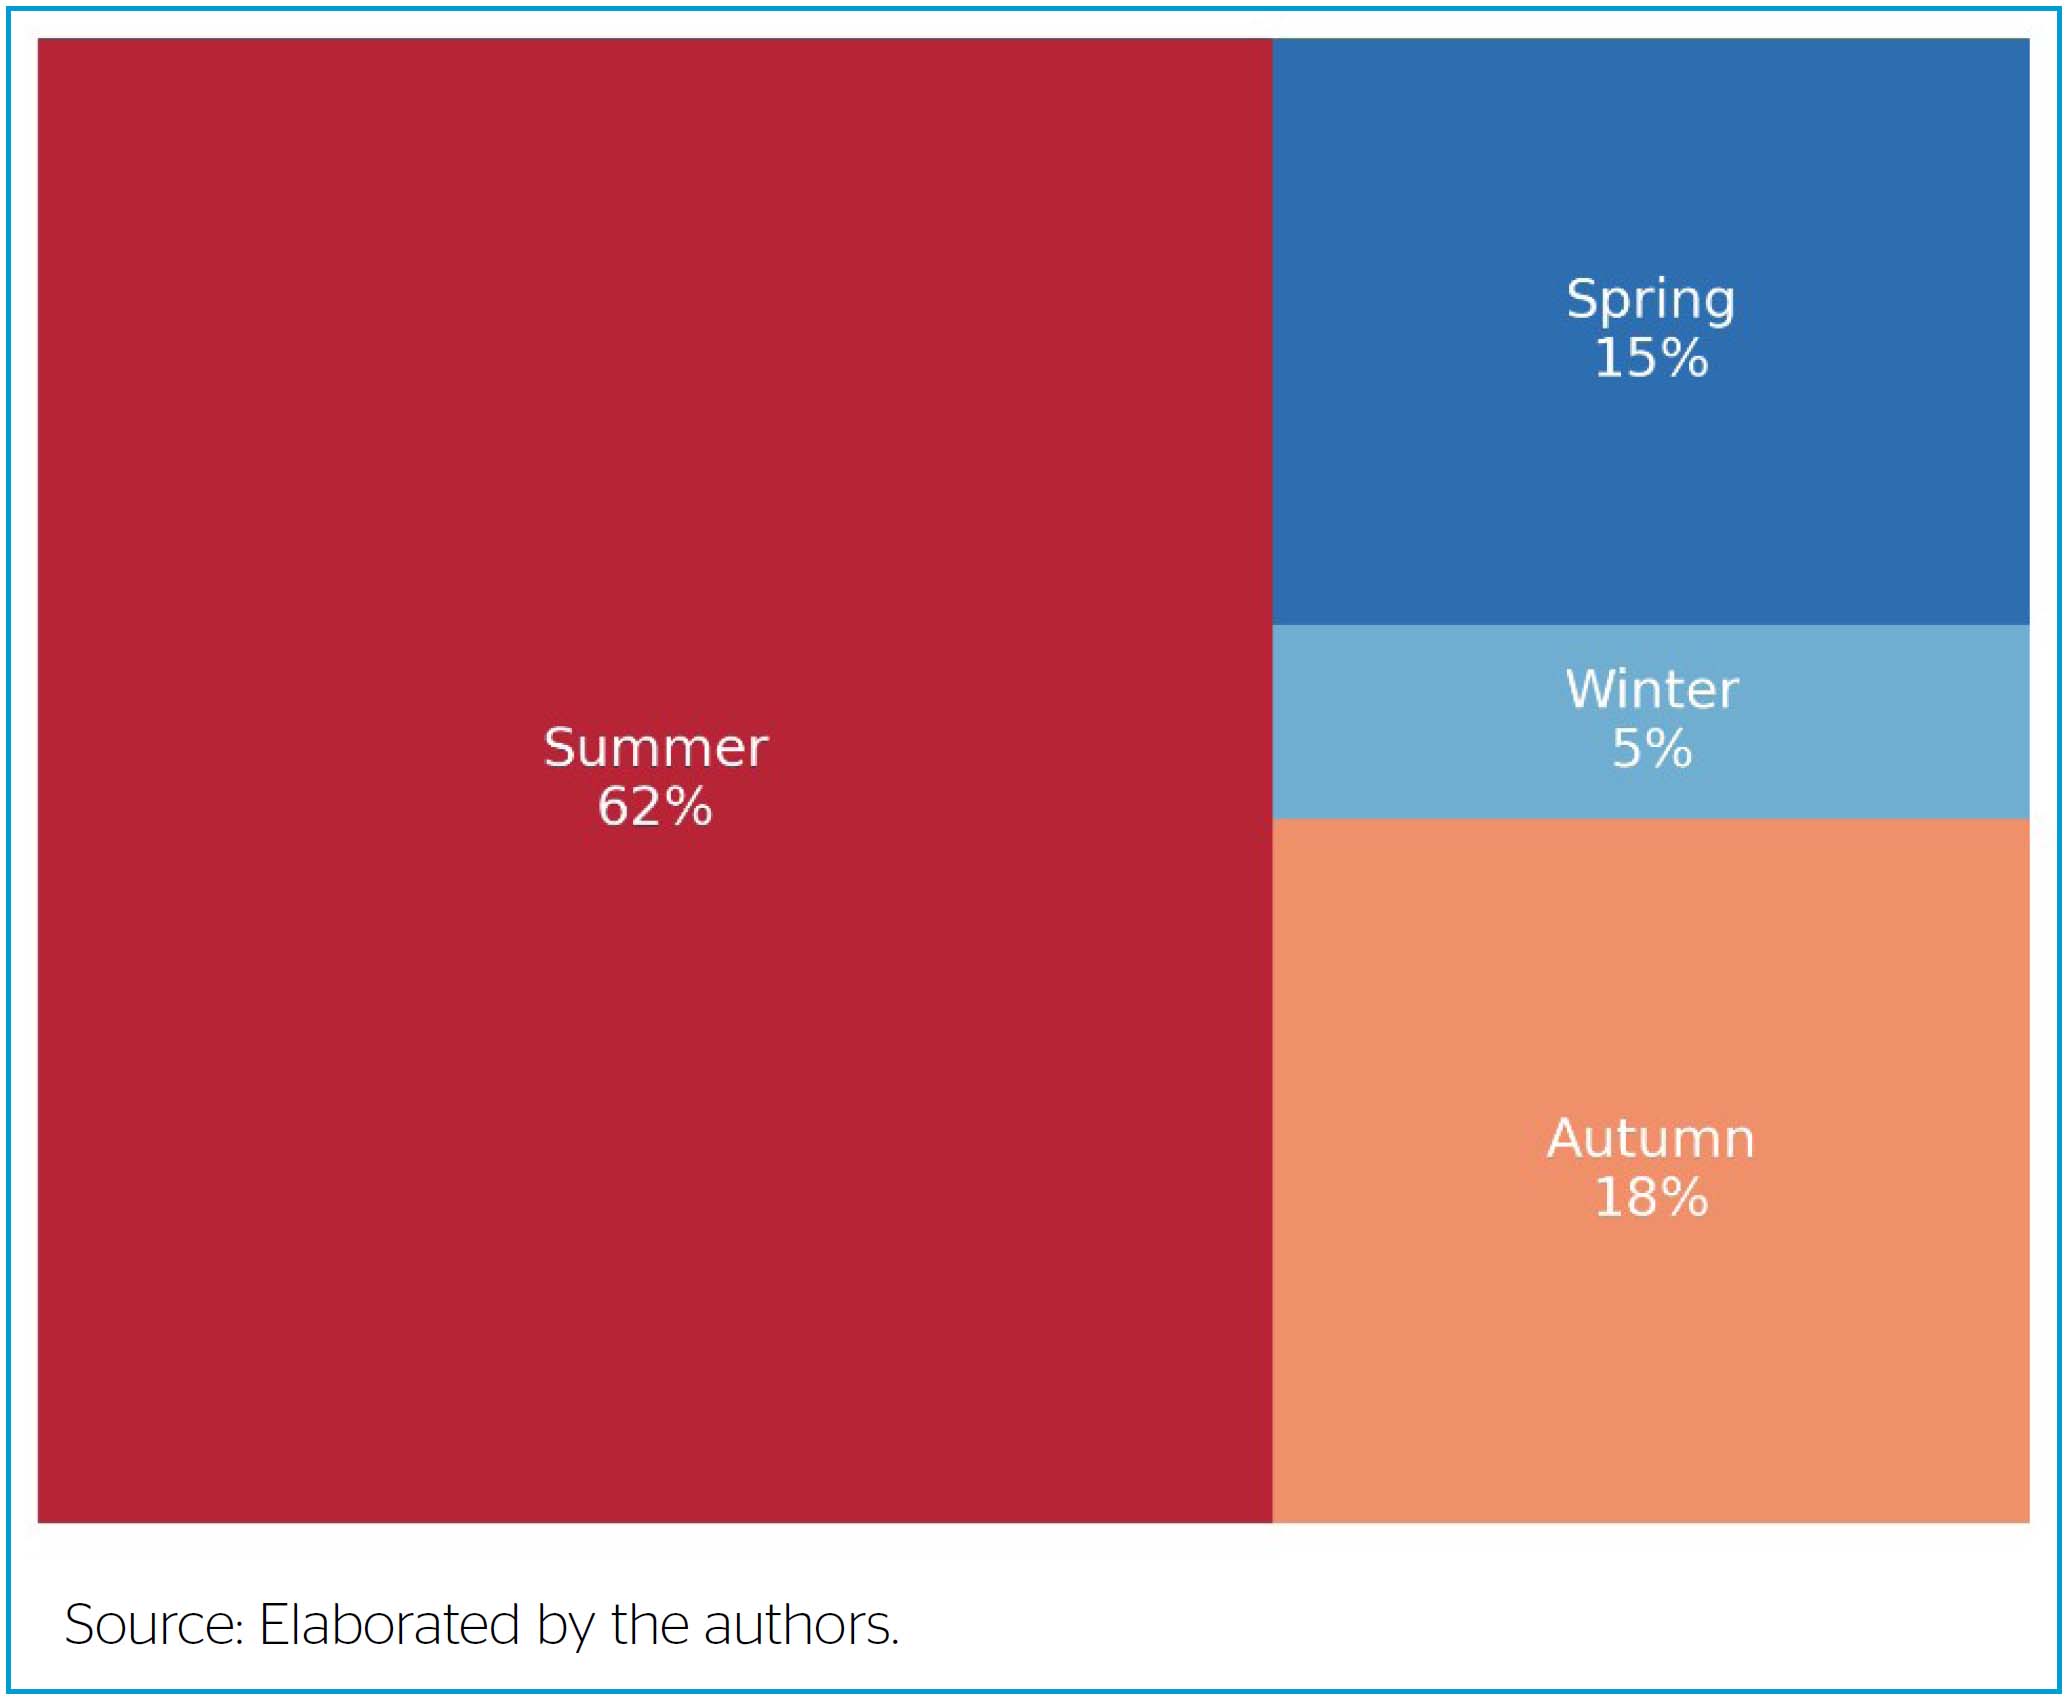
The seasonal distribution of EPE also showed a well-defined pattern (Figure 8). Summer recorded the highest number of these events, with 642 cases, accounting for 62% of the total. This result indicates that the rainy season (Figure 4a) is also the period with the highest incidence of extreme rainfall. This pattern can be attributed to the more intense daytime heating at this time of year, which favors convective development, as well as to the action of characteristic meteorological systems, such as the SACZ and cold fronts, as highlighted by Segalin (2012). Winter, on the other hand, had the fewest events, with only 55 records, representing 5% of the total. This data reinforces that the dry season (Figure 4c) is also the one with the lowest incidence of extreme rainfall in the state. The transition seasons, autumn and spring, had similar numbers of EPE occurrences: 192 and 154, respectively. Autumn recorded slightly higher participation, corresponding to 18% of the events, while spring totaled 15%. This result is possibly due to the similar climatological characteristics of autumn and summer.

Seasonal distribution of extreme precipitation events in São Paulo State between 1970 and 2022.
The analysis of the seasonal spatial distribution of EPEs reveals that the highest P99 values occur during the summer (Figure 8a), reaching up to 90 mm in the North/Northwest region of the state. In the extreme south and on the north coast, the values are slightly lower, with the latter presenting a threshold of 70 mm. These results indicate that, for a daily rainfall event to be classified as extreme in the north of the state during the summer months, it needs, on average, to register 20 mm more precipitation than in the south and on the coast, representing an increase of 28%. In the fall, P99 values decrease compared to summer, although the spatial distribution pattern remains similar (Figure 8b). The north, northwest, and central regions of the state present higher thresholds, close to 80 mm, while the south and the coast register lower values, around 60 mm. Such a result indicates that, for a rainfall event to be considered extreme in the north of the state during this season, it still needs to average 20 mm more precipitation than in the south and on the coast. However, this difference now represents a 33% percentage increase, highlighting a contrast between the northern and southern portions of the state compared to the summer months.
Winter is the season with the lowest P99 values throughout the state (Figure 8c). The north and northwest regions have thresholds close to 60 mm, while the north coast records even lower values, around 40 mm. The only exception is the southern region of the state, which now presents the highest thresholds, reaching 70 mm. Thus, in winter, a rainfall event is considered extreme, with significantly lower accumulations in the north and on the north coast (40 mm) compared to the south of the state (70 mm), highlighting a 75% difference in rainfall records between these regions, and could be associated with the more frequent passage of frontal systems over southeast Brazil. Studies by Oliveira (1986), Lemos and Calbete (1996), and Justi da Silva and Silva Dias (2000; 2002) found a higher frequency of frontal systems along the coast of southeastern Brazil in winter than in summer. In spring, the spatial distribution of P99 values (Figure 9) follows a pattern similar to that observed in autumn, with the western, northern, northwestern, and central regions presenting higher thresholds compared to the southern and coastal areas. However, spring values are slightly lower, ranging from around 70 mm in the first-mentioned regions to around 60 mm in the others. Therefore, for a rainfall event to be classified as extreme in the north of the state, it must accumulate, on average, 10 mm more than in the south and on the coast, representing a difference of just 17%.

Spatial distribution of P99 rainfall in the state of São Paulo between 1970 and 2022 for (a) Summer; (b) Autumn, (c) Winter, and (d) Spring.
The frequency of these events during the summer (Figure 10a) shows a uniform distribution across the state, with an average of 20 occurrences per rainfall season in all regions over the 53-year analysis period. Such behavior indicates that, through an exclusively statistical analysis, any region of the state can experience an EPE every 2.5 years in the summer. Regarding the frequency of EPE in the fall (Figure 10b), a higher incidence is observed in the extreme south and along the coast of the state, with an average of 13 events over the 53-year analysis period. In contrast, the north, northwest, and central regions record an average of 10 events, indicating that the south and the coast have a frequency 30% higher than the other regions. Thus, through an exclusively statistical analysis, the southern region of the state experiences approximately one EPE in the spring every four years, while the northern region experiences approximately one EPE in the spring every five years. The frequency of EPEs in winter (Figure 10c) follows a well-defined pattern: while the northern region of the state records, on average, only four extreme events per rainfall station, the coast and, mainly, the extreme south have about eight occurrences over the 53 years analyzed, which represents twice as many. Thus, from a statistical perspective, the southern region of the state records, on average, one EPE every 6.5 years, whereas in the northern region the interval is three times as long, with an extreme event occurring only every 19.5 years. The frequency of EPEs in spring also exhibits similar behavior to that of autumn, with lower occurrence in the northern portion, where the average is 10 events per rainfall station over the 53 years studied, and higher incidence in the south and coast, which record an average of 15 occurrences per rainfall station in the historical series (Figure 10d). Statistically speaking, this means that in spring, EPEs occur approximately every five years in the north of the state, while in the south, the frequency is slightly higher, with one event every 3.5 years.

Seasonal spatial distribution of the occurrence of extreme precipitation events in the state of São Paulo between 1970 and 2022 for (a) summer, (b) autumn, (c) winter, and (d) spring.
Meteorological mechanisms associated with extreme precipitation events
The analysis of the 489 atmospheric systems responsible for the 534 EPEs in São Paulo State between 1996 and 2022 (Figure 11) reveals that cold fronts accounted for nearly half of all occurrences (46%). This predominance highlights the influence of baroclinic disturbances and midlatitude cyclones in modulating heavy rainfall over southeastern Brazil, especially during transition seasons when frontal incursions frequently interact with tropical moisture. Such interactions favor the development of mesoscale convective systems and stratiform precipitation bands extending over large areas, consistent with the findings of Reboita et al. (2010) and Marengo et al. (2020). The SACZ accounted for 28% of the total cases and showed a seasonal preference for the austral summer, in agreement with previous climatological studies (Carvalho et al., 2004; Zilli et al., 2017). These SACZ events are typically characterized by persistent, quasi-stationary convective bands extending from the Amazon Basin into the South Atlantic, producing long-duration, spatially extensive rainfall. Convective systems not directly linked to frontal or SACZ environments comprised 26% of all EPEs. Although less frequent, they are responsible for highly localized yet intense rainfall episodes, often enhanced by local thermodynamic instability, sea-breeze interactions, and orographic uplift along Serra do Mar and Paraíba Valley. Such events illustrate the importance of mesoscale and thermodynamic forcing in generating short-duration rainfall extremes in the region. Overall, the relative contributions of these three mechanisms demonstrate the multiscale character of precipitation extremes in São Paulo, underscoring the need for integrated analyses that link synoptic circulation, topography, and moisture transport to understand and forecast EPEs across southeastern Brazil.

Relative frequency of meteorological systems associated with extreme precipitation events in the state of São Paulo during the period 1996–2022.
Figure 12 presents the spatial distribution of the total number of EPEs associated with each meteorological mechanism identified in São Paulo State between 1996 and 2022. This analysis quantifies the frequency of EPEs linked to each atmospheric system, revealing marked spatial contrasts in their influence across the state. In Figure 12a, EPEs associated with cold fronts are concentrated in the southern and coastal regions, where the number of occurrences exceeds 16 in some locations. Conversely, the northern and northwestern sectors display fewer than five events. This pattern reflects the enhanced frontal activity and higher baroclinic instability typical of southern São Paulo, where extratropical cyclones frequently reach maturity and interact with the steep orography of Serra do Mar, intensifying upward motion and precipitation (Andrade, 2005). The orographic lifting along the coastal escarpment further amplifies rainfall totals in this region.

Spatial distribution of the total number of extreme precipitation events associated with different atmospheric mechanisms in the state of São Paulo (1996–2022): (a) cold fronts, (b) SACZ, and (c) convection.
In Figure 12b, events linked to the SACZ exhibit an almost opposite distribution, with maximum frequencies in the northern and northeastern portions of the state-reaching up to 12 occurrences in some areas—and a marked decrease toward the south. This spatial pattern is consistent with the climatological position of the SACZ's northwest–southeast-oriented convective band, which often extends from the Amazon Basin toward the Triângulo Mineiro and northern São Paulo during the austral summer. Persistent low-level moisture convergence and enhanced latent heat fluxes in this sector favor long-duration EPEs associated with organized convection. Finally, Figure 12c shows EPEs associated with local convection and mesoscale systems, which exhibit a more diffuse, irregular pattern, with most regions recording between six and eight events. The absence of a gradient reflects the heterogeneous nature of this category, which encompasses inverted troughs, instability lines, orographic convection, and subtropical cyclones that sporadically modulate rainfall. These events are typically short-lived and spatially localized, dependent on thermodynamic instability, moisture recycling, and microclimatic variations across the state. Lastly, the spatial patterns in Figure 12 show that large-scale synoptic systems (cold fronts and the SACZ) dominate extreme precipitation across distinct sectors of São Paulo. At the same time, local and mesoscale convection adds a more stochastic component to the distribution of extremes. This combination underscores the state's transitional climatic character—where tropical and extratropical influences coexist—and the crucial role of both circulation dynamics and topography in shaping regional rainfall extremes.
CONCLUSIONS
EPEs rank among the most disruptive hydrometeorological hazards in the state of São Paulo, frequently resulting in urban flooding, landslides, infrastructure damage, economic losses, and human casualties — particularly in densely populated areas with high social vulnerability. Understanding their spatial expression, seasonal behavior, and atmospheric drivers is therefore crucial for advancing risk governance and improving anticipatory actions. In this context, the present study assessed EPEs across São Paulo, integrating a percentile-based statistical approach with a synoptic–diagnostic classification to identify the mechanisms that trigger these events.
Using the P99 of daily precipitation as a threshold, 1,043 EPEs were identified over the study period, enabling a detailed evaluation of their spatial and temporal characteristics. The spatial analysis revealed a marked contrast across the state. The northern and northwestern regions exhibited EPEs with higher intensity thresholds, with daily values often exceeding 80–90 mm, whereas the southern and coastal sectors showed lower thresholds, typically 60–70 mm. Despite these contrasting thresholds, EPE frequency presented an inverse pattern: the southern and coastal areas recorded more frequent extremes. At the same time, the northern and northwestern sectors experienced fewer events, albeit of greater magnitude. Seasonal analysis confirmed a concentration of EPEs during summer, which accounted for the majority of occurrences and reflects the peak of the regional rainy season. Winter recorded a minimal number of events, consistent with the dominance of subsidence and drier atmospheric conditions. Transitional seasons (spring and autumn) displayed intermediate values, mirroring the gradual establishment or breakdown of summer and winter synoptic patterns.
From the meteorological systems evaluation, it was possible to verify that EPEs in São Paulo arise from the interaction of three dominant atmospheric mechanisms: cold fronts, the SAC), and convective systems. Cold fronts were the most frequent drivers, accounting for 46% of all classified events—particularly over the southern and coastal areas—where baroclinic disturbances and frontal incursions often organize rainfall and enhance precipitation. The SACZ represented 28% of the cases and showed a spatial preference toward the northern portion of the state, consistent with its typical northwest–southeast orientation that favors persistent, large-scale convective activity. Convection not associated with frontal systems or SACZ comprised the remaining 26%, generally producing short-lived but intense events, often modulated by thermodynamic instability, mesoscale features, and orographic influences. Together, these results highlight the multiscale nature of EPEs and the combined role of large-scale, regional, and local processes in shaping rainfall extremes. In addition, the integrated methodology applied in this study strengthens the physical interpretation of EPEs by connecting their statistical occurrence to their atmospheric drivers, contributing to improved situational awareness and risk anticipation. The findings also underscore the sensitivity of spatial analyses to station availability and data continuity, as the exclusion of several coastal and mountain stations underestimated rainfall along Serra do Mar, reinforcing the need to expand and maintain monitoring networks in areas where orographic effects are significant.
Beyond statistical insights, the results have direct operational and societal implications. Identifying the dominant mechanisms underlying EPEs supports the development of tailored early-warning strategies, as each system type exhibits distinct predictability, lead times, and spatial footprints. For example, SACZ-related events are often prolonged, enabling multi-day preparedness actions, whereas convective events demand rapid-response protocols due to their localized, short-lived nature. Understanding these differences enhances the capacity of Civil Defense agencies and meteorological centers to design mechanism-specific advisories, communication strategies, and risk-reduction measures. Finally, the findings highlight opportunities for future research. Further analyses could explore the relationship between EPEs and land-use change, urban expansion, or microclimatic modifications — particularly heat-island effects in metropolitan areas. Integrating ensemble forecasting, sub-seasonal prediction tools, and high-resolution modeling could also advance EPE predictability in São Paulo. Moreover, given the expected intensification of extreme rainfall under climate change scenarios, extending this analysis to evaluate projected shifts in EPE frequency and drivers would be a valuable continuation of this work.
DATA AVAILABILITY STATEMENT
The datasets generated and/or analyzed during the current study are available from the corresponding author upon.
REFERENCES
- ANDRADE, Kelen. Climatologia e comportamento dos sistemas frontais sobre a América do Sul Dissertação (Mestrado em Meteorologia) – Instituto Nacional de Pesquisas Espaciais (INPE), São José dos Campos, 2005.
-
BALLARIN, André Simões; ANACHE, Jamil Alexandre Ayach; WENDLAND, Edson. Trends and abrupt changes in extreme rainfall events and their influence on design quantiles: a case study in São Paulo, Brazil. Theoretical and Applied Climatology, v. 149, n. 3-4, p. 1753-1767, 2022. https://doi.org/10.1007/s00704-022-04139-9
» https://doi.org/10.1007/s00704-022-04139-9 - BARBOSA, L. A. Variabilidade interanual da Zona de Convergência do Atlântico Sul 2003. Dissertation (Master's Degree in Meteorology) – Instituto Nacional de Pesquisas Espaciais, São José dos Campos, 2003.
- BJERKNES, Jacob; SOLBERG, Halvor. Life cycle of cyclones and the polar front theory of atmospheric circulation. Geofysiske Publikasjoner, v. 3, n. 1, p. 3-18, 1922.
-
CARVALHO, José Ruy Porto de; ASSAD, Eduardo Delgado; OLIVEIRA, Aryeverton Fontes de; PINTO, Hilton Silveira. Annual maximum daily rainfall trends in the midwest, southeast and southern Brazil in the last 71 years. Weather and Climate Extremes, v. 5-6, p. 7-15, 2014. https://doi.org/10.1016/j.wace.2014.10.001
» https://doi.org/10.1016/j.wace.2014.10.001 - CARVALHO, Leila Maria Vespoli de; JONES, Charles; LIEBMANN, Brant. Eventos extremos de precipitação no sul da América do Sul e padrões convectivos em larga escala na Zona de Convergência do Atlântico Sul. Journal of Climate, v. 15, p. 2377-2394, 2002.
-
CARVALHO, Leila Maria Vespoli de; JONES, Charles; LIEBMANN, Brant. The South Atlantic Convergence Zone: intensity, form, persistence, and relationships with intraseasonal to interannual activity and extreme rainfall. Journal of Climate, v. 17, p. 88-108, 2004. https://doi.org/10.1175/1520-0442(2004)017≤0088:TSACZI≥2.0.CO;2
» https://doi.org/10.1175/1520-0442(2004)017≤0088:TSACZI≥2.0.CO;2 -
CAVALCANTI, Iracema Fonseca Albuquerque. Large scale and synoptic features associated with extreme precipitation over South America: a review and case studies for the first decade of the 21st century. Atmospheric Research, v. 118, p. 27-40, 2012. https://doi.org/10.1016/j.atmosres.2012.06.012
» https://doi.org/10.1016/j.atmosres.2012.06.012 - CENTRO UNIVERSITÁRIO DE ESTUDOS E PESQUISAS SOBRE DESASTRES DA UNIVERSIDADE FEDERAL DE SANTA CATARINA (CEPED/UFSC). Atlas Brasileiro de Desastres Naturais 1991–2012 2. ed. Florianópolis: CEPED/UFSC, 2013.
-
CORTEZ, Bianca Nespoli; PIRES, Gabrielle Ferreira; AVILA-DIAZ, Alvaro; FONSECA, Humberto Paiva; OLIVEIRA, Lais Rosa. Nonstationary extreme precipitation in Brazil. Hydrological Sciences Journal, v. 67, n. 9, p. 1372-1383, 2022. https://doi.org/10.1080/02626667.2022.2075267
» https://doi.org/10.1080/02626667.2022.2075267 -
DEPARTAMENTO DE ÁGUAS E ENERGIA ELÉTRICA DO ESTADO DE SÃO PAULO (DAEE-SP). Banco de dados hidrológicos São Paulo: DAEE-SP, 2023. Available at: https://hidrologia.spaguas.sp.gov.br/ Accessed on: July 22, 2025.
» https://hidrologia.spaguas.sp.gov.br/ -
DUFEK, Amanda Sabatini; AMBRIZZI, Tércio. Precipitation variability in São Paulo State, Brazil. Theoretical and Applied Climatology, v. 93, n. 3-4, p. 167-178, 2008. https://doi.org/10.1007/s00704-007-0348-7
» https://doi.org/10.1007/s00704-007-0348-7 -
EGLER, Carlos Antonio Gonçalves; BESSA, Vagner de Carvalho; GONÇALVES, André de Freitas. Dinâmica territorial e seus rebatimentos na organização regional do estado de São Paulo. Confins, n. 19, 2013. https://doi.org/10.4000/confins.8602
» https://doi.org/10.4000/confins.8602 -
ESCOBAR, Gustavo Carlos Juan; SELUCHI, Marcelo Enrique; ANDRADE, Kelen. Classificação sinótica de frentes frias associadas a chuvas extremas no leste de Santa Catarina (SC). Revista Brasileira de Meteorologia, v. 31, n. 4, supl. 1, p. 649-661, 2016. https://doi.org/10.1590/0102-7786312314b20150156
» https://doi.org/10.1590/0102-7786312314b20150156 - FARIAS JÚNIOR, José Edson Falcão de; BOTELHO, Rosangela Garrido Machado. Análise comparativa do tempo de concentração: um estudo de caso na bacia do rio Cônego, município de Nova Friburgo/RJ. In: SIMPÓSIO BRASILEIRO DE RECURSOS HÍDRICOS, 21., 2011. Anais […]. 2011. p. 1-20.
-
GOERL, Roberto Fabris; MICHEL, Gean Paulo; KOBIYAMA, Masato. Mapeamento de áreas susceptíveis a inundação com o modelo HAND e análise do seu desempenho em diferentes resoluções espaciais. Revista Brasileira de Cartografia, v. 69, n. 1, p. 61-69, 2017. https://doi.org/10.14393/rbcv69n1-44032
» https://doi.org/10.14393/rbcv69n1-44032 -
HADDAD, Eduardo Amaral; TEIXEIRA, Eliane. Economic impacts of natural disasters in megacities: The case of floods in São Paulo, Brazil. Habitat International, v. 45, part 2, p. 106-113, 2015. https://doi.org/10.1016/j.habitatint.2014.06.023
» https://doi.org/10.1016/j.habitatint.2014.06.023 - INTERGOVERNMENTAL PANEL ON CLIMATE CHANGE (IPCC). Climate change 2021: The physical science basis. Cambridge: Cambridge University Press, 2021.
- JUSTI DA SILVA, Maria Gertrudes A.; SILVA DIAS, Maria Assunção F. A estatística dos transientes na América do Sul. In: CONGRESSO BRASILEIRO DE METEOROLOGIA, 11., 2000, Rio de Janeiro. Anais […]. 2000.
- JUSTI DA SILVA, Maria Gertrudes A.; SILVA DIAS, Maria Assunção F. A frequência de fenômenos meteorológicos na América do Sul: uma climatologia. In: CONGRESSO BRASILEIRO DE METEOROLOGIA, 12., 2002, Foz do Iguaçu. Anais […]. 2002.
- LEMES, Murilo; REBOITA, Michelle Simões; TORRES, Roger Rodrigues. Elementos fisiográficos e a precipitação no Estado de São Paulo. In: PINHEIRO, Lidriana de Souza; GORAYEB, Adryane (org.). Geografia física e as mudanças globais Fortaleza: Editora UFC, 2019. p. 1-15.
- LEMOS, Carlos Fernando; CALBETE, Nuri Oyamburo. Sistemas frontais que atuaram no Brasil de 1987 a 1995. In: CLIMANÁLISE ESPECIAL: Edição Comemorativa de 10 anos. Brasília: INPE-CPTEC, 1996. p. 131-135.
- LIMA, K. C.; AMBRIZZI, Tércio; REBOITA, Michelle Simões. Anomalias de precipitação no Sudeste do Brasil: características dos sistemas atmosféricos atuantes. Revista Brasileira de Meteorologia, v. 25, n. 2, p. 157-169, 2010.
-
MARENGO, José A.; ARAGÃO, Luiz E. O. C.; COX, Peter M.; BETTS, Richard; COSTA, Duarte; KAYE, Neil; SMITH, Lauren T.; ALVES, Lincoln M.; REIS, Vera. Impacts of climate extremes in Brazil: the development of a web platform for understanding long-term sustainability of ecosystems and human health in Amazonia (PULSE-Brazil). Bulletin of the American Meteorological Society, v. 97, n. 8, p. 1341-1346, 2016. https://doi.org/10.1175/BAMS-D-14-00177.1
» https://doi.org/10.1175/BAMS-D-14-00177.1 -
MARENGO, José A.; ALVES, Lincoln Muniz; AMBRIZZI, Tercio; YOUNG, Andrea; BARRETO, Naurinete de Jesus da Costa; RAMOS, Andrea M. Trends in extreme rainfall and hydrogeometeorological disasters in the Metropolitan Area of São Paulo: a review. Annals of the New York Academy of Sciences, v. 1472, n. 1, p. 5-20, 2020. https://doi.org/10.1111/nyas.14307
» https://doi.org/10.1111/nyas.14307 -
MARENGO, José A.; VALVERDE, Maria Cleofé; OBREGON, Guilherme O. Observed and projected changes in rainfall extremes in the Metropolitan Area of São Paulo. Climate Research, v. 57, p. 61-72, 2013. https://doi.org/10.3354/cr01160
» https://doi.org/10.3354/cr01160 -
MCPHILLIPS, Lauren E.; CHANG, Heejung; CHESTER, Mikhail V.; DEPIETRI, Yaella; FRIEDMAN, Erin; GRIMM, Nancy B.; KOMINOSKI, John S.; MCPHEARSON, Timon; MÉNDEZ-LÁZARO, Pablo; ROSI, Emma J.; SHIVA, Javad Shafiei. Defining extreme events: a cross-disciplinary review. Earth's Future, v. 6, n. 3, p. 441-455, 2018. https://doi.org/10.1002/2017EF000686
» https://doi.org/10.1002/2017EF000686 - NOGUÉS PEAGLE, Julia; MECHOSO, Carlos R.; FU, Rong; BERBERY, E. Hugo; CHAO, Winston C.; TSING-CHANG, Chen; COOK, Kerry H.; ENFIELD, David; FERREIRA, Rosana Nieto; GRIMM, Alice; KOUSKY, Vermon; LIEBMANN, Brant; MARENGO, José A.; MO, Kingtse; NEELIN, J. David; PAEGLE, Jan; ROBERTSON, Andrew W.; SETH, Anji; VERA, Carolina; ZHOU, Jiayu. Progress in Pan America CLIVAR research: understanding the South American monsoon. Meteorologica, v. 27, p. 3-30, 2002.
-
NUNES, Luci Hidalgo; GABRIEL, Guilherme Henrique; MARENGO, José A. More erratic and more extreme: trends in precipitation in the State of São Paulo, Brazil. American Journal of Climate Change, v. 12, n. 1, p. 140-171, 2023. https://doi.org/10.4236/ajcc.2023.121008
» https://doi.org/10.4236/ajcc.2023.121008 -
OBREGÓN, Guillermo O.; MARENGO, José A.; NOBRE, Carlos A. Rainfall and climate variability: long-term trends in the Metropolitan Area of São Paulo in the 20th century. Climate Research, v. 61, p. 93-107, 2014. https://doi.org/10.3354/cr01241
» https://doi.org/10.3354/cr01241 - OLIVEIRA, Alda Santos. Interações entre sistemas frontais na América do Sul e convecção na Amazônia 1986. 134f. Dissertation (Master's Degree in Meteorology) – Instituto de Pesquisas Espaciais, São José dos Campos, 1986.
-
OYAMA, Marcos Daisuke; OLIVEIRA, Gabriel Miller de. Eventos de precipitação extrema na região do Centro de Lançamento de Alcântara. Revista Brasileira de Meteorologia, v. 31, n. 4, supl.), p. 662-674, 2016. https://doi.org/10.1590/0102-7786312314b20150157
» https://doi.org/10.1590/0102-7786312314b20150157 -
PEREZ, Gabriel M. P.; SILVA DIAS, Maria A. F. Long-term study of the occurrence and time of passage of sea breeze in São Paulo, 1960-2009. International Journal of Climatology, v. 37, suppl. 1, p. 1210-1220, 2017. https://doi.org/10.1002/joc.5077
» https://doi.org/10.1002/joc.5077 -
QGIS DEVELOPMENT TEAM. QGIS Geographic Information System Open Source Geospatial Foundation Project, 2024. Available at: https://qgis.org Accessed on: July 22, 2025.
» https://qgis.org -
REBOITA, Michelle Simões; GAN, Manoel Alonso; ROCHA, Rosmeri Porfírio; AMBRIZZI, Tércio. Regimes de precipitação na América do Sul: uma revisão. Revista Brasileira de Meteorologia, v. 25, n. 2, p. 185-204, 2010. https://doi.org/10.1590/S0102-77862010000200004
» https://doi.org/10.1590/S0102-77862010000200004 -
ROLIM, Glauco de Souza; CAMARGO, Marcelo Bento Paes de; LANIA, Daniel Grosseli; MORAES, Jener Fernando Leite de. Classificação climática de Köppen e de Thornthwaite e sua aplicabilidade na determinação de zonas agroclimáticas para o Estado de São Paulo. Bragantina, v. 66, n. 4, p. 711-720, 2007. https://doi.org/10.1590/S0006-87052007000400022
» https://doi.org/10.1590/S0006-87052007000400022 - SANTOS, Andréa Helena Machado dos. Eventos extremos de chuva em Salvador, Bahia: condições atmosféricas e impactos ambientais. 2008. 63f. Dissertation (Mastering em Meteorology), Programa de Pós-graduação em Meteorologia, Centro de Tecnologia e Recursos Naturais, Universidade Federal de Campina Grande, Campina Grande, 2008.
-
SAREWITZ, Daniel; PIELKE JR., Roger. Extreme events: a research and policy framework for disasters in context. International Geology Review, v. 43, n. 5, p. 406-418, 2001. https://doi.org/10.1080/00206810109465022
» https://doi.org/10.1080/00206810109465022 -
SCHÄR, Christoph; BAN, Nikolina; FISCHER, Erich M.; RAJCZAK, Jan; SCHMIDLI, Juerg; FREI, Christoph; GIORGI, Filippo; KARL, Thomas R.; KENDON, Elizabeth J.; TANK, Albert M. G. Klein; O’GORMAN, Paul A.; SILLMANN, Jana; ZHANG, Xuebin; ZWIERS, Francis W. Percentile indices for assessing changes in heavy precipitation events. Climatic Change, v. 137, p. 201-216, 2016. https://doi.org/10.1007/s10584-016-1669-2
» https://doi.org/10.1007/s10584-016-1669-2 - SEGALIN, Bruna. Características dos sistemas convectivos de mesoescala nas simulações climáticas do RegCM4 2012. 119f. Dissertation (Master's Degree in Atmospheric Sciences) – Universidade de São Paulo, São Paulo, 2012.
- SENEVIRATNE, Sonia I.; ZHANG, Xuebin; ADNAN, Muhammad; BADI, Wafae; DERECZYNSKI, Claudine; DI LUCA, Alejandro; GHOSH, Subimal; ISKANDER, Iskhaq; KOSSIN, James; LEWIS, Sophie; OTTO, Friederike; PINTO, Izidine; SATOH, Masake; VICENTE-SERRANO, Sergio M.; WEHNER, Michael; ZHOU, Botao. Weather and climate extreme events in a changing climate. In: INTERGOVERNMENTAL PANEL ON CLIMATE CHANGE (IPCC) (org.). Climate change 2021: The physical science basis. Cambridge: Cambridge University Press, 2021. p. 1513-1766.
-
SILVA, Fabrício Polifke; SILVA, Alfredo Silveira da; SILVA, Maria Gertrudes Alvarez Justi da. Extreme rainfall events in the Rio de Janeiro city (Brazil): description and a numerical sensitivity case study. Meteorology and Atmospheric Physics, v. 134, p. 77, 2022. https://doi.org/10.1007/s00703-022-00909-2
» https://doi.org/10.1007/s00703-022-00909-2 -
SILVA, Paola Nascimento; ESCOBAR, Gustavo Carlos Juan; REBOITA, Michelle Simões. Eventos extremos de precipitação no Estado de Minas Gerais associados com a ocorrência de episódios de Zona de Convergência do Atlântico Sul. Revista Brasileira de Geografia Física, v. 13, n. 3, p. 1013-1023, 2020. https://doi.org/10.26848/rbgf.v13.3.p1013-1023
» https://doi.org/10.26848/rbgf.v13.3.p1013-1023 -
SILVA DIAS, Maria Assunção Faus da; DIAS, Juliana; CARVALHO, Leila Maria Véspoli de; FREITAS, Edmilson Dias de; SILVA DIAS, Pedro Leite. Changes in extreme daily rainfall for São Paulo, Brazil. Climatic Change, v. 116, n. 3-4, p. 705-722, 2013. https://doi.org/10.1007/s10584-012-0504-7
» https://doi.org/10.1007/s10584-012-0504-7 -
SUGAHARA, Shigetoshi; DA ROCHA, Rosmeri Porfírio; SILVEIRA, Reinaldo. Non-stationary frequency analysis of extreme daily rainfall in São Paulo, Brazil. International Journal of Climatology, v. 29, n. 9, p. 1339-1349, 2009. https://doi.org/10.1002/joc.1760
» https://doi.org/10.1002/joc.1760 -
VASCONCELLOS, Fernanda Cerqueira; SOUZA, João Neves de; DERECZYNSKI, Claudine Pereira; LUIZ-SILVA, Wanderson; SILVA, Fabricio Polifke da; PARISE, Claudia Klose. Warming trends of southwestern Atlantic SST and the summer's warmest SST's impact on South American climate. International Journal of Climatology, v. 43, n. 12, p. 5604-5619, 2023. https://doi.org/10.1002/joc.8163
» https://doi.org/10.1002/joc.8163 -
VERNADO, Felipe; PEREIRA FILHO, Augusto José. Severe weather caused by heat island and sea breeze effects in the metropolitan area of São Paulo, Brazil. Advances in Meteorology, p. 1-13, 2016. https://doi.org/10.1155/2016/8364134
» https://doi.org/10.1155/2016/8364134 - WORLD METEOROLOGICAL ORGANIZATION (WMO). Guidelines on climate metadata and homogenization Switzerland: WMO, 2017. (WMO-No. 1206.)
-
ZHANG, Xuebin; ALEXANDER, Lisa; HEGERL, Gabriele Clarissa; JONES, Philip; TANK, Albert Klain; PETERSON, Thomas Carl; TREWIN, Blair; ZWIERS, Francis W. Indices for monitoring changes in extremes based on daily temperature and precipitation data. Wiley Interdisciplinary Reviews: Climate Change, v. 2, n. 6, p. 851-870, 2011. https://doi.org/10.1002/wcc.147
» https://doi.org/10.1002/wcc.147 -
ZILLI, Marcia Terezinha; CARVALHO, Leila Maria Véspoli de; LIEBMANN, Brant; SILVA DIAS, Maria Assunção Faus da. A comprehensive analysis of trends in extreme precipitation over the southeastern coast of Brazil. International Journal of Climatology, v. 37, n. 5, p. 2269-2279, 2017. https://doi.org/10.1002/joc.4840
» https://doi.org/10.1002/joc.4840
Edited by
-
Editor:
Davi Gasparini Fernandes Cunha, Universidade de São Paulo, São Carlos, São Paulo/SP, Brasil. http://orcid.org/0000-0003-1876-3623