Case Study on Photovoltaic System: Impact of Solarimetric Stations on Simulations and Anomaly Detection
ABSTRACT
Local solarimetric stations (LSS) are essential for collecting data to evaluate photovoltaic (PV) plant performance and improve simulation accuracy. When unavailable, commercial solar databases (CSD), typically derived from satellite-based typical years, are used. This study compared the impact of LSS and CSD data on PV simulations and explored the use of LSS data for anomaly detection. Two LSS were analyzed: one at a small-scale PV system (minigeneration in Brazil) and another at a large-scale PV plant. The minigeneration station measured irradiance components to calculate Plane of Array (POA) irradiance, while the large-scale station directly measured POA. For the minigeneration system, simulations using LSS data showed a lower discrepancy (0.21%) compared to CSD (3.13%). For the large-scale plant, a -5.99% discrepancy using LSS revealed anomalies in energy generation. MAE and RMSE improved significantly with LSS for the large-scale system, with MAE decreasing from 660.25 MWh (CSD) to 348.08 MWh. Additionally, an unsupervised anomaly detection flagged 2.88% and 4.47% of data for two inverters, showcasing LSS potential for predictive models. These findings suggest that while LSS data are valuable for PV plant performance analysis, their effectiveness may depend on spectral range, averaging intervals, and irradiance transposition in simulations.
KEYWORDS
Photovoltaic Plant; Solarimetric Stations; POA irradiance; Anomaly Detection
I. INTRODUCTION
A solarimetric station or solar weather station, is a set of instruments for measuring various aspects/characteristics of sunlight intensity and weather conditions [1], [2]. It typically consists of devices, such as pyranometers to measure global solar radiation, pyrheliometers for direct solar radiation, and sensors for other meteorological parameters like air temperature, wind speed, and relative air humidity. Some stations also include devices to measure diffuse solar radiation, albedometer [3], and sunlight incidence angle, mainly in studies of photovoltaic (PV) plants.
These stations provide comprehensive, accurate, and real-time solar irradiance and meteorological data, which are integral for precise planning, design, and performance assessment of PV power systems. For example, they can be used to perform simulations in PV software more accurately, since part of the error comes from the solarimetric bases of satellites. Simulation outcomes may vary with data used [4]. In this way, the importance of studying how these datasets can influence the simulation and analysis of PV systems is highlighted, particularly when using data from a local solarimetric station (LSS) or satellite data.
Along with the solarimetric station data, the monitoring data from the PV inverter is also included. The literature highlights the importance of monitoring PV data [5], [6]; however, these datasets are often extensive, and integrators managing multiple systems find it challenging to monitor all data. Therefore, anomaly detection models can offer a viable solution.
Throughout the literature, various algorithms for anomaly detection and classification have been proposed [7]–[10]. For instance, Ibrahim et al. [7] evaluated the performance of machine learning schemes such as AutoEncoder Long Short-Term Memory, Facebook Prophet, and Isolation Forest for detecting anomalies in PV systems. These models effectively differentiated between healthy and anomalous behaviors of the system, providing valuable insights for decision-making in complex operational environments. Similarly, Zulfaruzi et al. [8] focused on large-scale PV plants and introduced a methodology using K-Means clustering combined with Long Short-Term Memory (LSTM) for detecting anomalies in the predicted electrical current of string modules. The study demonstrated that LSTM outperformed traditional Artificial Neural Networks in accuracy, with lower relative error, making it a viable solution for predictive maintenance of large-scale PV plants at reduced operational costs.
Other studies have also explored innovative methods for anomaly detection in PV systems. Voutsinas et al. [9] proposed a logistic regression model with cross-validation for fault detection on the DC side of PV systems, achieving an accuracy of 97.11%, which is comparable to other approaches in the literature. The model’s low computational cost makes it particularly attractive for smart PV arrays that provide real-time voltage and current measurements from individual cells. Conversely, de Souza Silva et al. [10] utilized supervised machine learning techniques, including an ensemble of Random Forest, K-Nearest Neighbors (k-NN), and inference machines, to detect anomalies in both synthetic and real datasets. However, neither of these applications has been tested on large-scale PV plants. Given that the datasets in large-scale PV plants are significantly larger and typically involve multiple strings, this could complicate their implementation and functionality. Additionally, labeling data in large-scale PV plants for training algorithms poses its own challenges.
This article presents a case study on the use of LSS data in simulations involving two PV plants of different sizes. The study is an extension of the paper presented at COBEP [11], which was invited for journal submission. In the extended version, we have included a large-scale PV plant in addition to the results already presented for a mini-generation plant. Furthermore, a new methodology for anomaly detection in the data from the large-scale PV plant has been proposed. Access to complete datasets, including all relevant variables from large-scale PV plants, is often limited and confidential due to the size of the plant, making this study particularly valuable. This work highlights the importance of using LSS data in PV plants of varying scales, and proposes a methodology for detecting and isolating anomalies (outliers).
The proposed anomaly detection methodology consists of a workflow that uses only two features to classify the data into anomalous and non-anomalous categories. The model combines k-NN with an inference mechanism. Notably, unlike the models presented by Silva [10], this approach does not require pre-labeled data for training.
The first PV plant is a mini-generation installation, a term used in Brazil for systems with capacities up to 3 MWac, while the second is a large-scale PV plant with a capacity of 30 MWac (the power referred to being the portion of the power plant used for the study). A comprehensive dataset was collected from both the LSS and the PV inverters over a one-year period. This data was used as input for PVsyst simulations, which were then compared with actual energy generation data and simulations based on commercial solar databases (CSD). Although CSD data are generally reliable, they can be compiled in various ways and sourced from different providers, resulting in greater variability in energy generation simulations. Moreover, many of these databases use larger time intervals, typically hourly data. As part of the study, the use of LSS data for large PV plants was proposed to detect energy generation anomalies using two features: Plane of Array (POA) irradiance and power (kVA). The scientific and technical contributions were as follows:
-
Integration and Validation of Real-World Data for Enhanced Simulation Accuracy in minigeneration and Large-Scale PV Plants: This work incorporates real-world data from a LSS and PV inverters, emphasizing the importance of using actual data in the analysis and simulation of PV systems. Furthermore, the study validates the accuracy of simulations performed in PVsyst using this data, thereby enhancing the reliability of simulation tools in predicting real-world outcomes.
-
Proposal of a Flow Process with Reduced Features for Anomaly Detection in Large-Scale PV Plants: A flow process is presented using power and POA irradiance as features, aiming to separate the data into non-anomalous and anomalous classes. This process utilizes a combination of k-NN and an inference machine as a distinguishing factor.
II. SOLARIMETRIC DATA
A. Components of solar irradiance
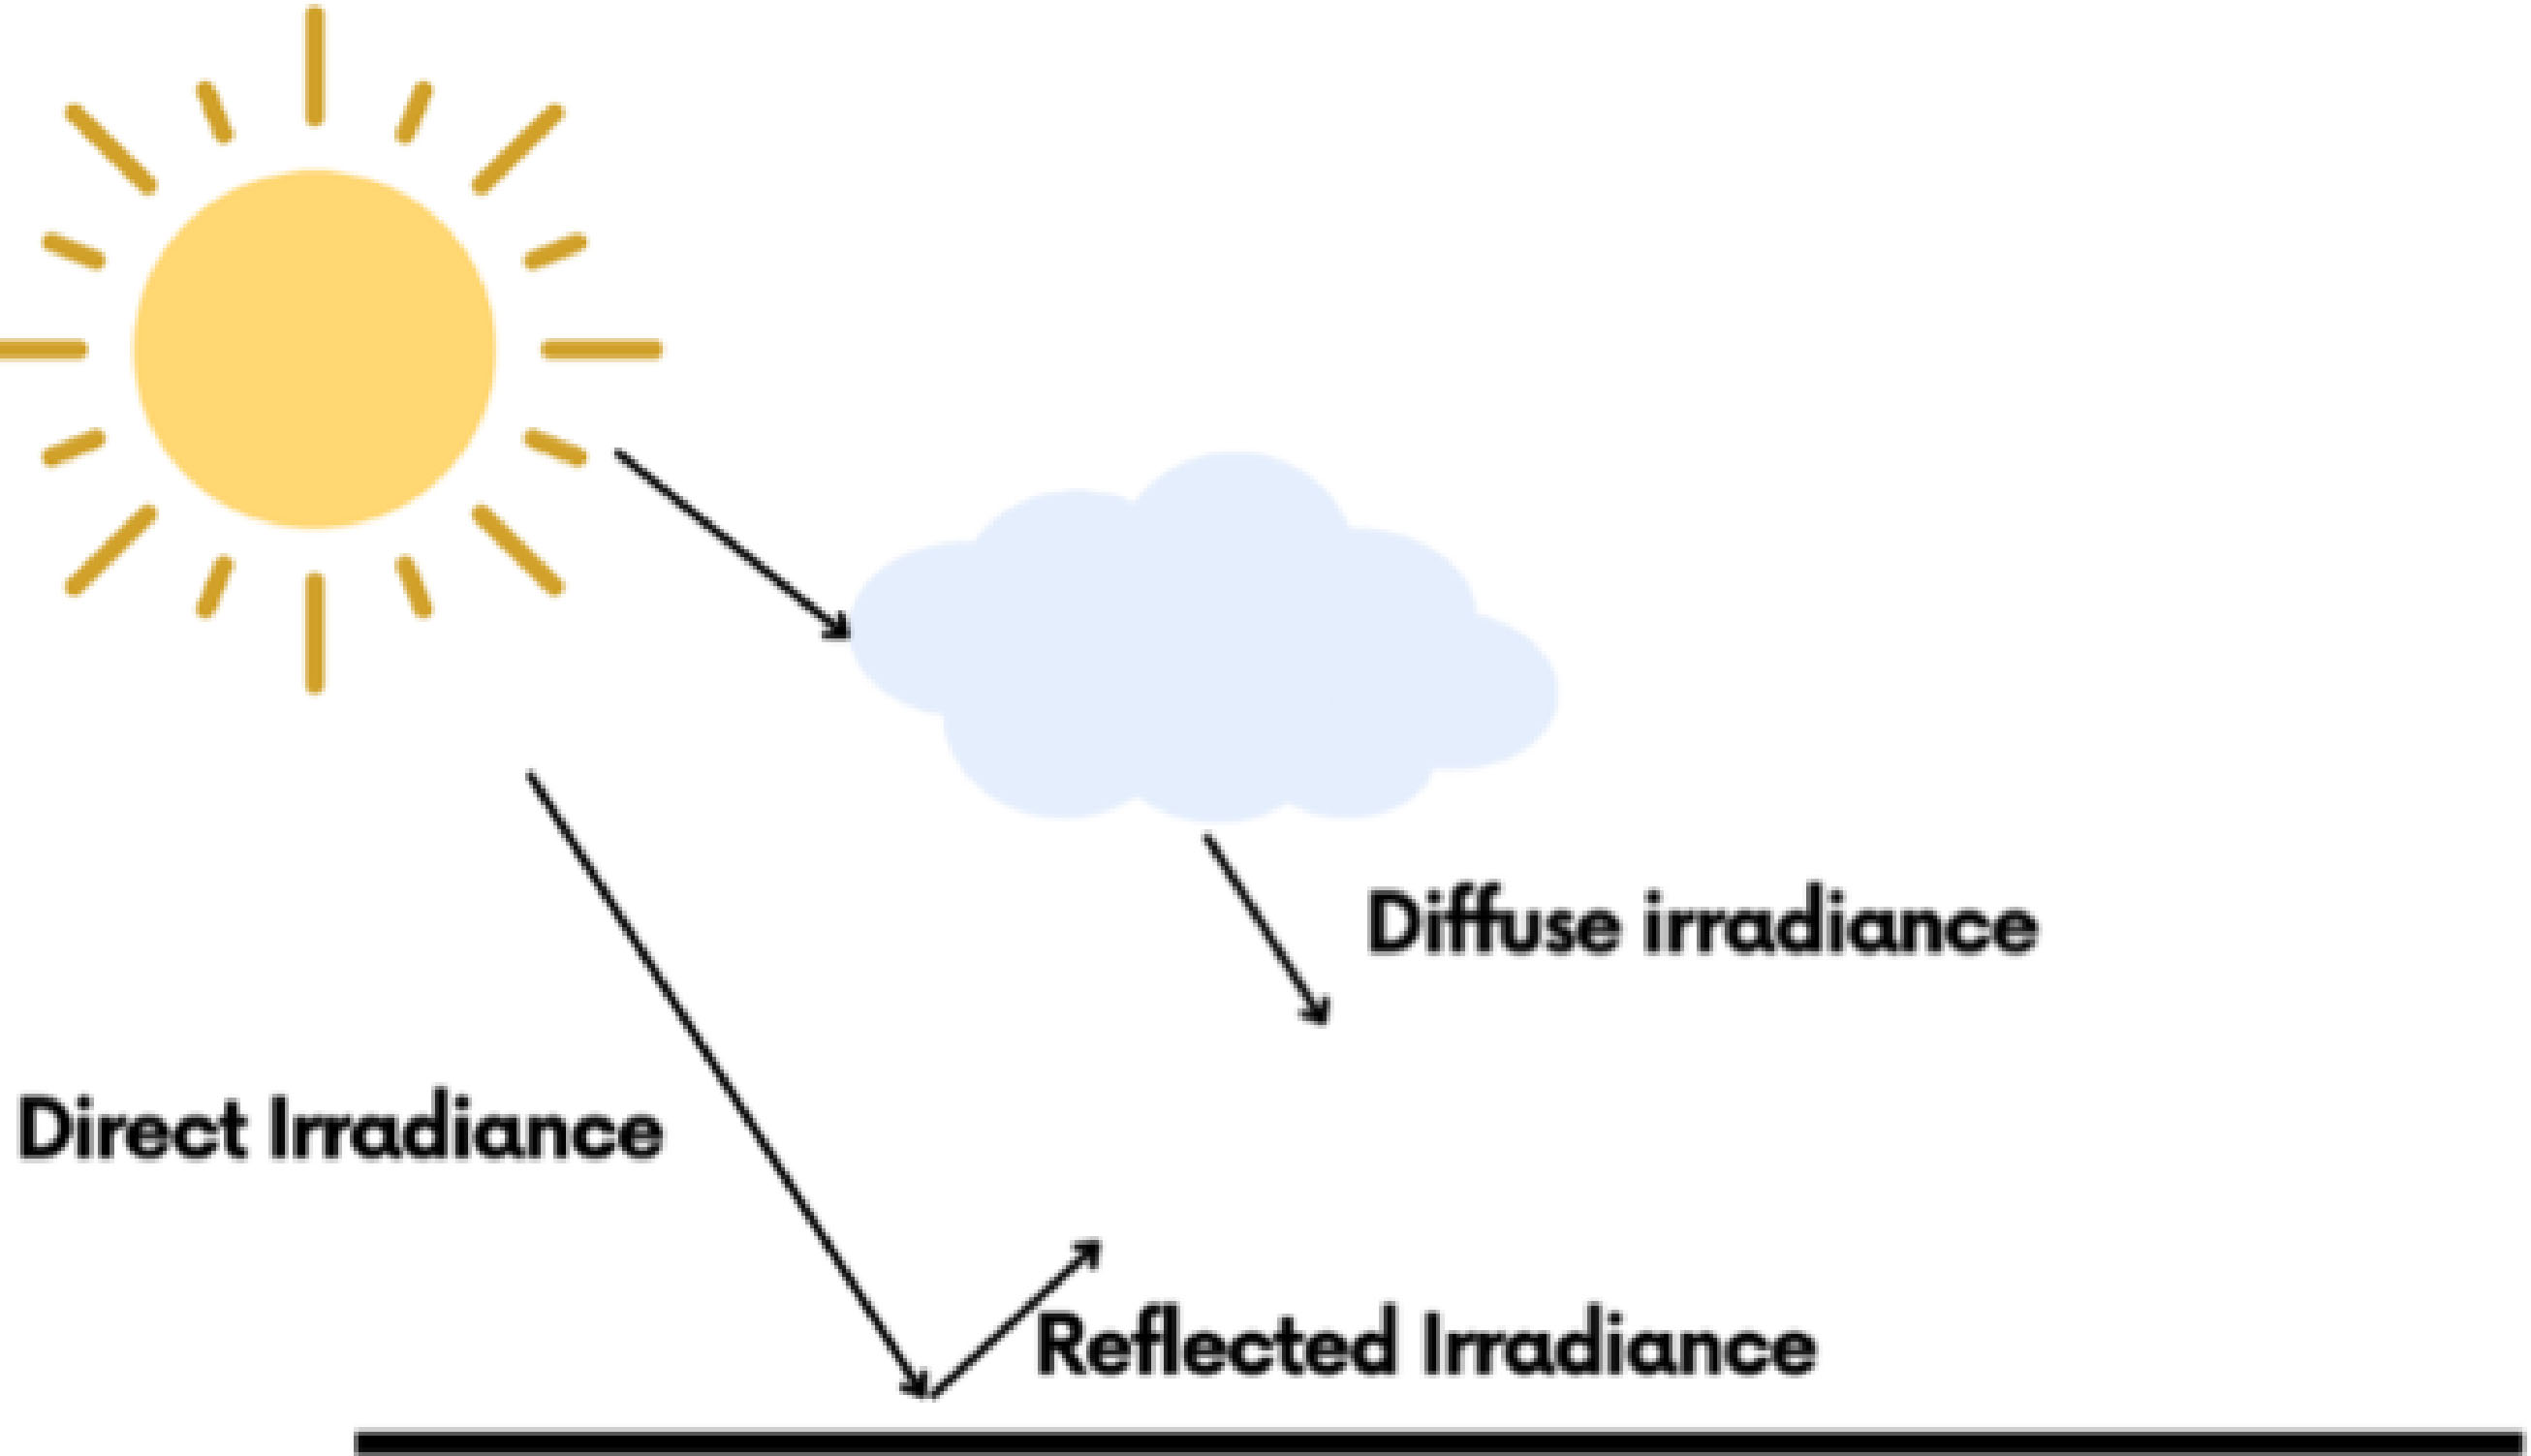
The Fig. 1 showcases the components of solar irradiance. The segment of irradiance that hits the Earth’s surface along the line from the observer to the center of the sun, untouched by external factors such as dust, gasses, clouds, or other particles, is referred to as Direct Normal Irradiance (DNI) [12]. There is also a portion of irradiance that journeys through the atmosphere, undergoing scattering events, for instance by a cloud, which is termed Diffuse Horizontal Irradiance (DHI). The amalgamation of these two, the direct and diffuse horizontal irradiance, results in what is known as the global horizontal irradiance [13].

Knowing this, the global horizontal irradiance can be defined as the aggregate of solar energy that reaches the Earth’s surface, as expressed in Eq. (I). Knowledge of the global (GHI), direct (DNI) and diffuse irradiance (DHI) spectrum incident on the earth’s surface is necessary to understand and analyze the power generation of PV systems [13].
B. Plane of Array (POA) irradiance data
In the context of PV systems, it’s important to convert irradiance from horizontal plane to the POA irradiance, which corresponds to the inclined plane of the PV module. This is because the system is usually tilted at a certain angle to optimize the usage of irradiance, particularly when considering the annual average for fixed systems. Transposition models ascertain the total POA irradiance by computing the individual contributions from direct, ground-reflected diffuse, and sky diffuse components incident on the POA irradiance [14]. One of the classic examples for POA irradiance modeling is the Perez model [15].
C. Solarimetric Station
The solarimetric station used in the tests is shown in the Fig. 2. This station provided the capability for meticulous data collection. Since 2020, it has been possible to collect a full year’s worth of data on PV energy generation as well as solarimetric information.

A solarimetric station is composed by sensors that measure solarimetric and meteorological parameters of the environment, as shown in the Table 1. This data provides important information regarding the performance assessment of PV power plants. The Unicamp Solarimetric Station has two pyranometers, that measure GHI and DHI (measured with a shading plate that follows the sun track and block the DNI), and one pyrheliometer (provides the DNI component from GHI).
The IEC 61724-1 (Photovoltaic System Performance Part 1: Monitoring) [16] is the standard that provides informations about which parameters are needed and how to measure them in a solarimetric station and throughout the PV power plant. This standard classifies the PV monitoring systems between two classes: Class A and B. Both of them measure irradiance, environmental factors and electrical output data, the difference being the types of parameters that need to be measured, the samples and records interval, and the sensors classifications.
The main sensor used in a solarimetric station is the pyranometer, which measures the global solar irradiance on different situations, depending on tilt and position in the field. The pyranometer has three classifications, according to the ISO 9060:2018 [17]: Class A, B and C, going from highest to lowest. The pyranometer used on this study has a Class B classification.
D. POA irradiance modeling
For the minigeneration, in this work, a pyranometer was not installed in the same tilt as the PV modules, because the solarimetric station wasn’t set up for this PV study. Thus, the POA irradiance parameter was calculated, where the horizontal values from irradiance components collected on the solarimetric station were applied. To find the POA irradiance value it’s necessary to sum the three components of irradiance that reach the PV module’s surface [18]: incident beam irradiance (Ib), incident sky diffuse irradiance (Id), and incident ground-reflected irradiance (Ir), as can be seen in Eq. (2).
The software calculated each one of the irradiance components in Eq. (2), according to physical modules, to provide the POA value. To find the Ib, the Eq. (3) was used to transpose the DNI from horizontal plane to PV module surface [18].
The Angle of Incidence (AOI) is the sun incidence angle defined as the angle between beam irradiance and the normal line considering the subarray surface. Eb is the Direct Normal Irradiance (W/\(m^2\)) [18]. For this study, the equation defined to calculate the incident sky diffuse irradiance was from the Perez-Ineichen 1990 model [15], as it can be seen in Eq. (4).
Finally, to provide the Ir, the software applied Eq. (5). The equation is a function of the beam normal irradiance and sun zenith angle, sky diffuse irradiance, and albedo (ground reflectance) [19]:
According to Eq. (5), the Albedo (\( ho\)) is considered being the reflectance property of the material, which makes up the surface through which light is reflected and reaches the module`s surface, \(E_d\) is the diffuse irradiance and \(\beta \) is the subarray surface`s tilt. For more details about albedo selection, the [18] report provides these information.
III. SIMULATION SOFTWARE: PVsyst
To effectively design PV systems and gather comprehensive data for future analyses, simulations are highly recommended. One prevalent software in the industry that aids in such simulations is PVsyst [20]. This software offers the ability to specify equipment, examine potential shading effects, assess various losses, and perform other important studies. To facilitate these simulations, PVsyst incorporates a solarimetric database, usually Meteonorm [21]. However, to enhance the accuracy of these simulations, incorporating site-specific real data, when available, is considered by specialists to be beneficial and advantageous.
IV. METHODOLOGY
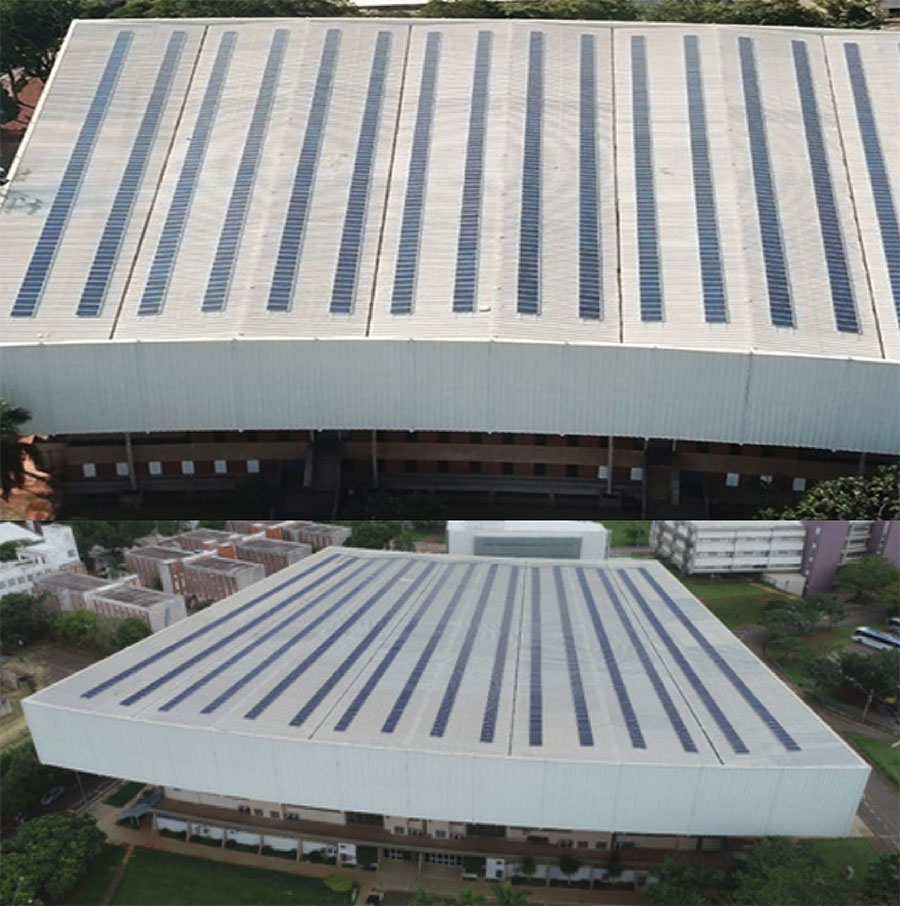
Firstly, for minigeneration, we collected data from the LSS for the year 2020, which included global, direct normal, and diffuse irradiance measurements. The data and installation are part of the Unicamp Sustainable Campus project - “Projeto Campus Sustentável” (see Fig. 3). The collected data was then converted into POA irradiance data format.

In later stage, the LSS data was imported into PVsyst for simulation purposes. This data was compared with the original project’s simulation data, which had been modeled using Meteonorm data. The primary aim of this comparison was to analyze and quantify the discrepancies between the simulated and actual energy production of the PV system, thus enabling a better understanding of the influence and importance of utilizing accurate irradiance data for PV system simulations. The findings from this study stress the significance of harnessing LSS data to boost the precision of PV system simulations and performance evaluations.
The same analysis was subsequently conducted for the large-scale PV plant. The simulation was carried out using real data from 2020 for a plant with a capacity of 30 MWp. The plant is situated in the western region of São Paulo, but its name will remain confidential. Furthermore, only 30 MWp of the plant’s capacity was used in the simulation to avoid disclosing its actual power output. The data previously simulated with CSD was based on PVGIS [22].
Equation (6) was employed for assessing the discrepancy between actual (Yi) and simulated data (ŷi), both on a monthly and annual average scale [20]. The mean absolute error (MAE) and root mean square error (RMSE) [23] were applied for annual comparison. This facilitates a comparison of discrepancy (DS) between the simulated power generation using LSS data or CSD. The calculation of DS MAE and DS RMSE used as reference (Yi) the result with the projected or PVGIS compared to LSS (ŷi).
When evaluating simulations of PV systems, it is important to recognize that absolute values may not adequately reflect the modeling behavior. Simulations may accurately predict certain months while misestimating others, resulting in a balance that can be compensated over time. The analysis of predicted annual generation tends to reveal a lower discrepancy compared to predicted monthly generation [24], as monthly fluctuations are smoothed out, allowing for a more accurate assessment of system performance throughout the year. This approach provides a more balanced view of simulation efficiency, emphasizing the importance of considering longer periods for a proper analysis. However, it is also valuable and insightful to utilize absolute values to understand the behavior in relation to other metrics and variations.
Finally, the data was separated into non-anomalous and anomalous classes for the large PV plant, with the proposal of a streamlined anomaly detection process for large-scale systems utilizing a reduced set of features.
V. RESULTS AND DISCUSSIONS
A. Minigeneration installation at the Unicamp gym
The Table 2 showcases a comparative analysis of the generated energy, the projected output in PVsyst prior to acquisition of the solarimetric data, and the simulation in PVsyst post incorporation of local solarimetric data. When compared to the real data, the simulation with Meteonorm data exhibited a DS of 3.13%, whereas the simulation incorporating local solarimetric data exhibited a significantly lower DS of 0.21%. While both simulations were close to the real data, the performance noticeably improved when solarimetric data collected from an onsite station was utilized in the simulation.
However, when observing the MAE (compared with actual measurements), it is noted that the method used Meteonorm database exhibited slightly better accuracy than the simulation with LSS. On the other hand, the RMSE, which penalizes larger DS, indicated that LSS achieved slightly superior performance.
It is important to note that when conducting a simulation like this, the transformation of data to POA irradiance can introduce DS in the LSS data; however, similar issues can also arise with satellite data. Furthermore, due to the mathematical nature of the model, there are several considerations regarding losses and the interrelationship of variables.
Another point raised by Lindsay et al. [25] highlights a challenge in PV modeling: errors in simulation due to the lack of spectral and angular details. The absence of spectral data can lead to a 5% increase in PV module efficiency, and using only GHI irradiance can result in errors of up to 18%, even in large-scale systems [25]. Consequently, certain months, particularly those with cloudy conditions or significant rainfall, can result in considerable differences in simulations.
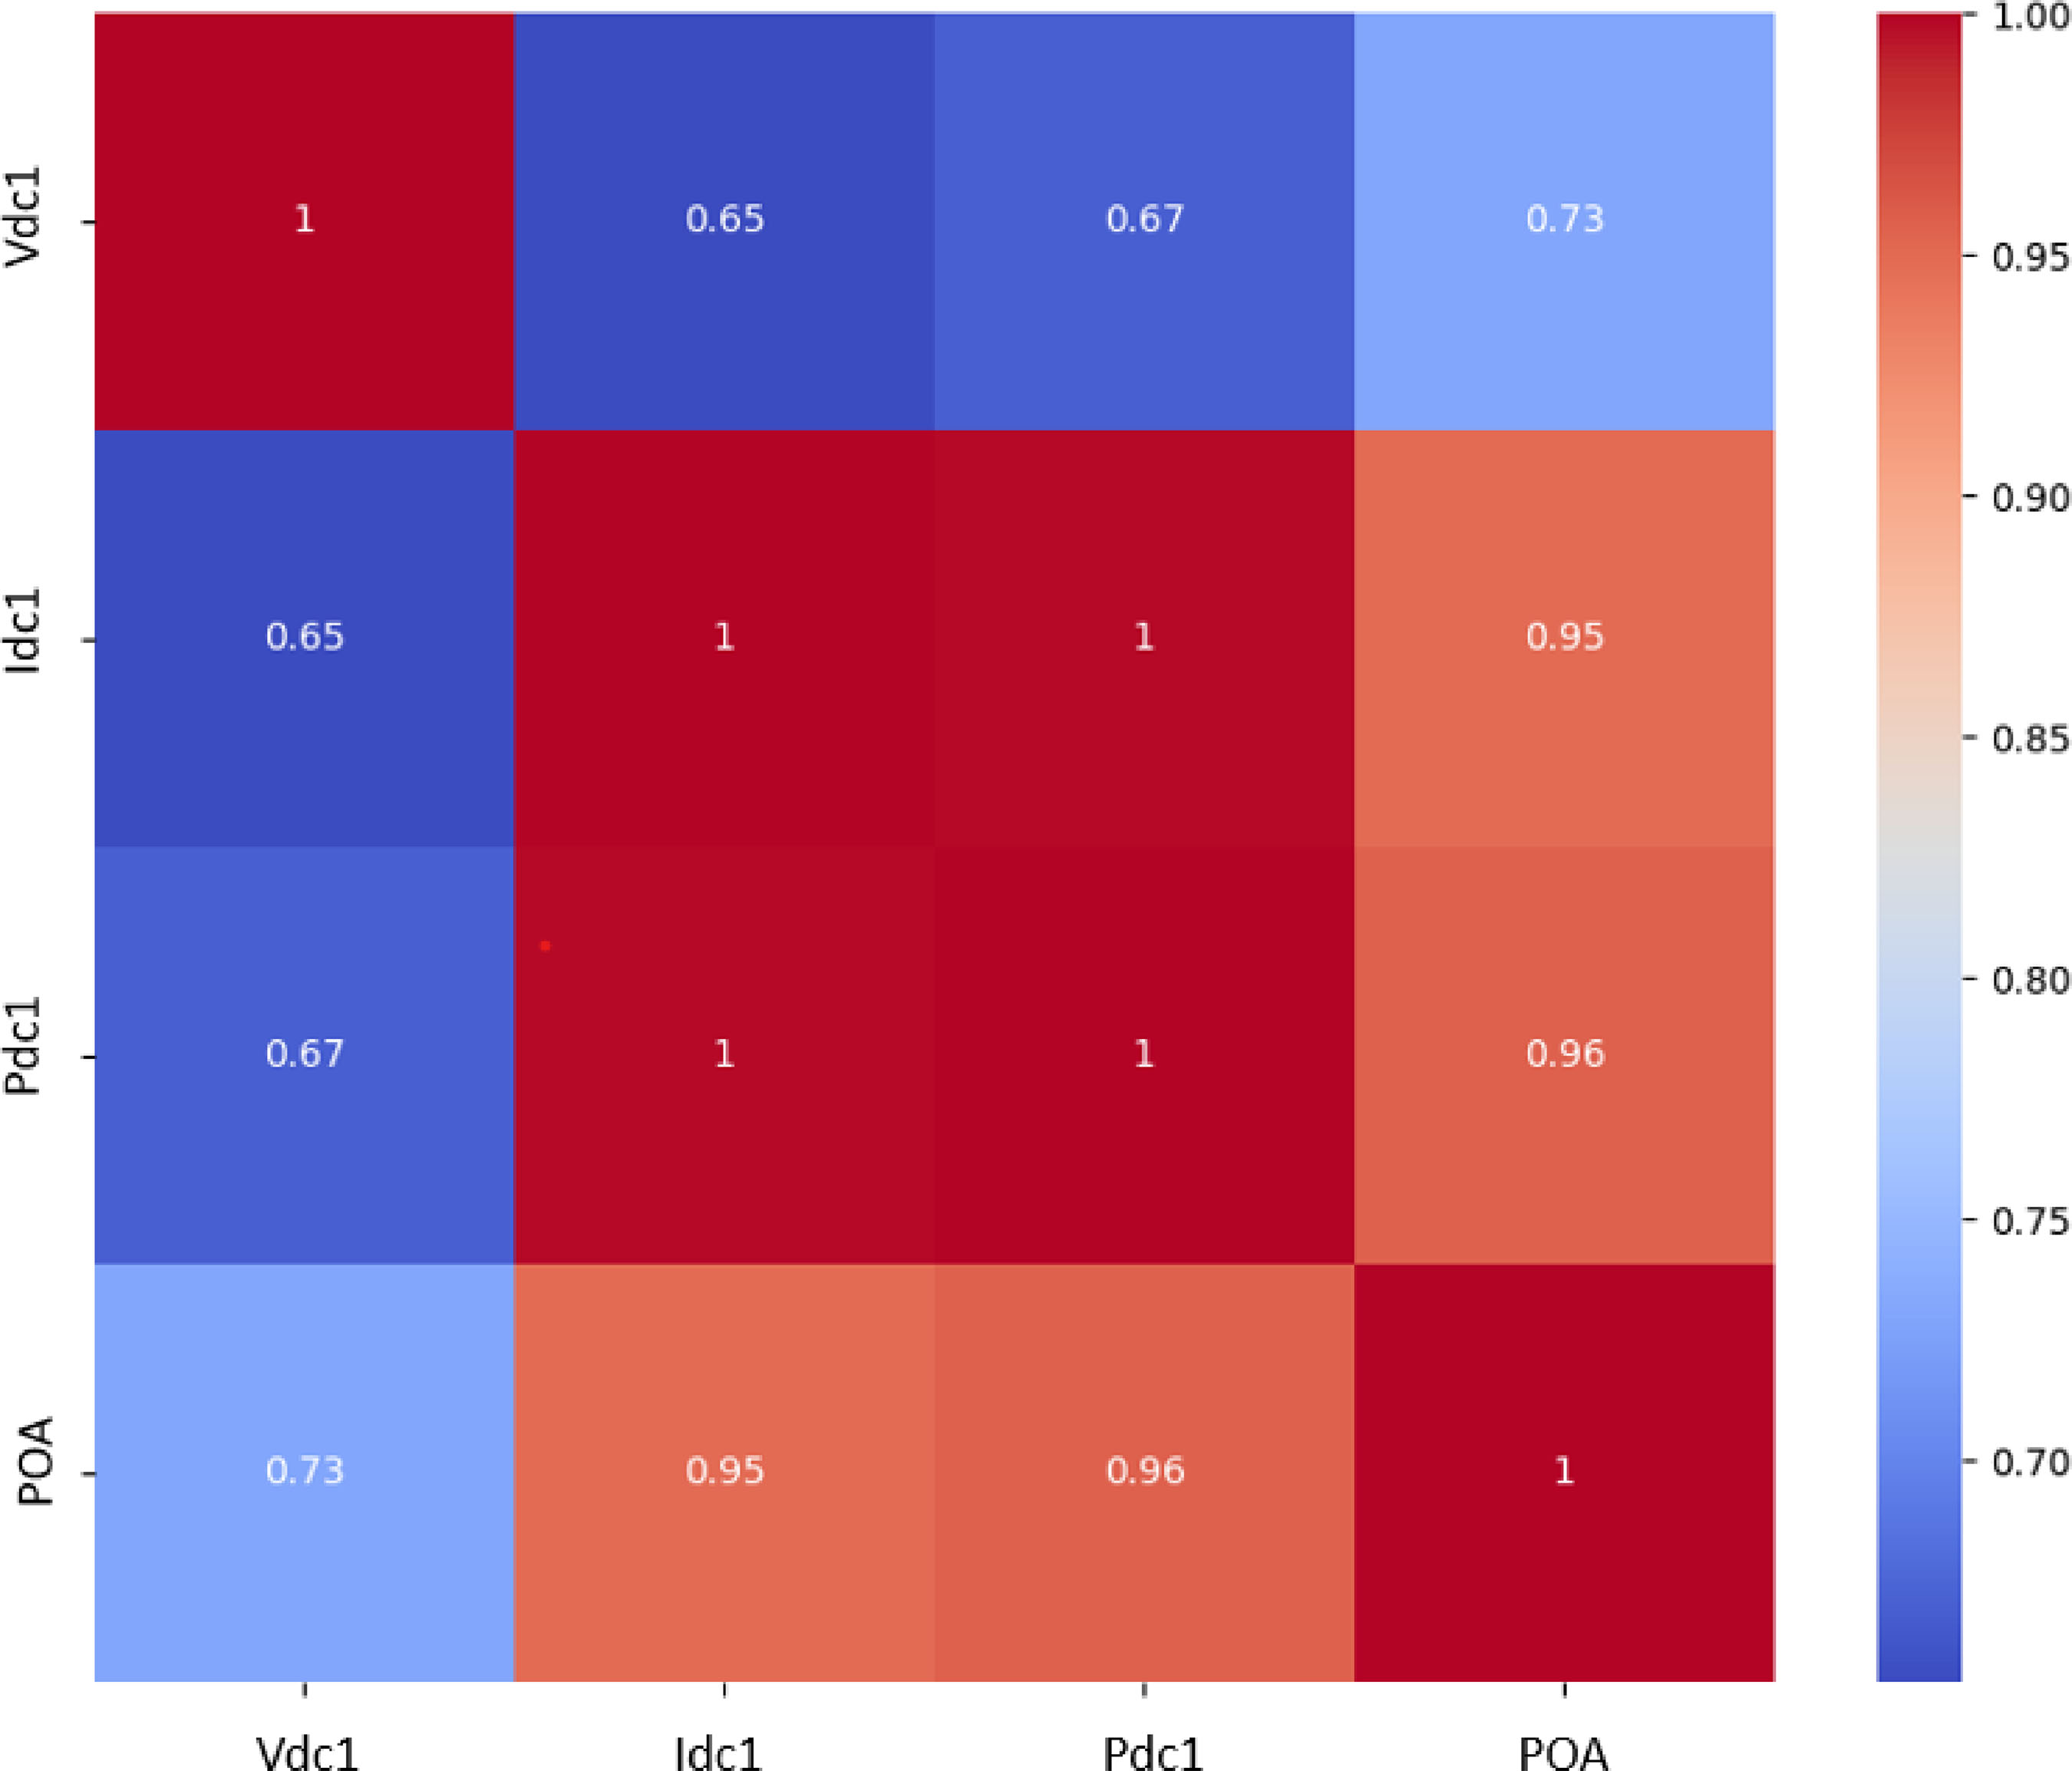
Finally, Pearson correlation was applied between the POA irradiance and the data from the PV inverters at the Unicamp Gymnasium. The matrix was constructed using a 15-minute step for the data. Pearson correlation yields a correlation coefficient that ranges from -1 to 1 [26], [27]. A value of 1 indicates a perfect positive correlation, signifying that both variables increase in perfect proportion. Conversely, a value of -1 indicates a perfect negative correlation, implying that one variable increases as the other decreases. A value close to 0 suggests a weak linear relationship between the variables. The matrix obtained is illustrated in Fig 4. As a result, it was observed that there is a strong positive correlation between POA irradiance and the installation data, confirming the importance of using local data in simulations.


B. Large-Scale Photovoltaic Power Plants
For this plant, the data already measured on the inclined plane was used, eliminating the need for the previously applied conversion. A simulation was conducted using PVsyst 7.4. The meteorology base presents the PVsyst used in PVGIS 5.2. The values of the losses adopted are presented in Table 3.
Table 4 presents the results of the simulations using actual data from the PV Power Plant. The simulation DS was 3.21%, whereas with LSS data, the DS was -5.99%. This indicates that if the large-scale PV data were considered, the system should have delivered more energy than what was actually obtained in 2020.
A noticeable difference can be observed when analyzing the MAE and RMSE between simulations using PVGIS or LSS data for the case. The values indicate that variability is lower when real data is used for the simulation, and the absolute error is also smaller. A distinguishing factor of the LSS data from large-scale PV systems compared to the presented minigeneration system is that POA irradiance values can be obtained directly from the LSS data, including the movements of the trackers.
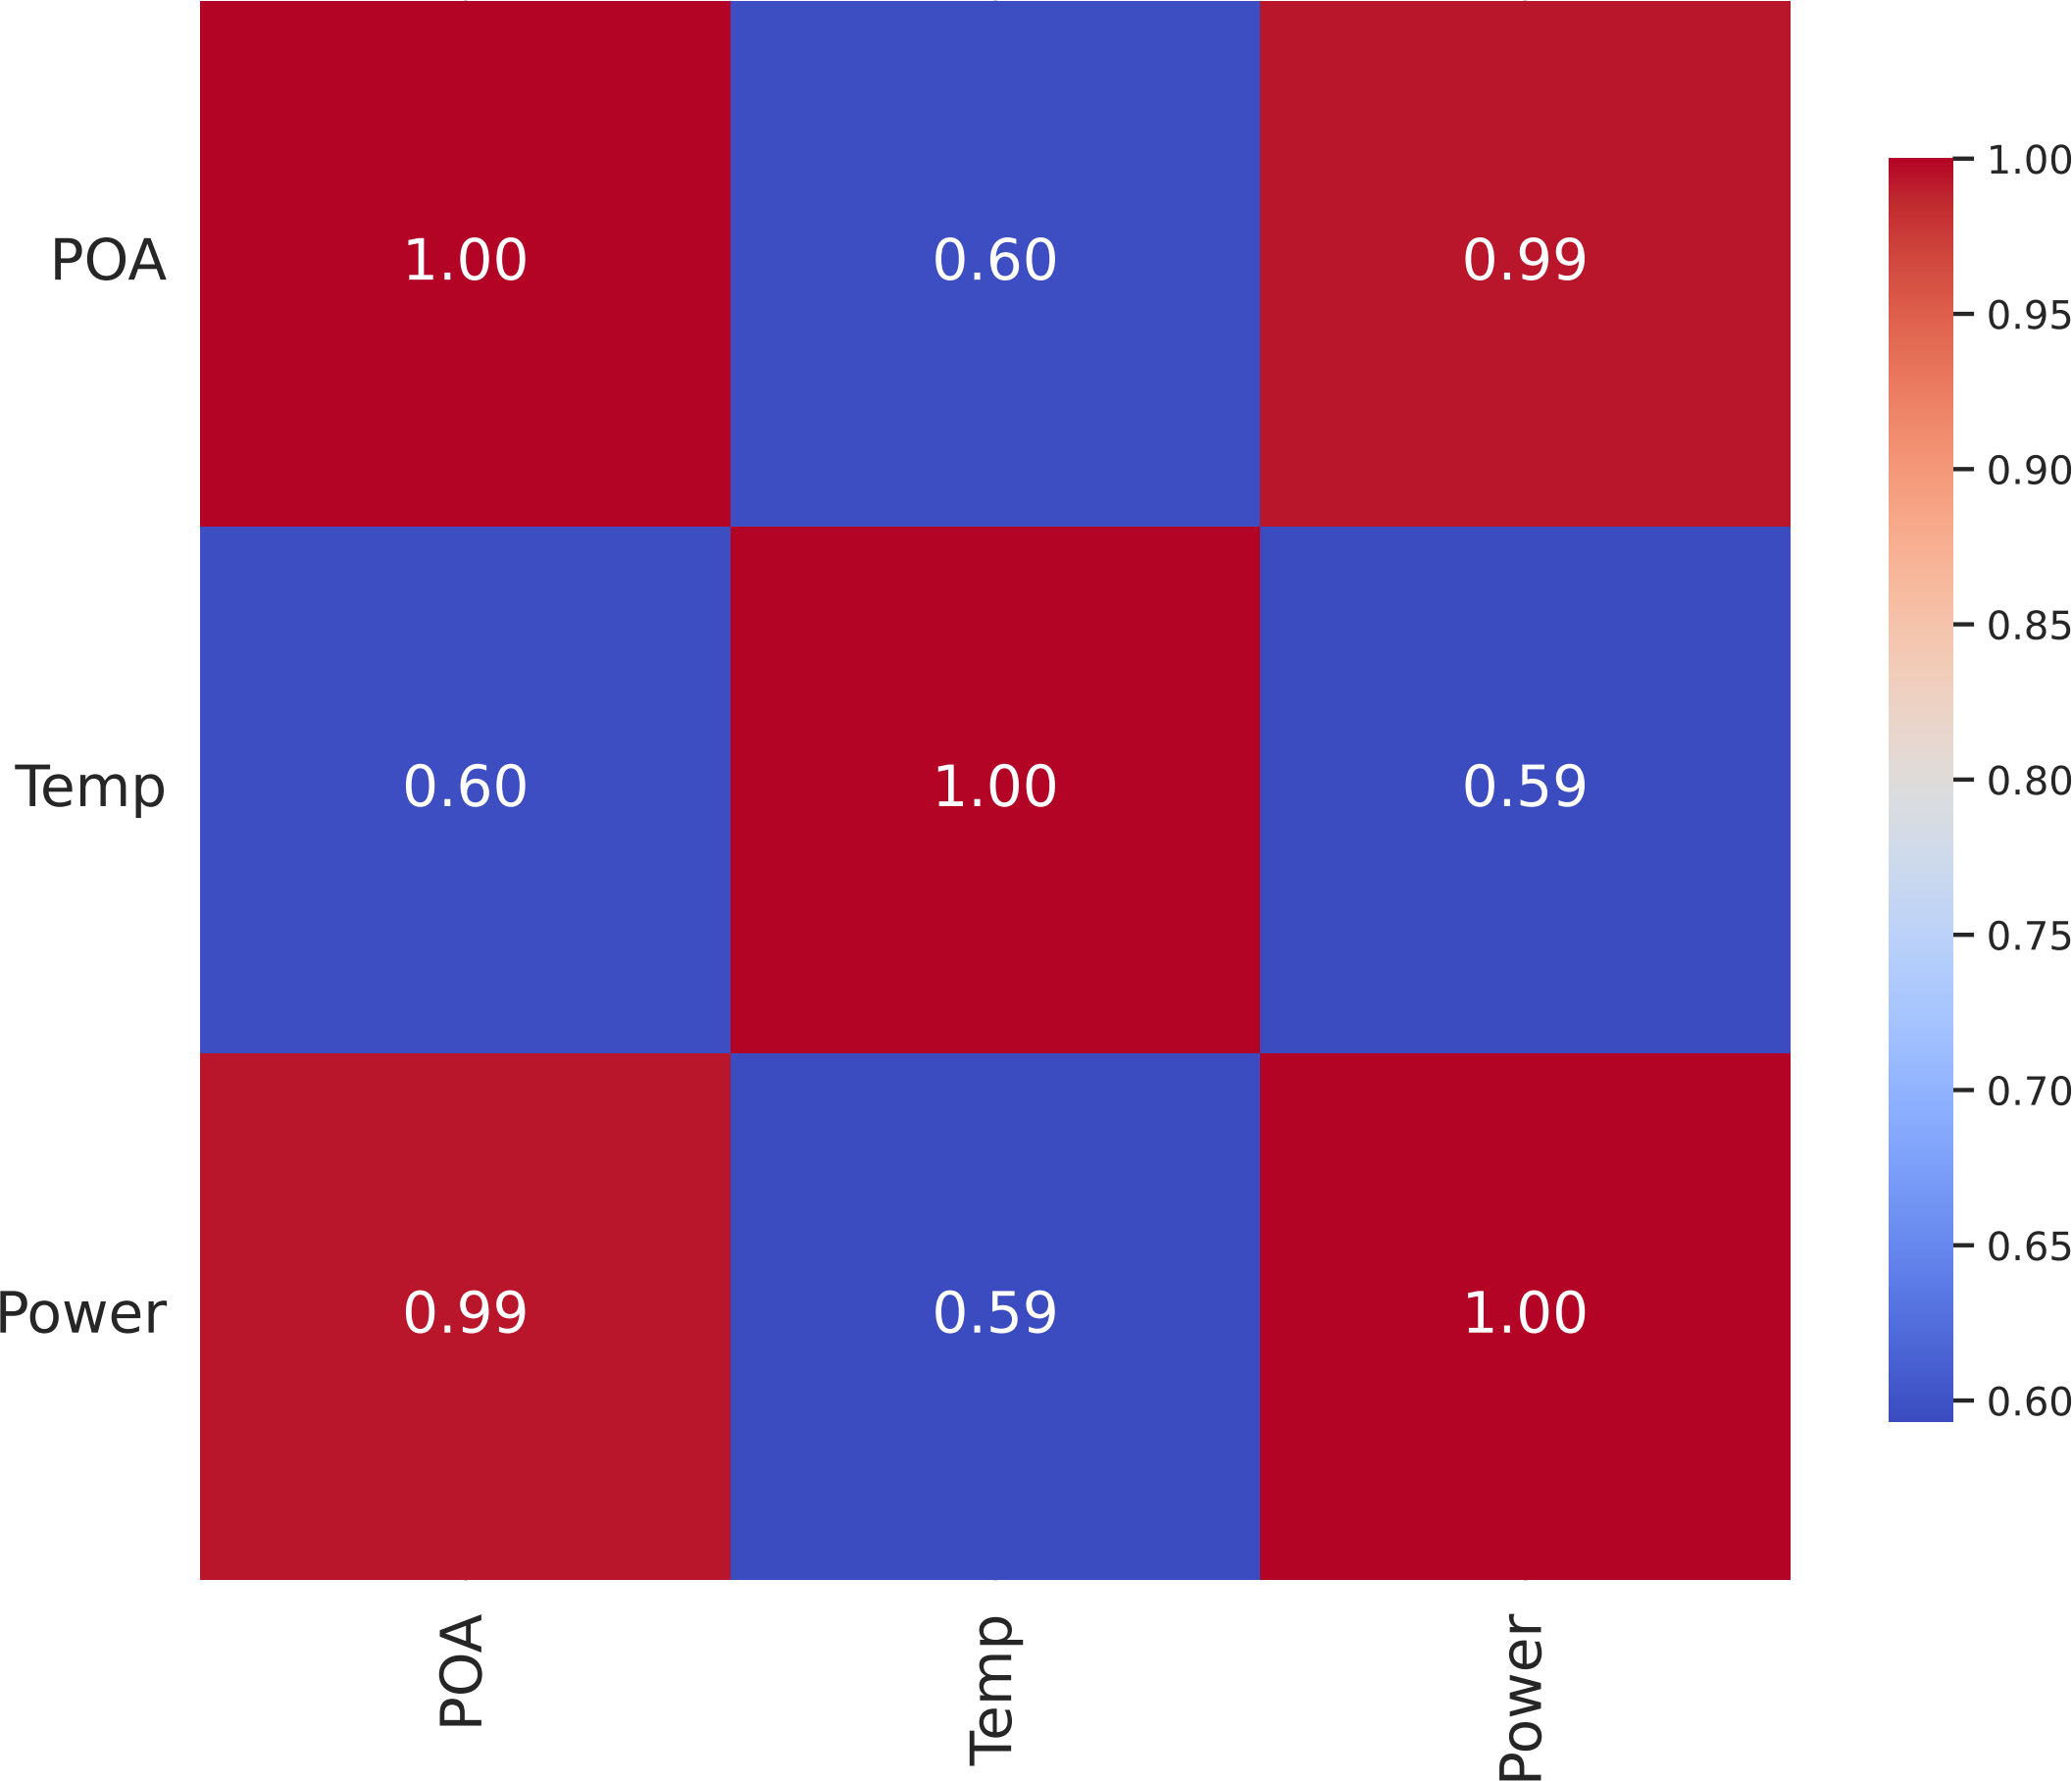
To verify if the correlation between the irradiance and power data was close to 1, a correlation matrix was plotted (see Figure 5). The results showed that indeed the POA irradiance closely follows the power, indicating a strong relationship. Given this correlation and the results obtained from the minigeneration, a smaller DS was expected in the simulation. However, it was detected that in this plant, there was an issue causing the inverters to start later due to cable impedance. Thus, the analysis served to alert to a potential problem in the plant and also confirmed that the POA irradiance has a direct correlation with the voltage. With the same data, an analysis was proposed to separate these moments of anomalies.
C. Anomaly Detection with Threshold Adjustment
The data from the large-scale PV power plant was used to analyze anomaly detection, considering the discrepancies observed in the simulation. In this case, the features included POA irradiance and power in kVA. This approach aligns with the intention of employing a model with reduced features. Anomaly detection is closely tied to the available features for conducting analyses.

The literature shows the application of logistic regression, random forest, decision tree, and ensemble methods using inverter and solarimetric data [10]. Additionally, the use of I-V curve data is observed [28], though this data is challenging for large PV power plants due to its dimensions. Simpler models such as one-class SVM and interquartile range are also explored for anomaly detection using only inverter data [29].
In this paper, we proposed using a method that is mathematically simpler than the set of methods explored in the cited literature and capable of detecting anomalies with just two features: POA irradiance and power (kVA). This approach divides the data into non-anomalous and anomalous subsets. Therefore, a k-NN algorithm [30] was applied, and an inference machine was added to enhance the separation, distinguishing it from existing methods in the literature. The proposed process flow is illustrated in the flowchart shown in Figure 6.
Initially, the data is loaded, and the variables selected as features are separated into a new dataset. Subsequently, linear regression is applied, and a plot is generated showing POA irradiance and power. Linear regression models the relationship between a dependent variable \(y \) and an independent variable \( X \) by fitting a straight line to the data. The equation 7 represents the general form of linear regression, where \( \beta_0 \) is the intercept of the line and \( \beta_1 \) is the slope coefficient. The term \(\hat{y}\) represents the predicted value of \( y \). The coefficients are adjusted to fit the line according to the chosen dataset.
Subsequently, k-NN is applied to separate the data into non-anomalous and anomalous categories. This algorithm involves identifying the \( k \) nearest neighbors to the point that needs to be classified. The Euclidean distance between two points is computed, as described by Equation 8.
For the proposed method, the average of the 5 nearest neighbors was adopted, applying Equation 9. Here, \( d_{ij} \) represents the distance between the \( i \)-th point and the \( j \)-th nearest neighbor, and \( k \) is the number of neighbors, which is 5 in this case.
Next, a threshold for separating the dataset is defined by Equation 10. This threshold is adjusted according to the standard deviation of the data. In this case, the value was set to 3 times the standard deviation after data visualization by an expert observer. Since this is an unsupervised application, i.e., there are no labeled data for validation, which is typically the case in real-world PV plants. Thus, the data, separated into anomalous and non-anomalous categories according to the features and modeling, are selected and passed on to the specialist.
The next step is to apply the inference machine to filter the data separated by the defined threshold. Thus, there may be events where points close to each other are still considered anomalies. These events are defined by Equation 11, resulting in rules-based anomaly (RBA).


Subsequently, the anomalies detected using k-NN are combined with those identified by the RBA detection. Finally, to also eliminate overirradiance anomalies—rare events where irradiance reaches extreme values outside the norm (\( ext{1000 W/m}^2\))—the P95 percentile of the power is added. This process is defined by Equations 12 and 13.
The results obtained are presented in Figures 7 and 8, for Inverter 1 and Inverter 2, respectively. These two inverters were selected for the study because it was known that the first exhibited fewer anomalies while the second had more frequent anomaly events. This observation was confirmed by the results. It is evident that Figure 7 shows fewer anomalies under the inference machine conditions compared to Figure 8. This discrepancy highlighted a major issue contributing to reduced energy generation. Addressing this problem involved inspecting the PV cables, as the inverter was unable to start at specific times despite irradiance levels, and there were alerts for cable impedance values.
The analysis proposed in the article helped identify which inverter was more significantly affected by the problem. If both inverters did not exhibit startup delay anomalies, all the PV inverters together could generate annual outputs exceeding 990 MWh, which would bring the LSS simulation for the large-scale PV system closer to the actual performance, while the CSD would remain further from the actual values. It is important to note that all plants have some degree of unavailability, typically accounted for in simulations at around 2% (the standard in PVsyst [31]). Additionally, while the plant may experience unavailability, generating above contractual values is not problematic; rather, it represents an opportunity for improvement.
Finally, Table 5 presents the amount of data used and categorized into non-anomalous and anomalous. It is evident that Inverter 2 has a higher number of anomalous data points. This occurred because inverter 2 experienced issues on several days that prevented it from starting production. Additionally, the linear regression lines for both inverters are shown. It is important to note that, as indicated by the equations, the threshold and linear regression are dynamic and vary according to the dataset used.
VI. CONCLUSION
This study emphasizes the importance of incorporating LSS data into PV system simulations, as demonstrated through a comprehensive case study. In the minigeneration system, the integration of LSS data led to a slight increase in MAE (from 3.25 MWh to 3.68 MWh, DS MAE -13.23%); however, the RMSE improved slightly, indicating that the model better captured the distribution of DS. This suggests that the real irradiance data introduced minor discrepancies, likely due to factors such as irradiance-to-POA conversion or the lack of spectral corrections. Notably, a strong correlation between LSS data and power output was observed.
In the analysis of a large-scale PV plant, which has measured POA irradiance data, the incorporation of LSS data significantly enhanced simulation accuracy, reducing the MAE from 660.25 MWh (using CSD) to 348.08 MWh with LSS data, thus, a DS of 47.28% was obtained between MAE. Additionally, the RMSE also improved, reflecting a better alignment of predicted values with actual energy generation. These DS values between simulated and actual data can have a significant impact when applied to a large-scale power PV plant, as the energy generation is much higher than in minigeneration.
It is important to note that achieving reliable data correlation is only truly feasible with LSS data, as it is almost synchronized with the actual energy generation. The instantaneous power closely follows the LSS data, although there may be slight delays due to the moving average applied during data acquisition. Therefore, analyses such as anomaly detection would be challenging with CSD, even though it can yield good results for annual averages when collected from high-quality sources, as demonstrated in the results.
Finally, an unsupervised process flow using LSS data and power output was proposed to differentiate non-anomalous data from anomalous data, aiding in future decision-making. This is particularly important given the extensive datasets typically associated with large PV plants.
Acknowledgment
We would like to thank TotalEnergies for the financial support. In addition, we are grateful to all collaborators from University of Campinas (UNICAMP). We acknowledge the support of ANP (Brazilian National Oil, Natural Gas and Biofuels Agency) through the R&D levy regulation. Acknowledgements are extended to the Center for Energy and Petroleum Studies (CEPETRO) and School of Electrical and Computer Engineering (FEEC). The authors would like to thank the Campus Sustainable Project Unicamp for the data. Furthermore, the authors extend their gratitude to the late Professor Marcelo Villalva (1978-2023), foremost figures in the global solar energy scenario, for providing us with all the knowledge and opportunities during our professional engagement.
-
PLAGIARISM POLICY
This article was submitted to the similarity system provided by Crossref and powered by iThenticate – Similarity Check.
REFERENCES
-
1 P. A. Baste, S. R. Jadkar, A. M. Pathak, “Weather Station for Solar PV Power Plant Using Arduino Mega”, in 2021 International Conference on Computer Communication and Informatics (ICCCI), pp. 1–6, 2021, doi: 10.1109/ICCCI50826.2021.9402478.
» https://doi.org/10.1109/ICCCI50826.2021.9402478 -
2 B. K. Fontes Rodrigues, M. Gomes, A. M. Oliveira Santanna, D. Barbosa, L. Martinez, “Modelling and forecasting for solar irradiance from solarimetric station”, IEEE Latin America Transactions, vol. 20, no. 2, pp. 250–258, 2022, doi: 10.1109/TLA.2022.9661464.
» https://doi.org/10.1109/TLA.2022.9661464 -
3 N. Riedel-Lyngskær, M. Ribaconka, M. Po,´ S. Thorsteinsson, A. Thorseth, C. Dam-Hansen, M. L. Jakobsen, “Spectral Albedo in Bifacial Photovoltaic Modeling: What can be learned from Onsite Measurements?”, in 2021 IEEE 48th Photovoltaic Specialists Conference (PVSC), pp. 0942–0949, 2021, doi: 10.1109/PVSC43889.2021.9519085.
» https://doi.org/10.1109/PVSC43889.2021.9519085 -
4 M.-H. Pham, V. M. Phap, N. N. Trung, T. T. Son, D. T. Kien, V. T. Anh Tho, “A Study on the Impact of Various Meteorological Data on the Design Performance of Rooftop Solar Power Projects in Vietnam: A Case Study of Electric Power University”, Energies, vol. 15, no. 19, 2022, doi: 10.3390/en15197149, URL: https://www.mdpi.com/1996-1073/15/19/7149
» https://doi.org/10.3390/en15197149» https://www.mdpi.com/1996-1073/15/19/7149 -
5 M. Ejgar, B. Momin, “Solar plant monitoring system: A review”, in Proceedings of the International Conference on Computing Methodologies and Communication, ICCMC 2017, vol. 2018-January, pp. 1142–1144, 2018, doi: 10.1109/ICCMC.2017.8282652.
» https://doi.org/10.1109/ICCMC.2017.8282652 -
6 M. Aghaei, N. M. Kumar, A. Eskandari, H. Ahmed, A. K. V. de Oliveira, S. S. Chopra, “Chapter 5 Solar PV systems design and monitoring”, in S. Gorjian, A. Shukla, eds., Photovoltaic Solar Energy Conversion, pp. 117–145, Academic Press, 2020, doi: https://doi.org/10.1016/B978-0-12-819610-6.00005-3, URL: https://www.sciencedirect.com/science/article/pii/B9780128196106000053
» https://doi.org/10.1016/B978-0-12-819610-6.00005-3» https://www.sciencedirect.com/science/article/pii/B9780128196106000053 -
7 M. Ibrahim, A. Alsheikh, F. M. Awaysheh, M. D. Alshehri, “Machine Learning Schemes for Anomaly Detection in Solar Power Plants”, Energies, vol. 15, no. 3, pp. 1–17, 2022, doi: 10.3390/en15031082.
» https://doi.org/10.3390/en15031082 -
8 I. A. Zulfauzi, N. Y. Dahlan, H. Sintuya, W. Setthapun, “Anomaly detection using K-Means and long-short term memory for predictive maintenance of large-scale solar (LSS) photovoltaic plant”, Energy Reports, vol. 9, pp. 154–158, 2023, doi: https://doi.org/10.1016/j.egyr.2023.09.159, URL: https://www.sciencedirect.com/science/article/pii/S2352484723013999, the 8th International Conference on Sustainable and Renewable Energy Engineering.
» https://doi.org/10.1016/j.egyr.2023.09.159» https://www.sciencedirect.com/science/article/pii/S2352484723013999 -
9 S. Voutsinas, D. Karolidis, I. Voyiatzis, M. Samarakou, “Development of a machine-learning-based method for early fault detection in photovoltaic systems”, Journal of Engineering and Applied Science, vol. 70, no. 1, pp. 0–17, 2023, doi: 10.1186/s44147-023-00200-0, URL: https://doi.org/10.1186/s44147-023-00200-0
» https://doi.org/10.1186/s44147-023-00200-0» https://doi.org/10.1186/s44147-023-00200-0 -
10 J. L. de Souza Silva, E. Mahmoudi, R. R. M. Carvalho, T. A. dos Santos Barros, “Classification of anomalies in photovoltaic systems using supervised machine learning techniques and real data”, Energy Reports, vol. 11, pp. 4642–4656, 2024, doi: https://doi.org/10.1016/j.egyr.2024.04.040, URL: https://www.sciencedirect.com/science/article/pii/S2352484724002488
» https://doi.org/10.1016/j.egyr.2024.04.040» https://www.sciencedirect.com/science/article/pii/S2352484724002488 -
11 J. L. De Souza Silva, J. A. F. G. Da Silva, E. Mahmoudi, J. F. S. De Paula, T. A. Dos Santos Barros, M. G. Villalva, “Evaluating the Significance of Solarimetric Data for Photovoltaic System Simulation in a Real-World Case”, in 2023 IEEE 8th Southern Power Electronics Conference and 17th Brazilian Power Electronics Conference (SPEC/COBEP), pp. 1–6, 2023, doi: 10.1109/SPEC56436.2023.10407437.
» https://doi.org/10.1109/SPEC56436.2023.10407437 - 12 Z. Şen, Solar Energy Fundamentals and Modeling Techniques: Atmosphere, Environment, Climate Change and Renewable Energy, Springer, London, UK, 2008.
- 13 M. K. da Silva, Estudo de modelos matematicos para an´ alise dá radiaçao solar e desenvolvimento de ferramenta para modelagem e˜ simulaçao de sistemas fotovoltaicos˜ , Master’s thesis, Fac. de Eng. Eletrica e de Computaçao, Universidade Estadual de Campinas, Camp-˜ inas, SP, Brazil, 2019, (in Portuguese).
- 14 M. Lave, W. Hayes, A. Pohl, C. W. Hansen, “Evaluation of Global Horizontal Irradiance to Plane-of-Array Irradiance Models at Locations Across the United States”, IEEE Journal of Photovoltaics, vol. 5, no. 2, pp. 597–606, March 2015.
- 15 R. Perez, P. Ineichen, R. Seals, J. Michalsky, R. Stewart, “Modeling daylight availability and irradiance components from direct and global irradiance”, Solar Energy, vol. 44, no. 5, pp. 271–289, 1990.
-
16 I. E. Commission, IEC 61724-1: Photovoltaic system performance monitoring Guidelines for measurement, data exchange and analysis Part 1: Grid-connected systems, Geneva, Switzerland, 2017, URL: https://www.iec.ch/standards/62873
» https://www.iec.ch/standards/62873 -
17 I. O. for Standardization, ISO 9060:2018 Solar energy Specification and classification of instruments for measuring hemispherical solar and direct solar radiation, Geneva, Switzerland, 2018, URL: https://www.iso.org/standard/75159.html
» https://www.iso.org/standard/75159.html -
18 P. Gilman, SAM Photovoltaic Model Technical Reference, National Renewable Energy Laboratory, May 2015, URL: https://www.nrel.gov/ docs/fy15osti/64102.pdf
» https://www.nrel.gov/ docs/fy15osti/64102.pdf - 19 B. Liu, R. Jordan, “A Rational Procedure for Predicting The Long-term Average Performance of Flat-plate Solar-energy Collectors”, Solar Energy, vol. 7, no. 3, pp. 53–74, 1963.
- 20 J. L. de Souza Silva, K. B. de Melo, K. V. dos Santos, E. Y. Sako,ˆ M. K. da Silva, H. S. Moreira, G. B. Archilli, J. G. I. Cypriano, R. E. Campos, L. C. P. da Silva, M. G. Villalva, “Case study of photovoltaic power plants in a model of sustainable university in Brazil”, Renewable Energy, vol. 196, pp. 247–260, 2022.
-
21 Meteonorm, “Meteonorm”, Accessed: 2024-07-23, 2024, URL: https://meteonorm.com/en/
» https://meteonorm.com/en/ -
22 European Commission, “Photovoltaic Geographical Information System (PVGIS)”, Accessed: 2024-07-23, 2024, URL: https://joint-research-centre.ec.europa.eu/photovoltaic-geographicalinformation-system-pvgis en.
» https://joint-research-centre.ec.europa.eu/photovoltaic-geographicalinformation-system-pvgis -
23 C.-J. Huang, P.-H. Kuo, “Multiple-Input Deep Convolutional Neural Network Model for Short-Term Photovoltaic Power Forecasting”, IEEE Access, vol. 7, pp. 74822–74834, 2019, doi: 10.1109/ACCESS.2019.2921238.
» https://doi.org/10.1109/ACCESS.2019.2921238 - 24 E. Lorenzo, Energy Collected and Delivered by PV Modules, Handbook of Photovoltaic Science and Engineering, John Wiley & Sons, 2003.
-
25 N. Lindsay, Q. Libois, J. Badosa, A. Migan-Dubois, V. Bourdin, “Errors in PV power modelling due to the lack of spectral and angular details of solar irradiance inputs”, Solar Energy, vol. 197, pp. 266–278, 2020, doi: https://doi.org/10.1016/j.solener.2019.12.042, URL: https:// www.sciencedirect.com/science/article/pii/S0038092X19312563
» https://doi.org/10.1016/j.solener.2019.12.042» https:// www.sciencedirect.com/science/article/pii/S0038092X19312563 - 26 W. Hardle, L. Simar, Applied Multivariate Statistical Analysis, 2nd ed., Springer, 2007.
-
27 W. J. Wu, Y. Xu, “Correlation analysis of visual verbs’ subcategorization based on Pearson’s correlation coefficient”, 2010 International Conference on Machine Learning and Cybernetics, ICMLC 2010, vol. 4, no. July, pp. 2042–2046, 2010, doi: 10.1109/ICMLC.2010.5580507.
» https://doi.org/10.1109/ICMLC.2010.5580507 -
28 S. Voutsinas, D. Karolidis, I. Voyiatzis, M. Samarakou, “Development of a multi-output feed-forward neural network for fault detection in Photovoltaic Systems”, Energy Reports, vol. 8, pp. 33– 42, 2022, doi: https://doi.org/10.1016/j.egyr.2022.06.107, URL: https://www.sciencedirect.com/science/article/pii/S2352484722012483, technologies and Materials for Renewable Energy, Environment and Sustainability.
» https://doi.org/10.1016/j.egyr.2022.06.107» https://www.sciencedirect.com/science/article/pii/S2352484722012483 -
29 M. M. Cavalcante, J. L. De Souza Silva, S. B. Martins, I. F. Silva Nunes, A. C. Ribeiro, T. A. Dos Santos Barros, “Comparison and Application of Data Science Techniques for Anomaly Detection in Photovoltaic Systems”, in 2023 IEEE 8th Southern Power Electronics Conference and 17th Brazilian Power Electronics Conference (SPEC/COBEP), pp. 1–5, 2023, doi: 10.1109/SPEC56436.2023.10408037.
» https://doi.org/10.1109/SPEC56436.2023.10408037 -
30 S. R. Madeti, S. Singh, “Modeling of PV system based on experimental data for fault detection using kNN method”, Solar Energy, vol. 173, pp. 139–151, 2018, doi: https://doi.org/10.1016/j.solener.2018.07.038, URL: https://www.sciencedirect.com/science/article/pii/S0038092X18307023
» https://doi.org/10.1016/j.solener.2018.07.038» https://www.sciencedirect.com/science/article/pii/S0038092X18307023 -
31 PVSyst, “Unavailability Loss”, Accessed: 2024-10-28, 2024, URL: https://www.pvsyst.com/help/unavailability loss.htm
» https://www.pvsyst.com/help/unavailability loss.htm
-
Associate Editor
Mokhtar A. Ahmed https://orcid.org/0000-0002-9236-7840
-
Editor-in-Chief
Heverton A. Pereira https://orcid.org/0000-0003-0710-7815