Electronic Load for Parameter Characterization in Equivalent Circuit Models of Lithium-Ion Batteries
ABSTRACT
The applications and implemented volume of lithium-ion batteries have been gaining momentum each year. Aiming to contribute to the development of research in this area, this paper presents the design and implementation of an electronic load focused on characterizing parameters inherent to equivalent circuit models (ECM). ECMs are commonly applied for estimating the State of Charge (SoC), State of Health (SoH), and Remaining Useful Life (RUL) of lithium batteries. In this paper, an electrical design of an electronic load was implemented and validated through laboratory instrumentation to obtain characteristic data from a lithium titanate cell. The data from the tests performed on the cell were used as input for a SoC estimation algorithm based on the Extended Kalman Filter (EKF) to help corroborate the prototype's performance. The results comprise the performance of the electronic load, the results associated with the parameterization tests of the lithium cells, and the results obtained for the cell’s SoC estimation using the EKF.
KEYWORDS
Electronic Load; Parameter Characterization; Equivalent Circuit Models; State of Charge; Extended Kalman Filter
I. INTRODUCTION
Lithium-ion batteries dominate portable device technology [1] and play a key role in electric vehicles and energy systems [2], [3]. Proper energy management is essential for their operation, relying on modeling techniques to estimate key parameters from voltage, current, and temperature measurements [4]. A widely used approach is the Equivalent Circuit Model (ECM), which employs lookup tables derived from experimental electrical tests [5], [6] using battery cyclers.
Electrical tests during the charging stage need to occur with controlled current profiles, either by DC source or by a power converter with a wide current range (from milliamperes to hundreds of amperes). Similarly, the discharge must follow controlled profiles to ensure the effectiveness of the tests [7], and [8].
Controlled discharge profiles can be generated by power resistors, DC-DC converters, or electronic loads. However, given the wide power range involving low voltages of battery cells, the control and precision involved in discharges become a challenge in high-power dissipation. Additionally, there is the challenge of presenting a rapid charge current rate of change (dI/dt), with precise adjustable charge current, and the ability to monitor the charge current and voltage with high fidelity [9].
A power resistor, if correctly dimensioned and cooled, can meet the requirement for high power dissipation. However, adjustments for multiple discharge current values are not feasible, and the current rate of change cannot be controlled or adjusted [10].
DC-DC converters that exhibit constant current characteristics at the input, such as BOOST, CÚK, and SEPIC, can function as loads due to the series inductor. The limitation of converters is in their operation, where low voltages are associated with high currents, achieving good performance only for high power dissipation at voltages of 200 V or more, making them suitable only for testing battery banks [11].
The active load circuit is a better solution for tests involving cells compared to a simple switched resistance or DC-DC converters, as an active load can generate variable load currents from zero amps up to maximum current. Additionally, since the current load is controlled by a closed-loop operational amplifier, the current precisely tracks the control signal. Therefore, the active electronic load can achieve controlled current rate variations [9].
Typically, the data used in battery modeling involves carefully conducted tests with commercial electronic loads, in which the instrumentation is added externally [12], [13]. Battery cyclers are employed when greater reliability in test data is required [14], [15], as they have programmable current controllers and instrumentation rigorously designed for this purpose; however, the cost associated with this type of equipment is very high [16], limiting its accessibility for many universities.
This paper proposes an electronic load designed for conducting parameter characterization tests of ECM models using an algorithm based on the Extended Kalman Filter (EKF). Thus, this paper aims to contribute directly to the advancement of studies on estimating the state of charge in lithium-ion batteries by proposing an alternative, lower-cost solution to perform cell characterization tests. The sections II. Battery Model, sections III. EKF Algorithm, sections IV. Electronic Load, V. Electronic Load Performance Results, VI. Battery Cell Parameterization Results, and VII. Conclusions organize the developed article.
II. BATTERY MODEL
Battery SoC is a relative value that represents the proportion of remaining capacity to the current maximum available capacity, as depicted in (1) in discrete form. Here, denotes the current SoC, represents the initial value of SoC, t signifies the sampled time, corresponds to the instantaneous charge current (assumed positive for discharge and negative for charge), denotes the nominal capacity, and k denotes a discrete time point [6].
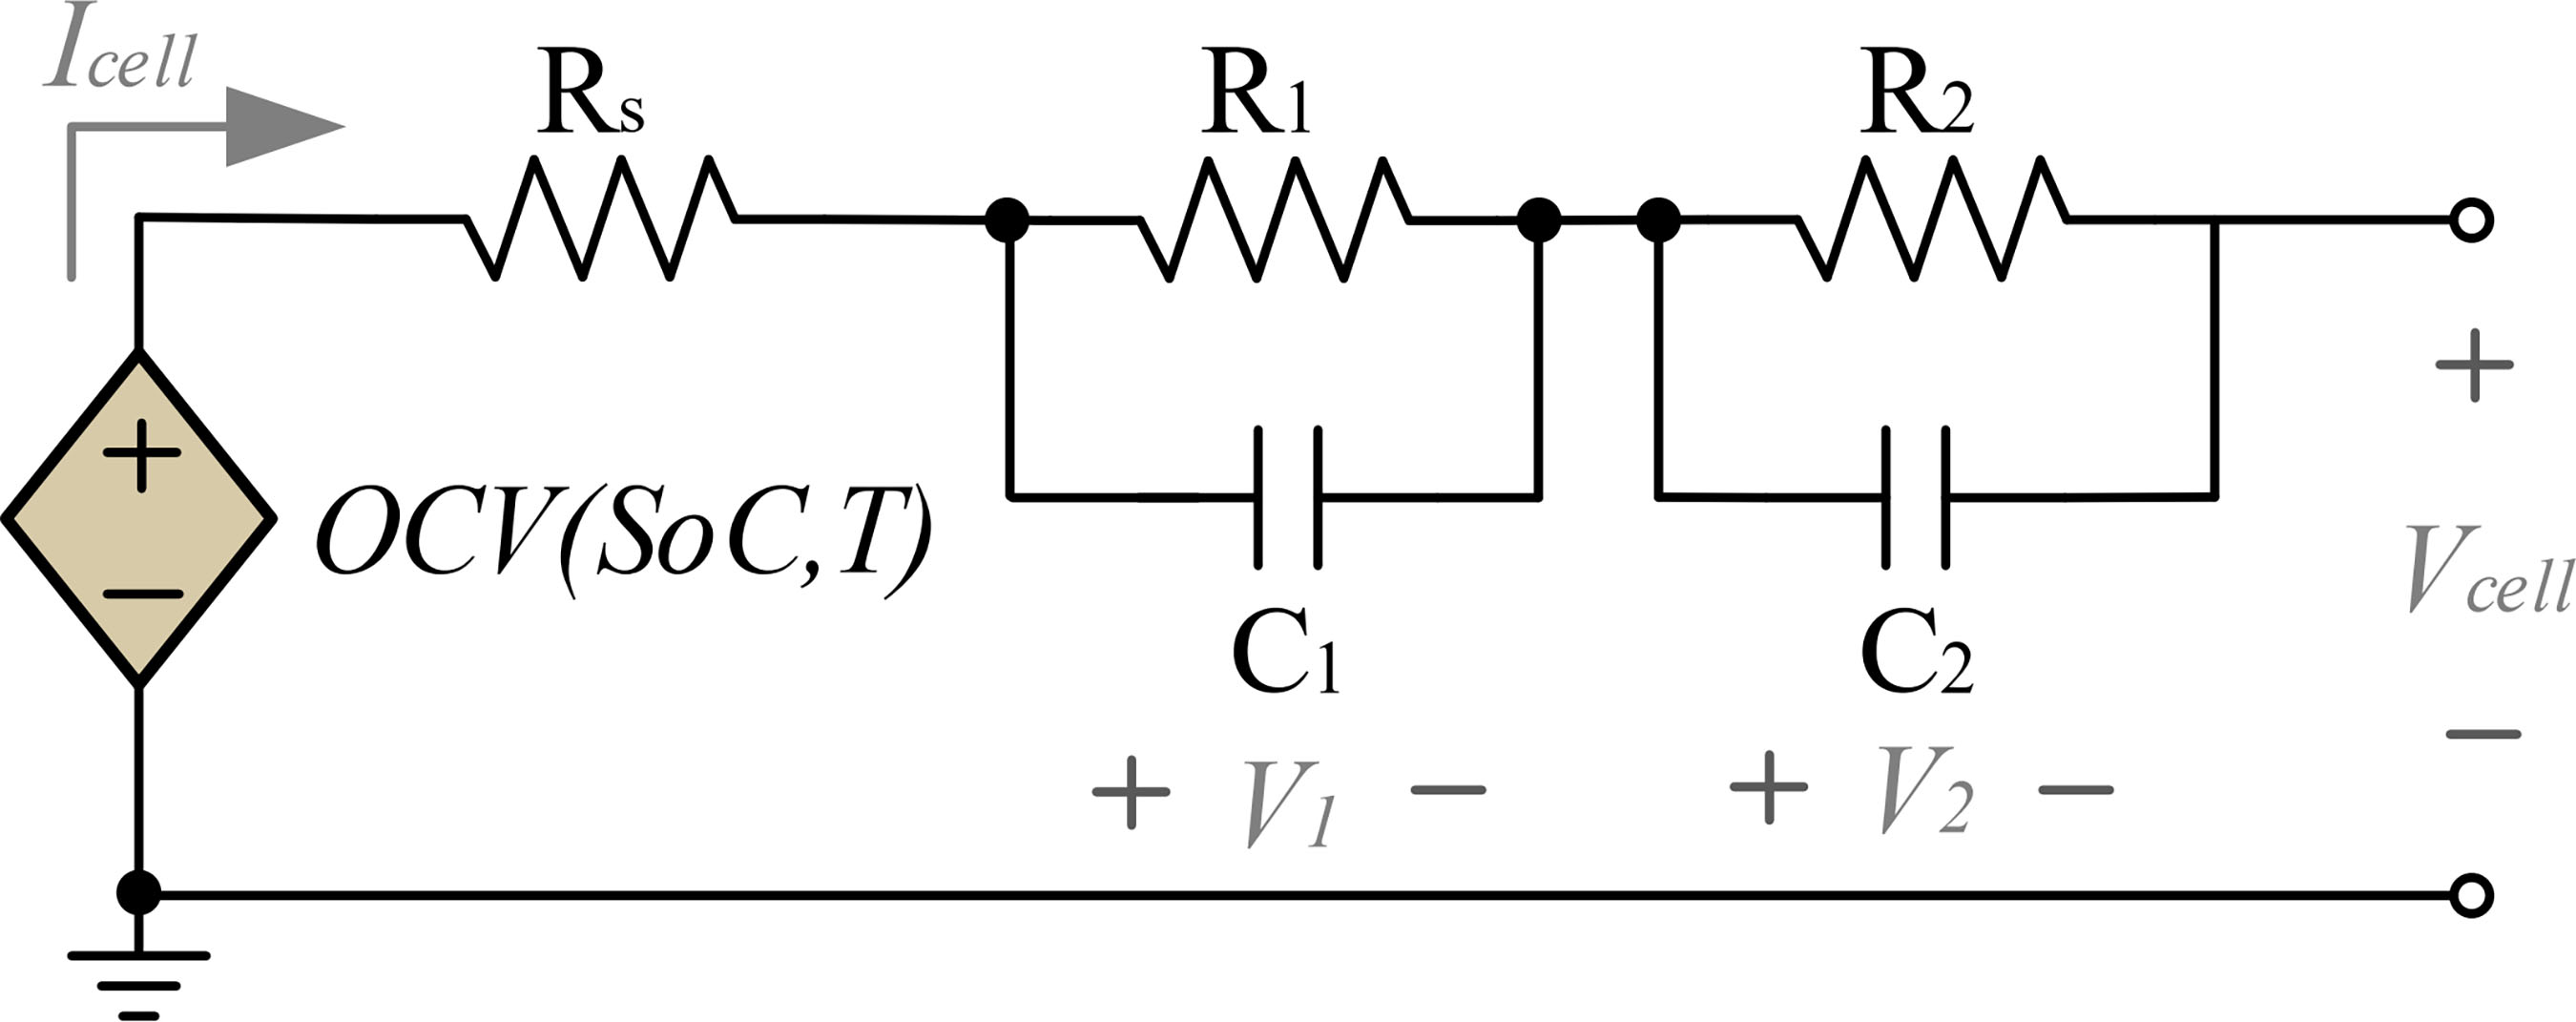
Battery SoC estimation is an estimated measure based on indirect parameters; therefore, the mathematical model describing the battery needs to be highly representative. The model presented by [7] in Fig. 1 aims to establish the dynamic characteristics of the battery using a second-order RC equivalent circuit model, obtained from experimental data to define the parameters: OCV (open-circuit voltage), which is directly related to SoC and T (temperature), Rs (series resistance), R1 (electrochemical polarization resistance), (electrochemical polarization capacitance), (concentration polarization resistance), and (concentration polarization capacitance), are also dependent on SoC and temperature [5].
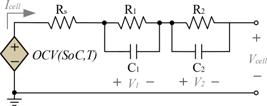
Analyzing the circuit in Fig. 1, we obtain in (2), (3), and (4), where represents the battery terminal voltage, is the discharging current, and and are the voltages across the RC pairs.
With (1), (2), (3) and (4) in discrete state-space form, one can obtain (5) and (6).
Here, and are uncertainty terms inherent to the system, following a normal distribution with zero mean and covariance (an n x n matrix), .
III. EKF ALGORITHM
The Kalman filter comprises a set of mathematical equations that recursively estimate the state of a process to minimize the mean squared error efficiently. The EKF algorithm is a nonlinear version of the Kalman filter that linearizes around the current mean and covariance of the state [17], [18]. It can be described in discrete form as shown in the following equations.
State prediction:
Covariance prediction:
Kalman gain calculation:
Update state:
Update covariance prediction:
Where, is the nonlinear function that describes the system dynamics, is a nonlinear function that relates the state vector to the measurement , is the Jacobian matrix of calculated around the state estimate , is the covariance of the state estimate at time k, is the process noise covariance matrix, is the Jacobian matrix of the observation function , calculated around the state estimate , R is the measurement noise covariance matrix, and I is an identity matrix.
In the EKF, the nonlinear functions and must be linearized around the current state estimate. The Jacobian of the state function is denoted as (12), and the Jacobian of the observation function is denoted as (13).
In this paper, the EKF operates with a sampling rate of 1 second.
IV. ELECTRONIC LOAD
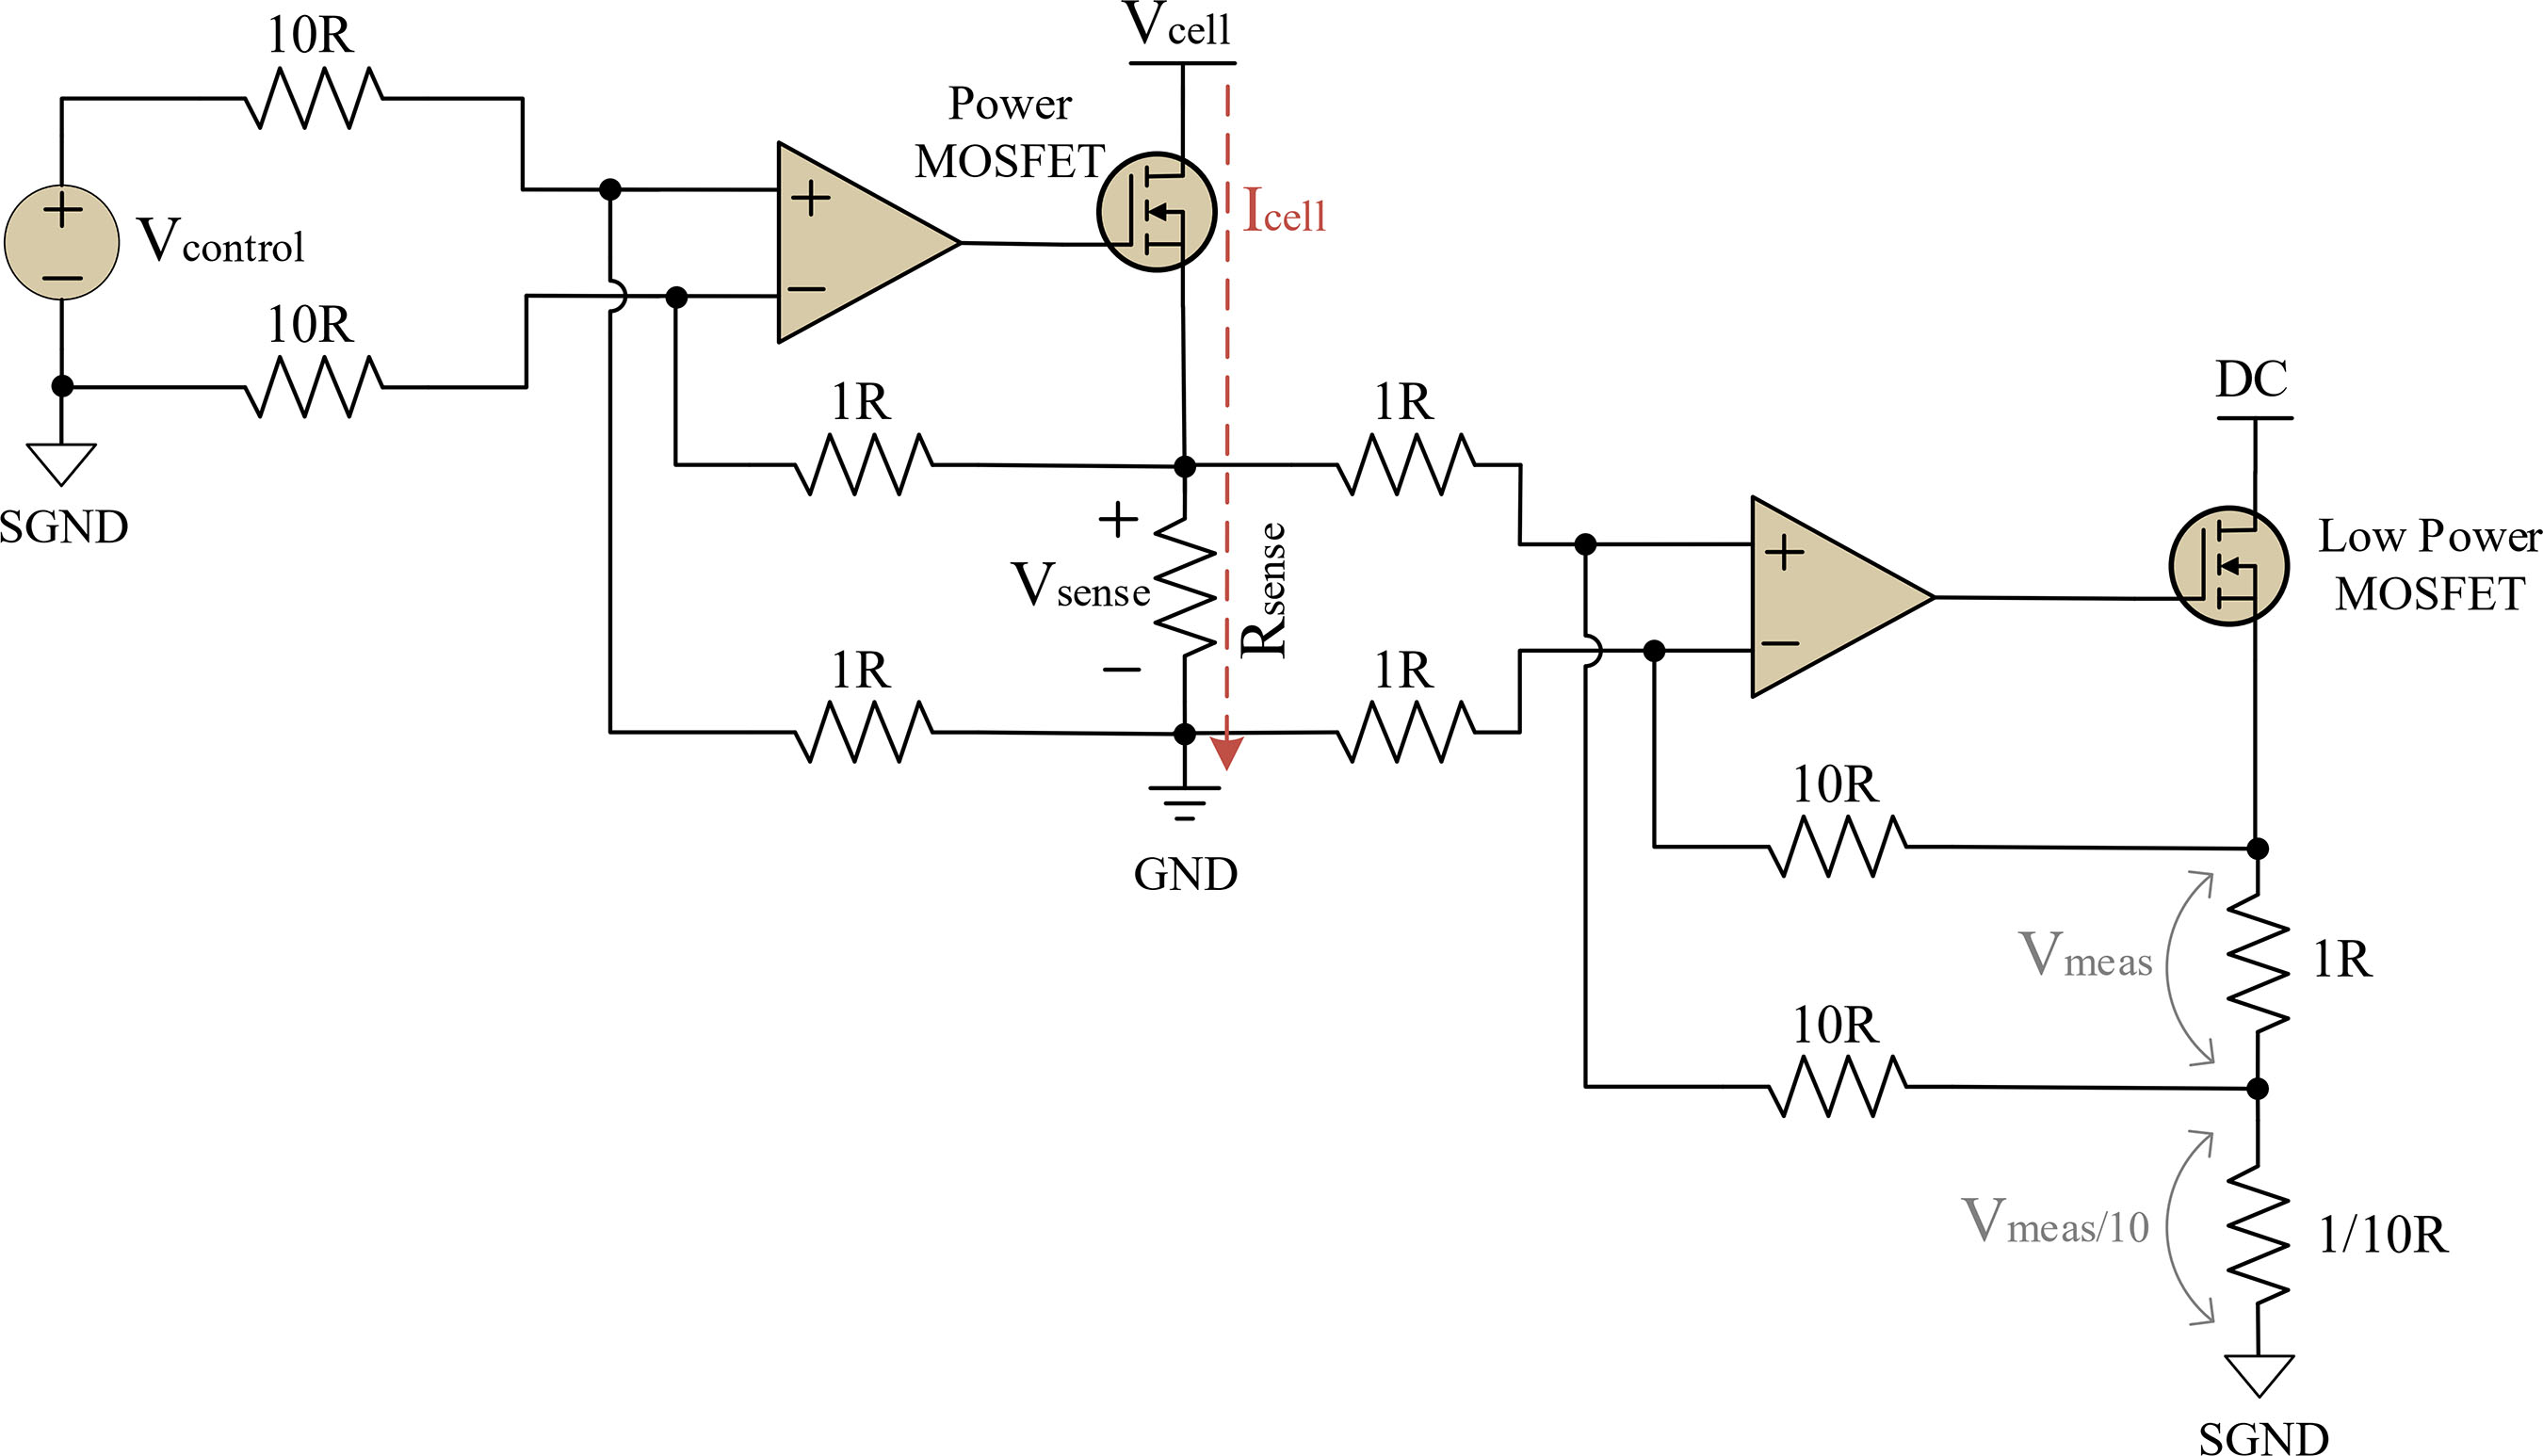
The circuit of the electronic load responsible for controlling the discharges of lithium cells and obtaining their characterization is presented in Fig. 2. This active current-dissipating circuit was developed using a MOSFET operating in the linear region coupled to an operational amplifier. An operational amplifier controls the gate of the MOSFET to establish a controlled voltage across a sense resistor (), thereby creating a controlled discharge current flowing from the drain to the source of the MOSFET and through the sense resistor to ground [9].

Based on the voltage-current characteristics of a MOSFET operating in the linear region, it is understood that for each value of gate-source voltage (), there is only one associated drain current (), independent of the drain-source voltage (). Therefore, operating in this region allows the desired discharge current to be defined regardless of the voltage of the lithium-ion cell. It is important to highlight that a minimum voltage (threshold voltage) needs to be applied for proper operation [19].
The charging current generated by this circuit is proportional to the voltage of a control signal (), with the gain defined by the ratio between the input and gain adjustment resistances, according to (14).
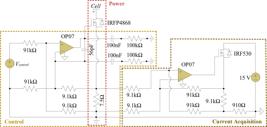
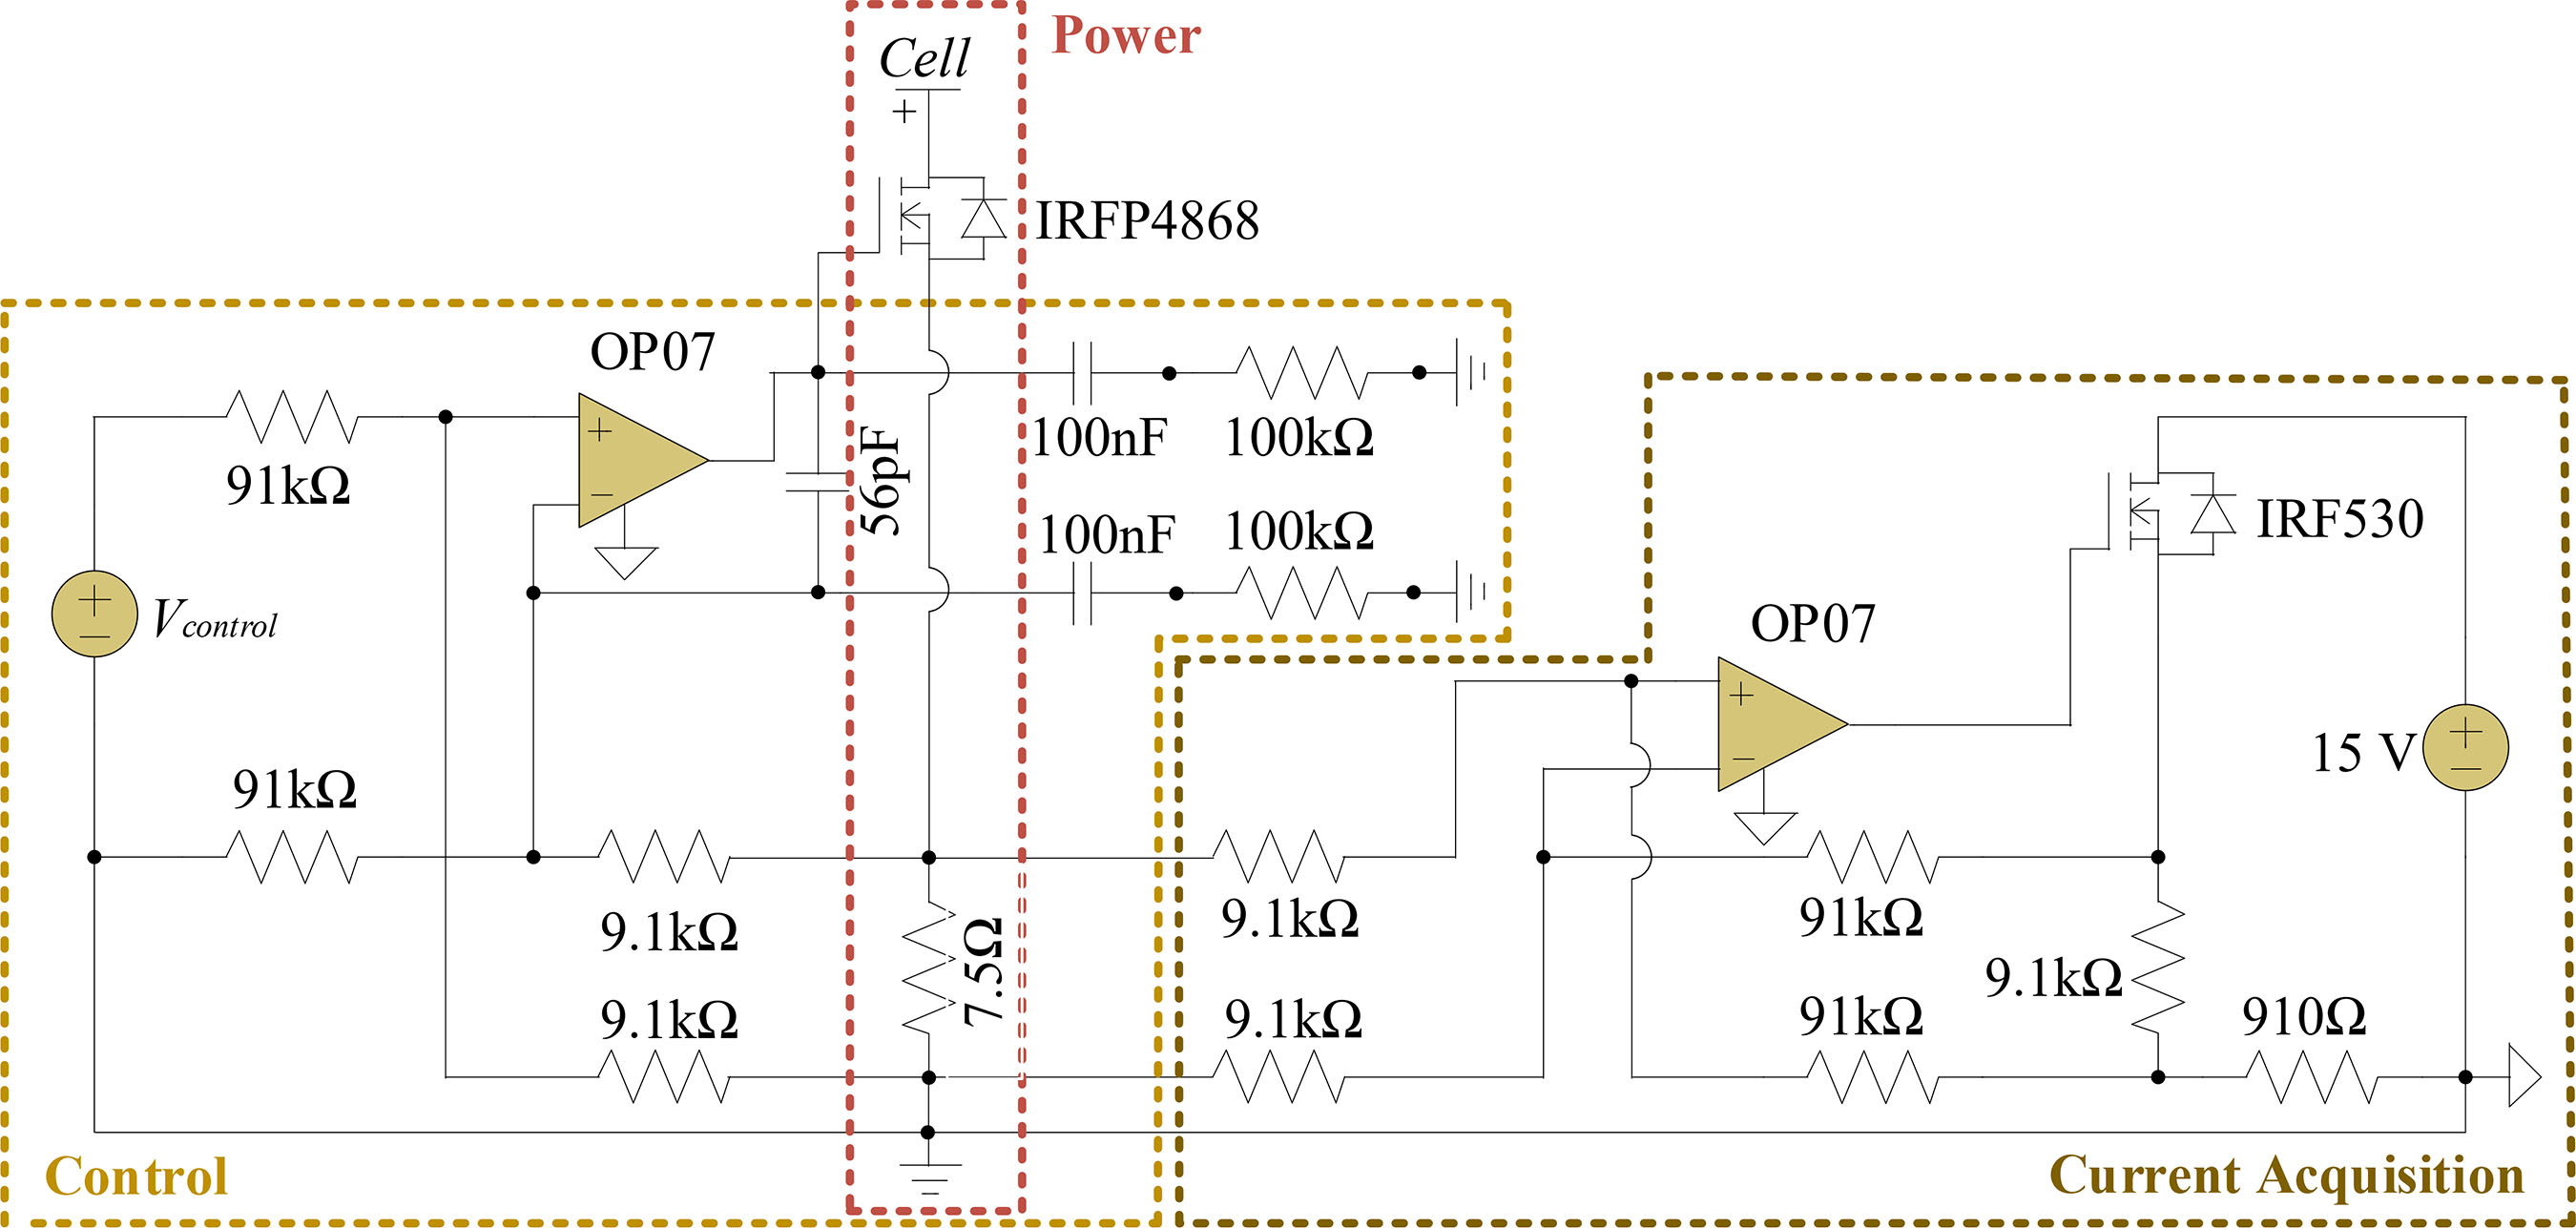
To tolerate high current values, in addition to selecting an appropriate semiconductor, multiple modules can be connected in parallel to the circuit shown in Fig. 3, as implemented in this work, or a single operational amplifier configuration can drive multiple MOSFETs in parallel, provided that each MOSFET is connected to an independent sense resistor. Both configurations ensure that the total current is evenly shared among the MOSFETs owing to the negative feedback characteristics of the source-follower.
A second circuit operating with a differential amplifier was added to detect the current over the resistor . The voltage ratio on the upper resistor of the instrumentation voltage divider follows (15).
A resistor in series with a magnitude ten times smaller, , was added to obtain the same voltage reading as .
A. PROTOTYPE
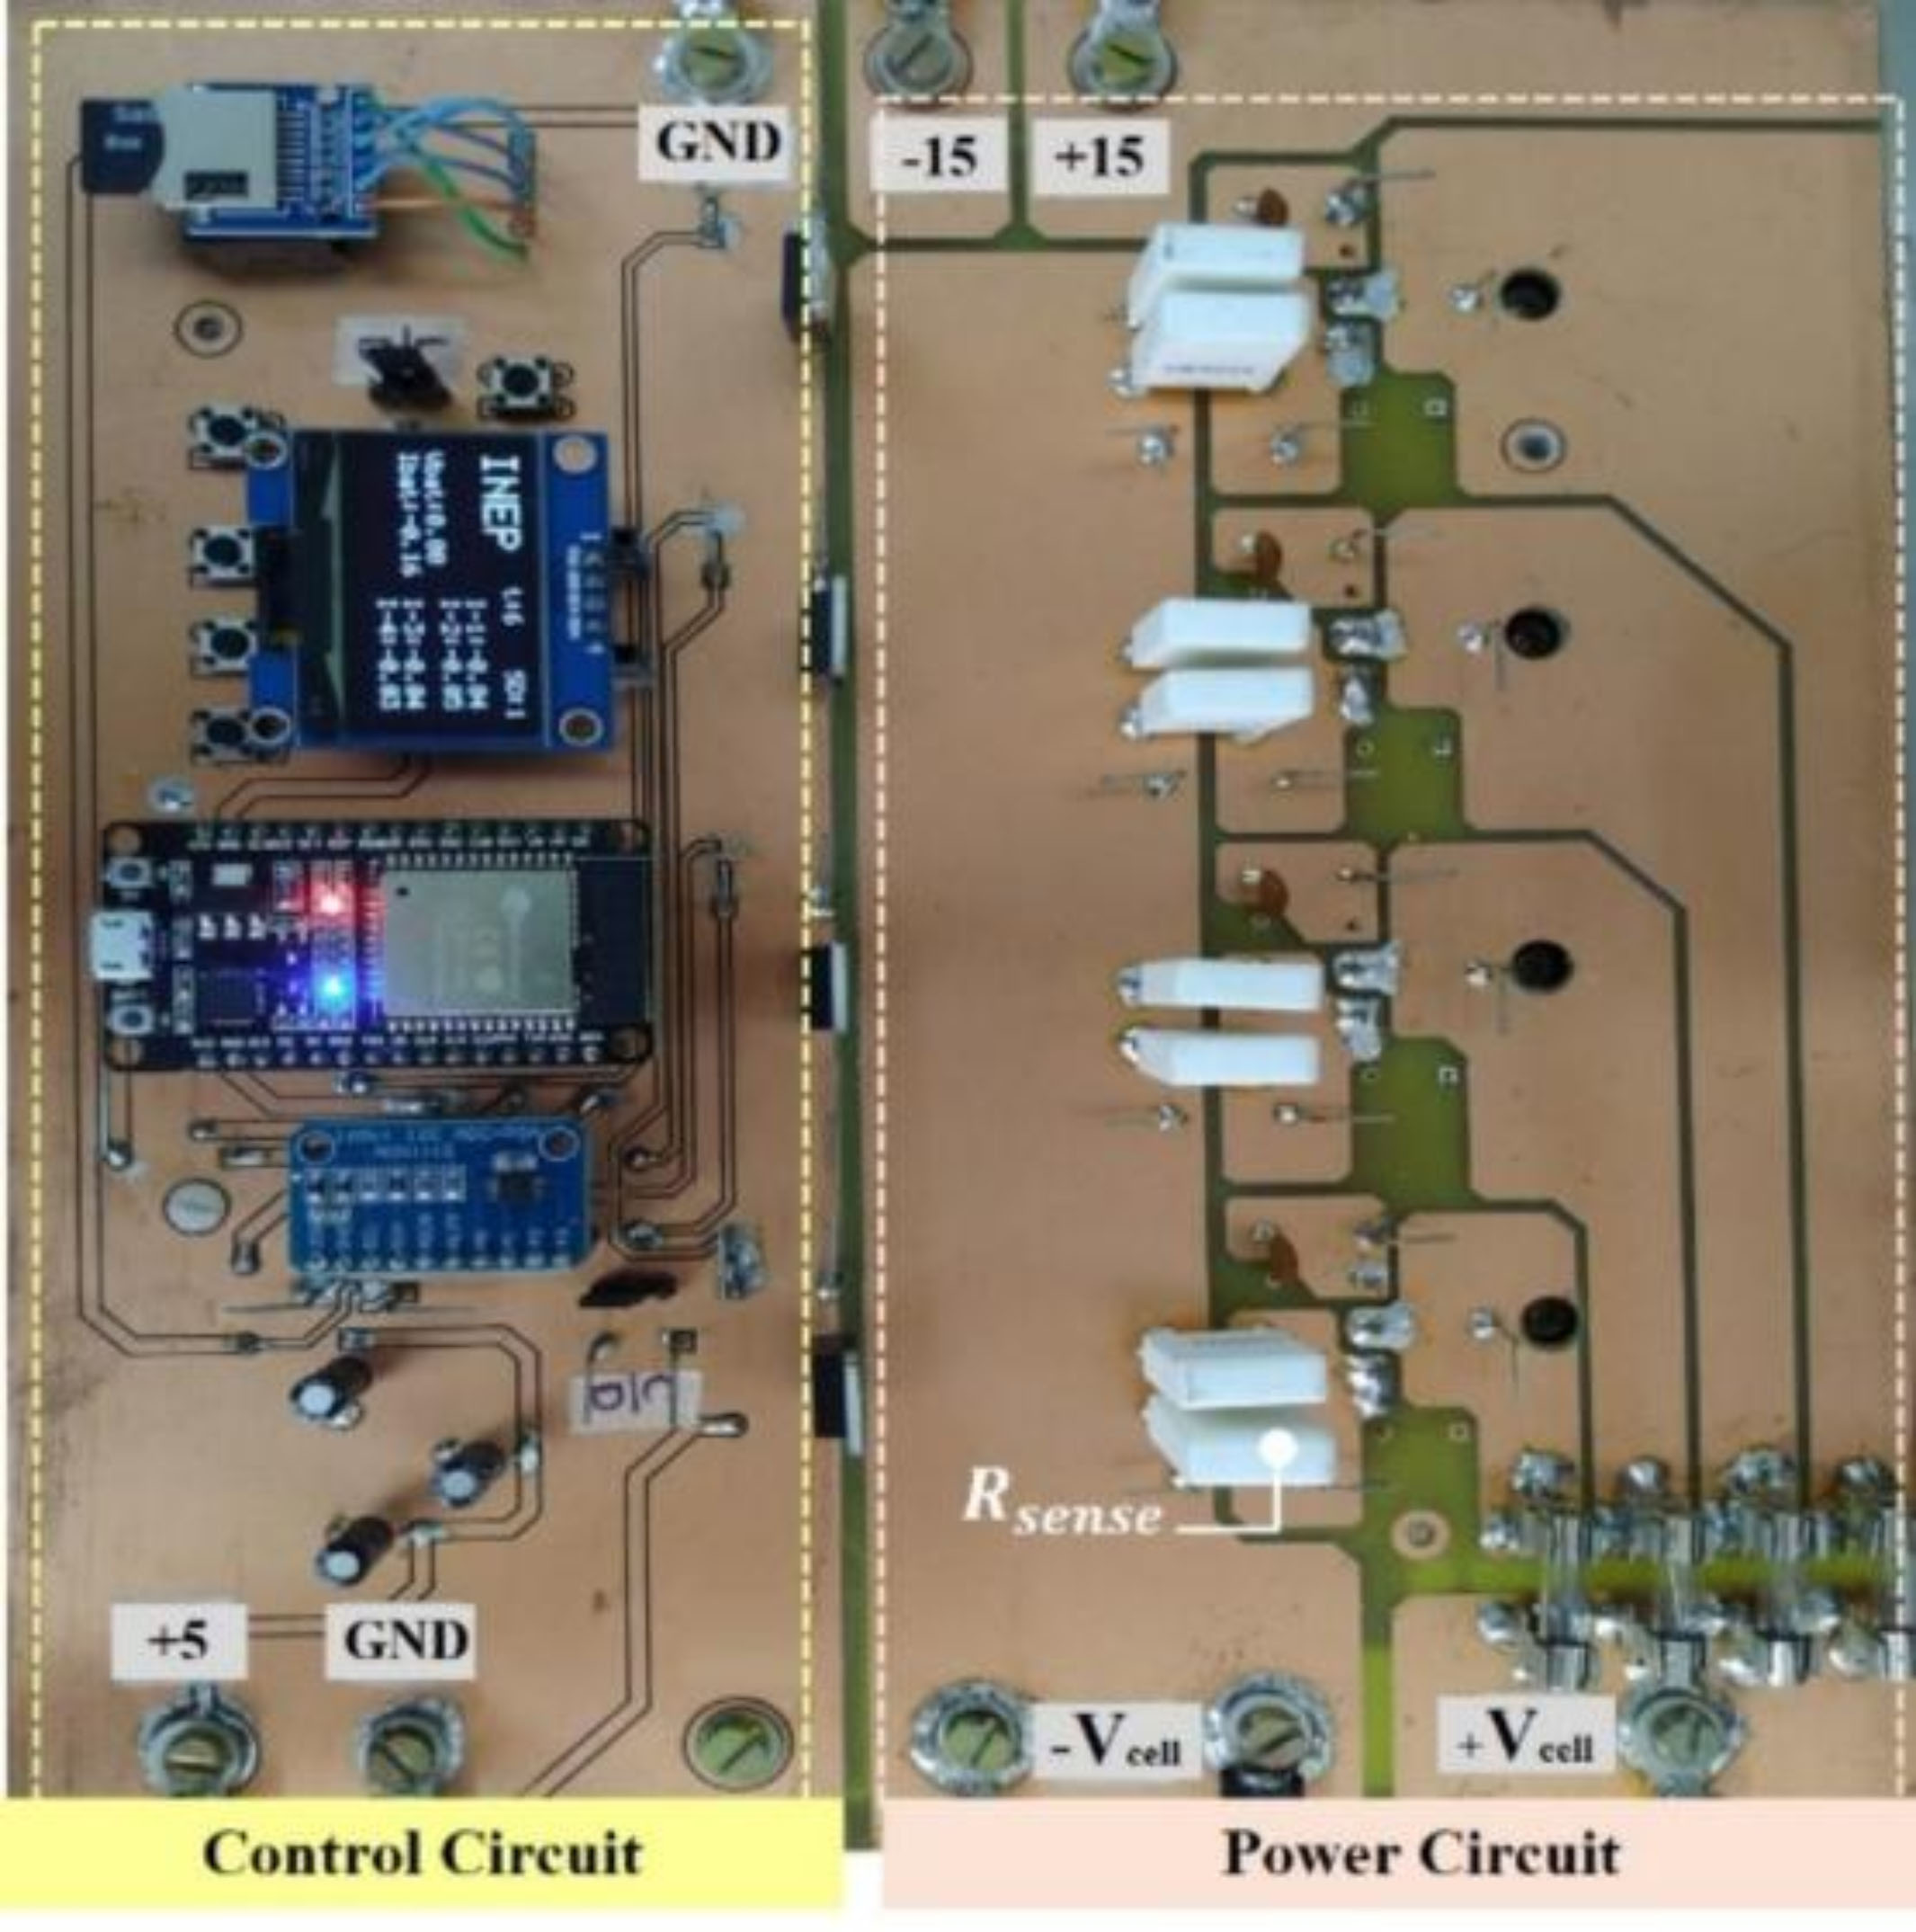
The electronic load design comprises four identical modules as shown in Fig. 3, with independent control signals to provide operational flexibility. The four circuits together allow dissipating 336 W of power with maximum current and voltage of 80 A and 4.2 V, respectively. Fig. 4(a) shows the image of the final prototype developed.

The management and control of the active electronic load in parametric tests, as well as the subsequent estimation of the cell's state of charge, were both developed within an ESP32 module, which features an ESP32-WROOM-32D microcontroller and 520 KB of RAM. The ESP32 module is also responsible for managing the test and experiment data on a memory card, details shown in Fig. 4(b).
In addition to current acquisition, the electronic load measures the cell voltage. For this purpose, a circuit with an operational amplifier operating in a differential configuration was designed.
The test circuit design shares its microcontroller-managed module between the electronic load circuit and other functions. These functions include voltage signal acquisition, data storage on a memory card, test data input via buttons, feedback display, and current reading for the charging stage (during this stage, the circuit deactivates the electronic load circuit and operates solely as a data logger).
Two 15 mΩ - 5 W ceramic resistors were used in parallel in each module as , with 5% accuracy. Factors such as resistor of the instrumentation tolerance, temperature coefficient, mounting type, and selecting resistors with low inductance and long-term resistance stability are carefully evaluated to ensure reliable current measurement.
For the MOSFET in the power circuit, technical selection parameters included minimal thermal resistance between the junction and package (), high maximum junction temperature (), operation at low frequencies, and operation in the resistive region with high power dissipation capability.
The selection of the OP07 AmpOp considered its rail-to-rail input and output capability, its ability to provide the minimum required voltage, the impact of temperature on the input offset voltage, and a high slew rate, while facilitating a rapid transient response, should be coupled with a robust output current capability of the AmpOp.
Additionally, component availability during the COVID-19 pandemic needed to be taken into consideration.
V. ELECTRONIC LOAD PERFORMANCE RESULTS
For the tests, the cell was recharged using DC power sources, one with 400 V – 20 A and another with 30 V – 5 A, applying the CC-CV (Constant Current-Constant Voltage) charging curve methodology.
The battery used was the LTO-66160H-2.3V40Ah from Yinlong, with a nominal capacity of 40 Ah, a nominal voltage of 2.3 V, and a discharge cutoff voltage of 1.5 V.
As a preliminary step, the performance of the electronic load was evaluated by configuring discharges using the navigation buttons on the board. In Fig. 5 and Fig. 6, the current and voltage measurements for the discharge and rest periods, respectively, are presented.


As demonstrated in Fig. 6, the voltage measurements responded stably, with values oscillating around 10 mV. For the current measurement exhibit in Fig. 5, the values were more variable, presenting variations of up to 380 mA. It is worth mentioning that the ESP32 module can execute all the functions and calculations associated with the project, limiting the acquisition rate to 100 ms.
In the enlarged views of Fig. 5, it is also possible to observe that the current is being activated without ramps between 0 A and the programmed current value. In the pulsed characterization tests, this is an important feature for capturing the dynamics of the cell without distortions.
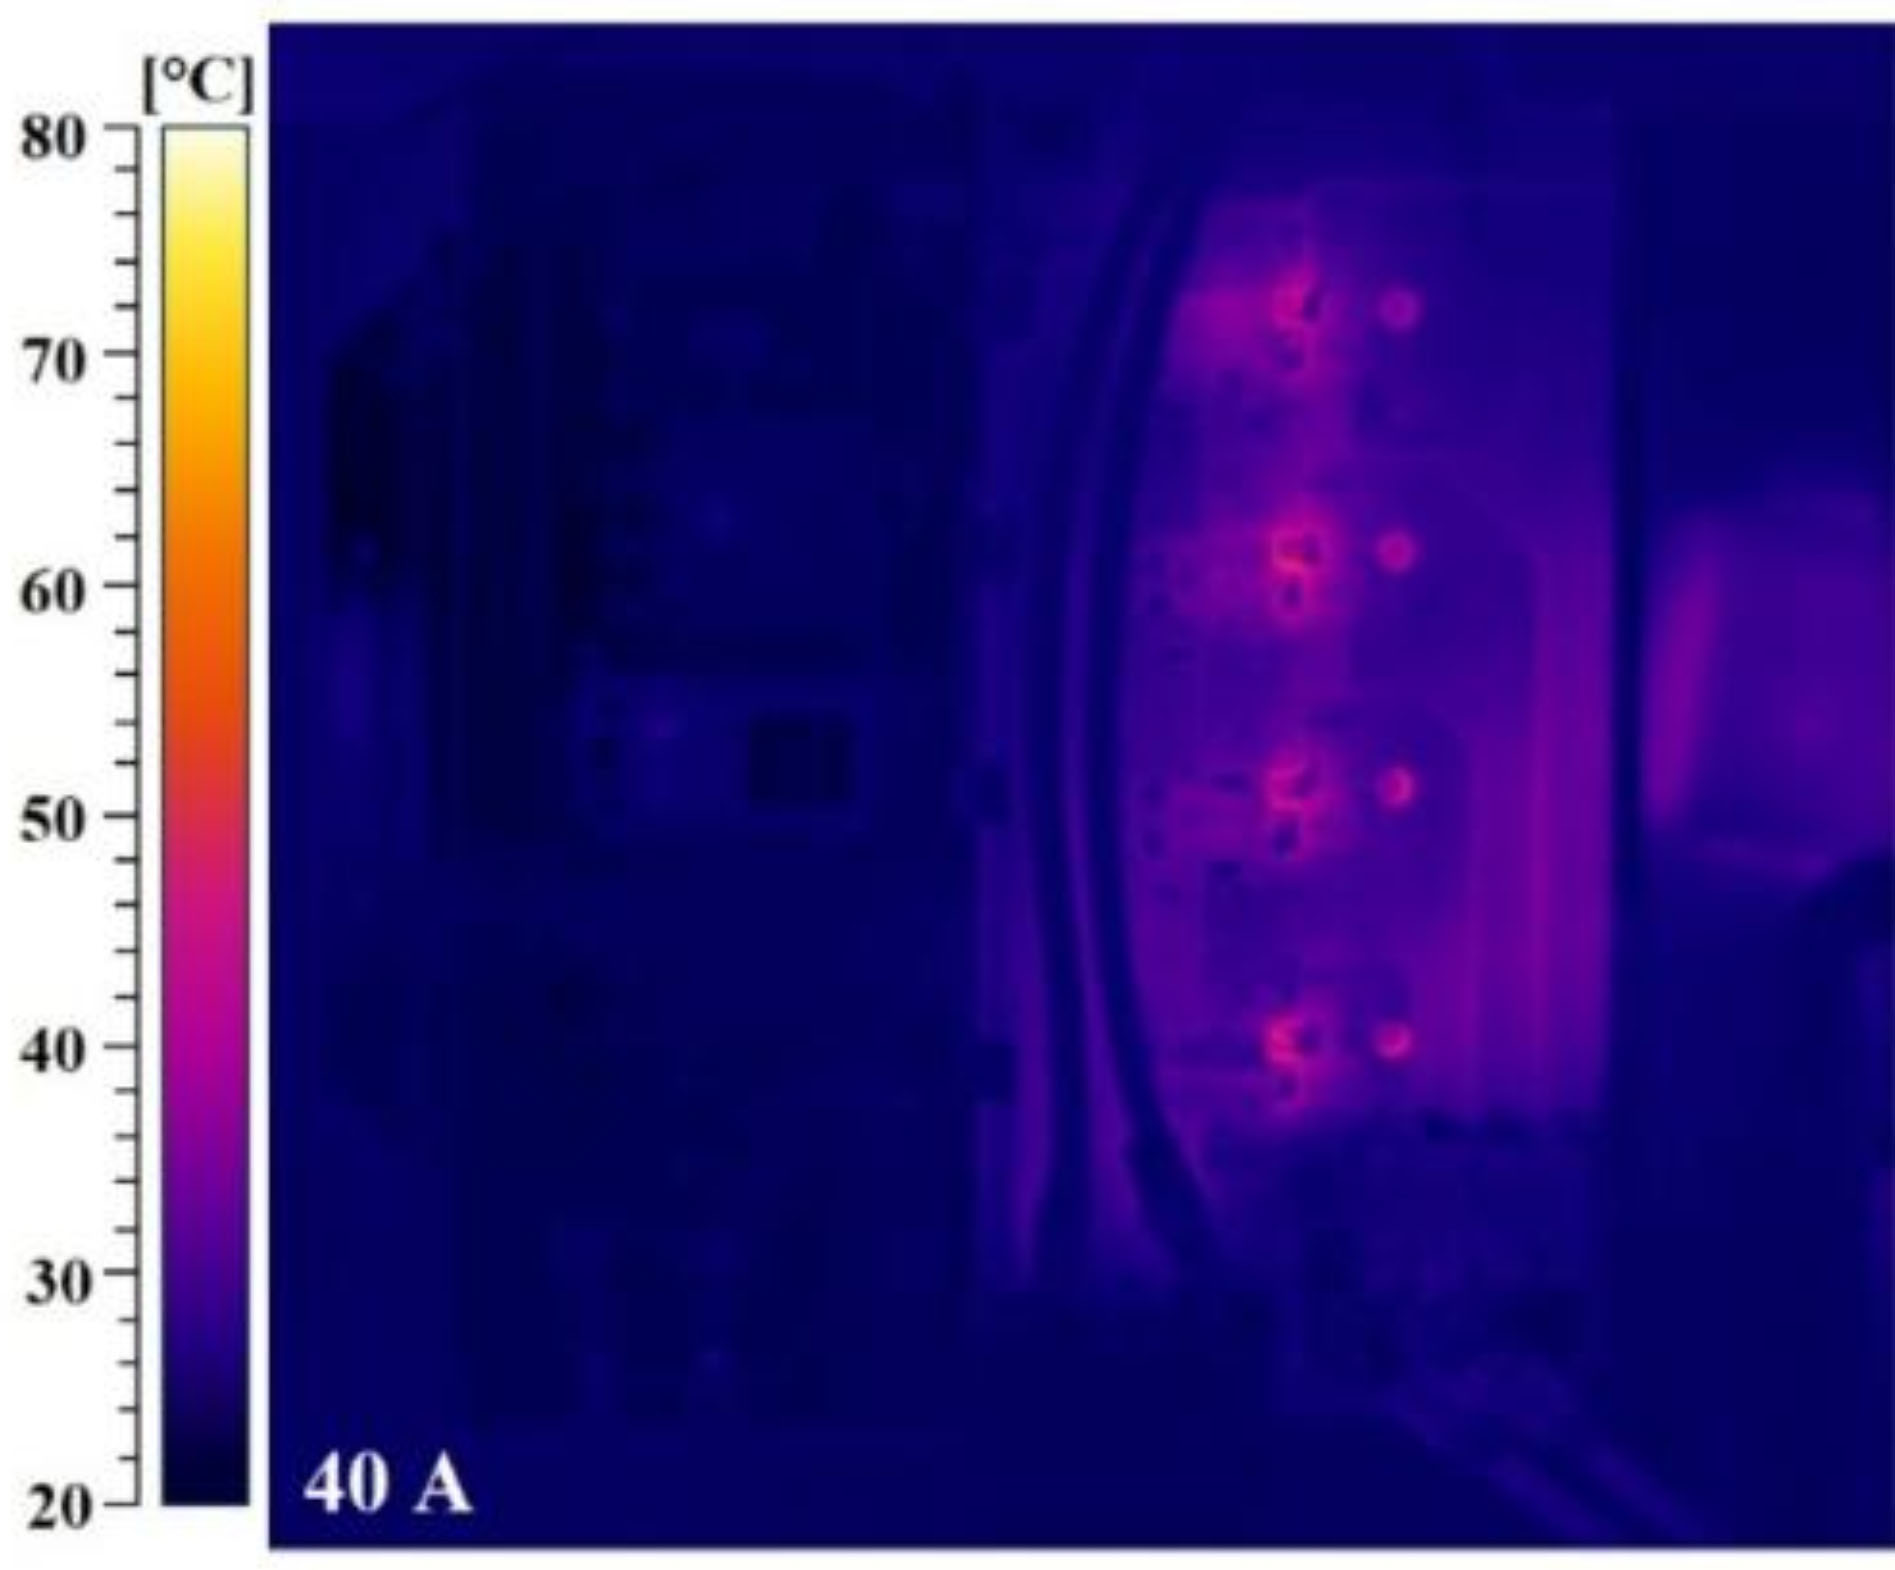
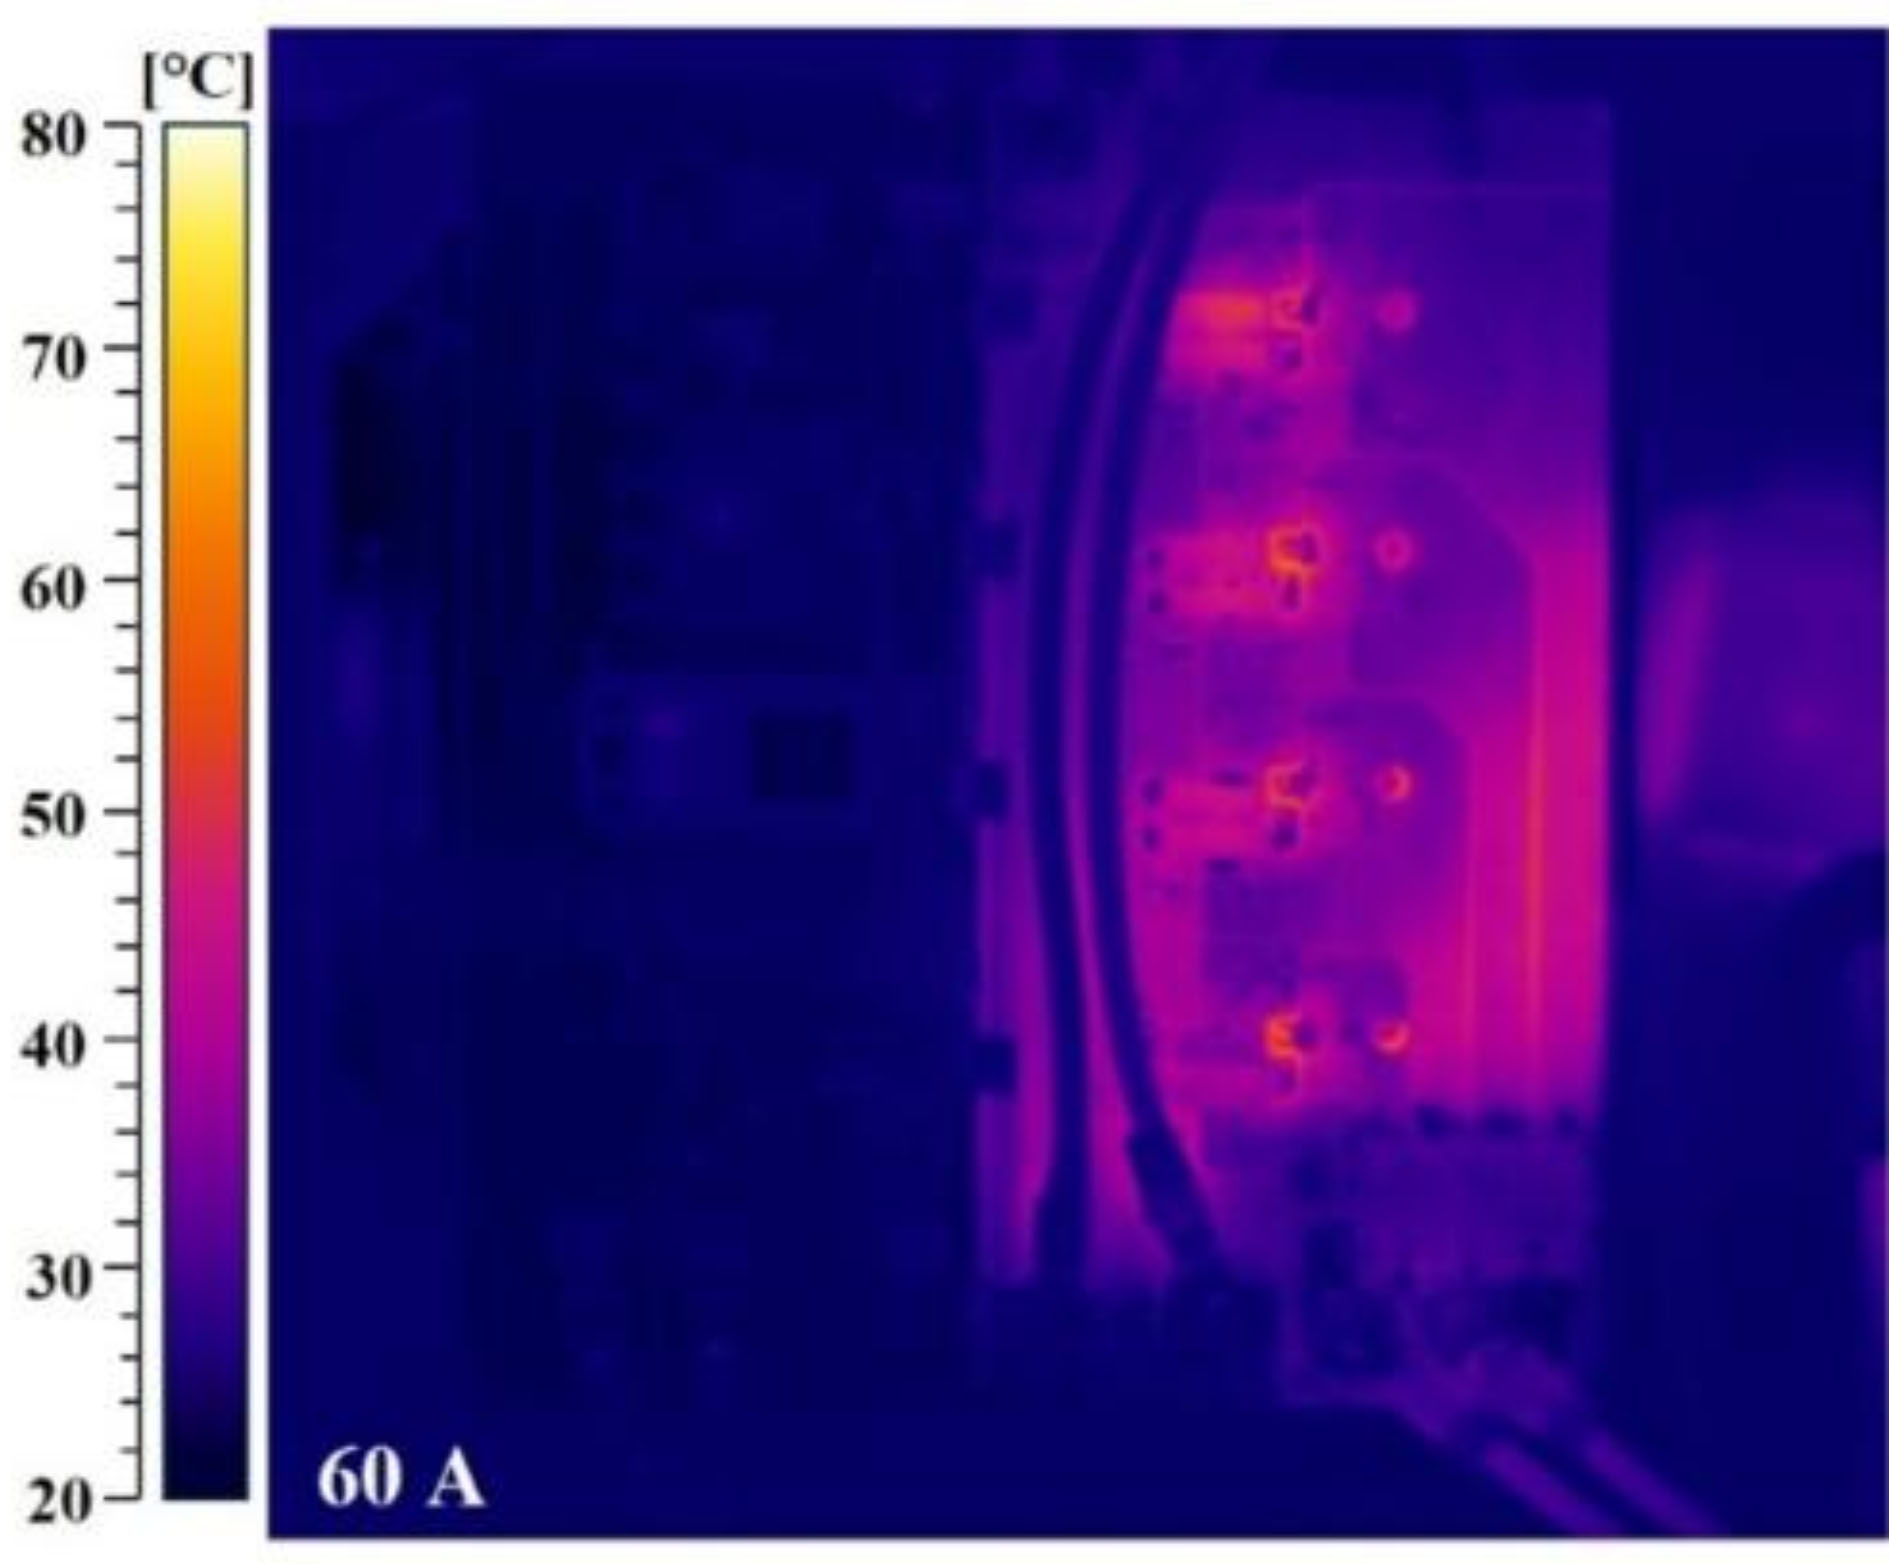
A complementary analysis of the developed circuit design involved a thermal analysis using the FLIR SC655 thermal camera. The insertion of the thermographic images allows for a more detailed analysis of the electronic load's performance at different operating points. The thermo images for four discharge current values of 20 A, 40 A, 60 A, and 80 A are found in Fig. 8, Fig. 9, Fig. 10, and Fig. 11, respectively. With the cell fully recharged, the images were captured at the end of the discharge cycle. The top view of the prototype highlighting the circuit types can be seen in Fig. 7.
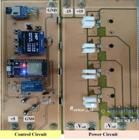
The evaluation of the thermal images (Fig. 8, Fig. 9, Fig. 10, and Fig. 11) indicate that the heating points are concentrated in the dissipative elements, MOSFET, and in the instrumentation resistors.
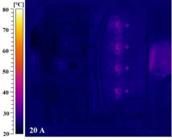

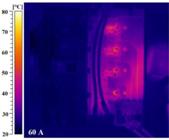
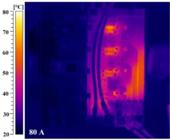
It is normal for the heating to increase with increasing current. In the most aggressive scenario, in which each IRFP4868 dissipates 20 A of current, the temperature recorded by the thermal camera showed values below 80°C in the tests. It is worth noting that the prototype has an aluminum heatsink, see Fig. 4(a), and ventilated ventilation to maintain this temperature throughout the cell discharge cycle.
Adequate heat dissipation is important for the useful life of the circuit; therefore, it was evaluated in the prototype. The images identified some points for improvement in the circuit layout related to better current circulation, heat dissipation and welding.
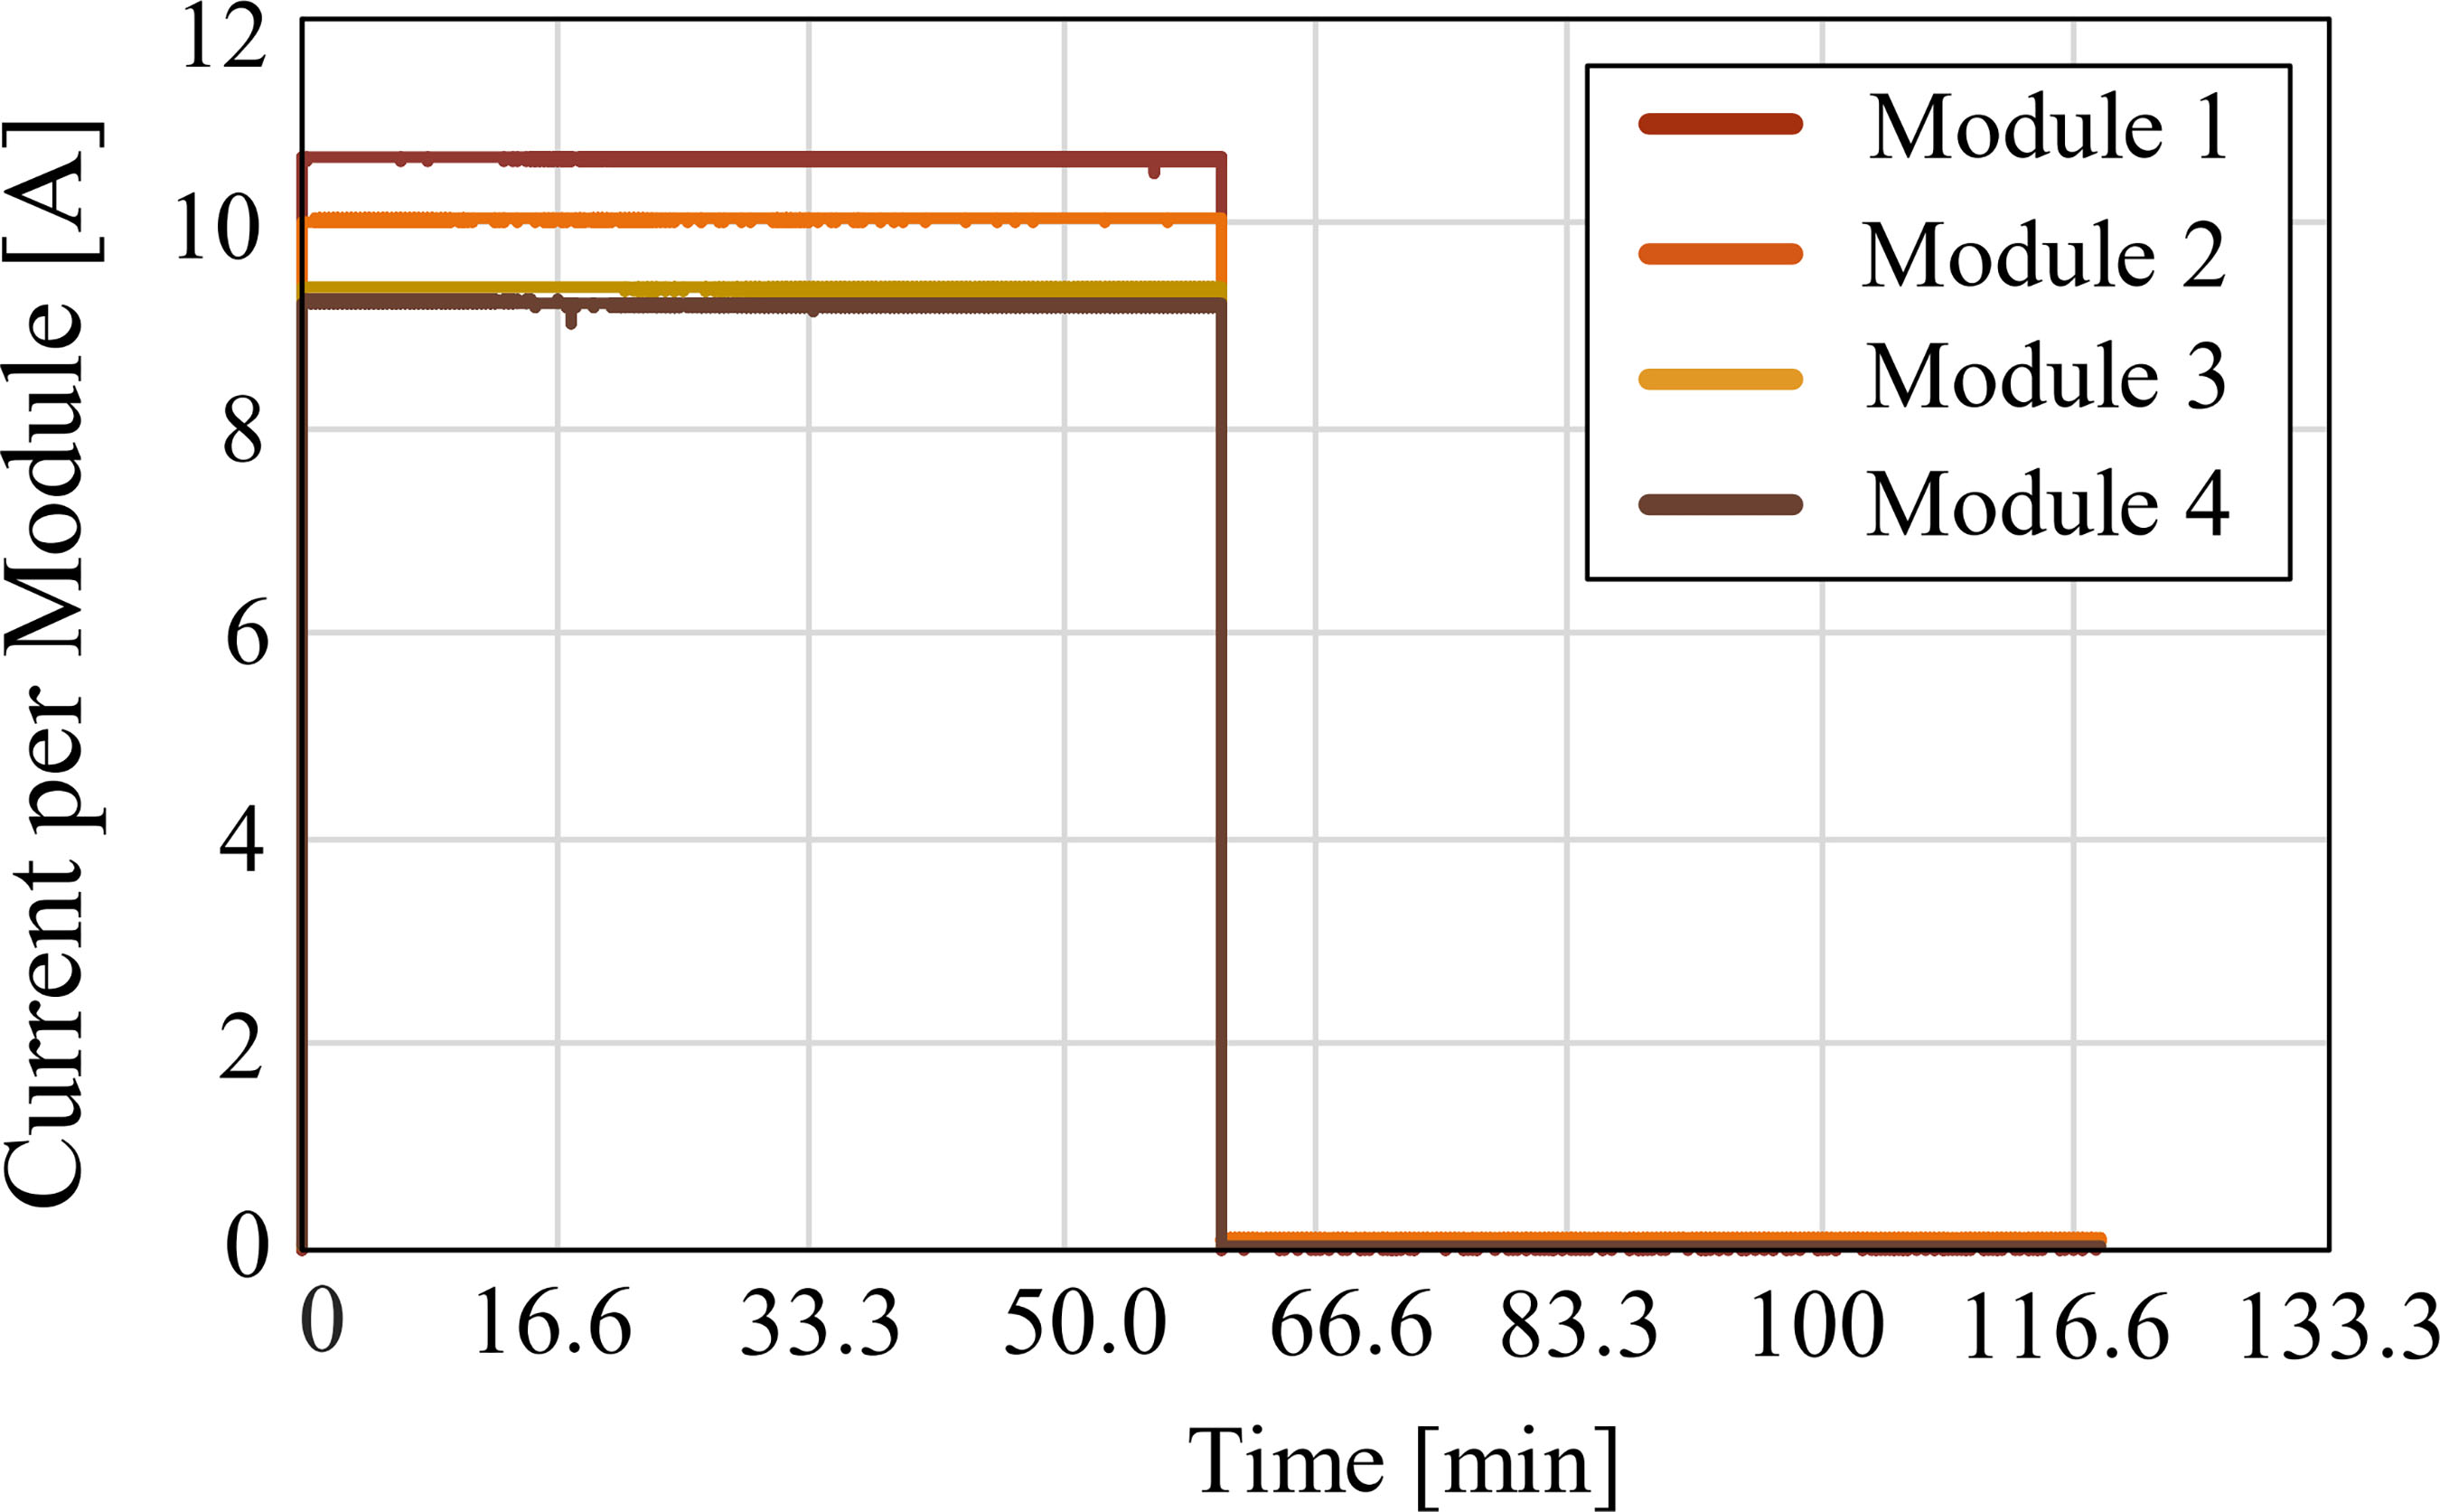
The current during the thermal evaluation that generated Fig. 9 was recorded and is shown in Fig. 12. The observable current variation occurs due to the arrangement of the modules in the circuit, resulting in different impedances, with module 1 being the closest to the cell connection and module 4 the farthest.

The electronic load produced cost approximately $600, with a power dissipation limitation around 300 W and voltage limited to cell level. In contrast, battery cyclers range from $20,000 to $100,000 or more, depending on the power involved and the manufacturer [20]. They offer significant flexibility in cycling voltage, programmable integrated charge and discharge, and high-precision instrumentation. In the context of single-cell testing, the developed project is limited only by the precision of the instrumentation, which is inferior to commercial products, largely due to the lack of components during the COVID-19 pandemic.
Upon completing the performance tests and adjustments on the test board, the next stage involved testing the cells. The experimental setup is presented in Fig. 13 and consists of the developed circuit board with forced ventilation, external power supplies, instrumentation equipment (oscilloscope and precision multimeters), two battery cells, and a climatic chamber.

VI. BATTERY CELL PARAMETERIZATION RESULTS
Two types of tests were performed on the experimental setup using the electronic load, the first test involved continuous discharge at a current and the second test involved intermittent discharge at a current.
Both experimental discharge tests were conducted with the cell fully charged. Prior to commencing the discharge, which is to say, between charging and discharging, there is a resting period of 1 hour and the temperature was kept controlled at values of -5°C, 5°C, 15°C, 25°C, 35°C, and 45°C, depending on the test, using a climatic chamber capable of operating in the temperature range of -70°C to 180°C.
A. CONTINUOUS DISCHARGE TESTS
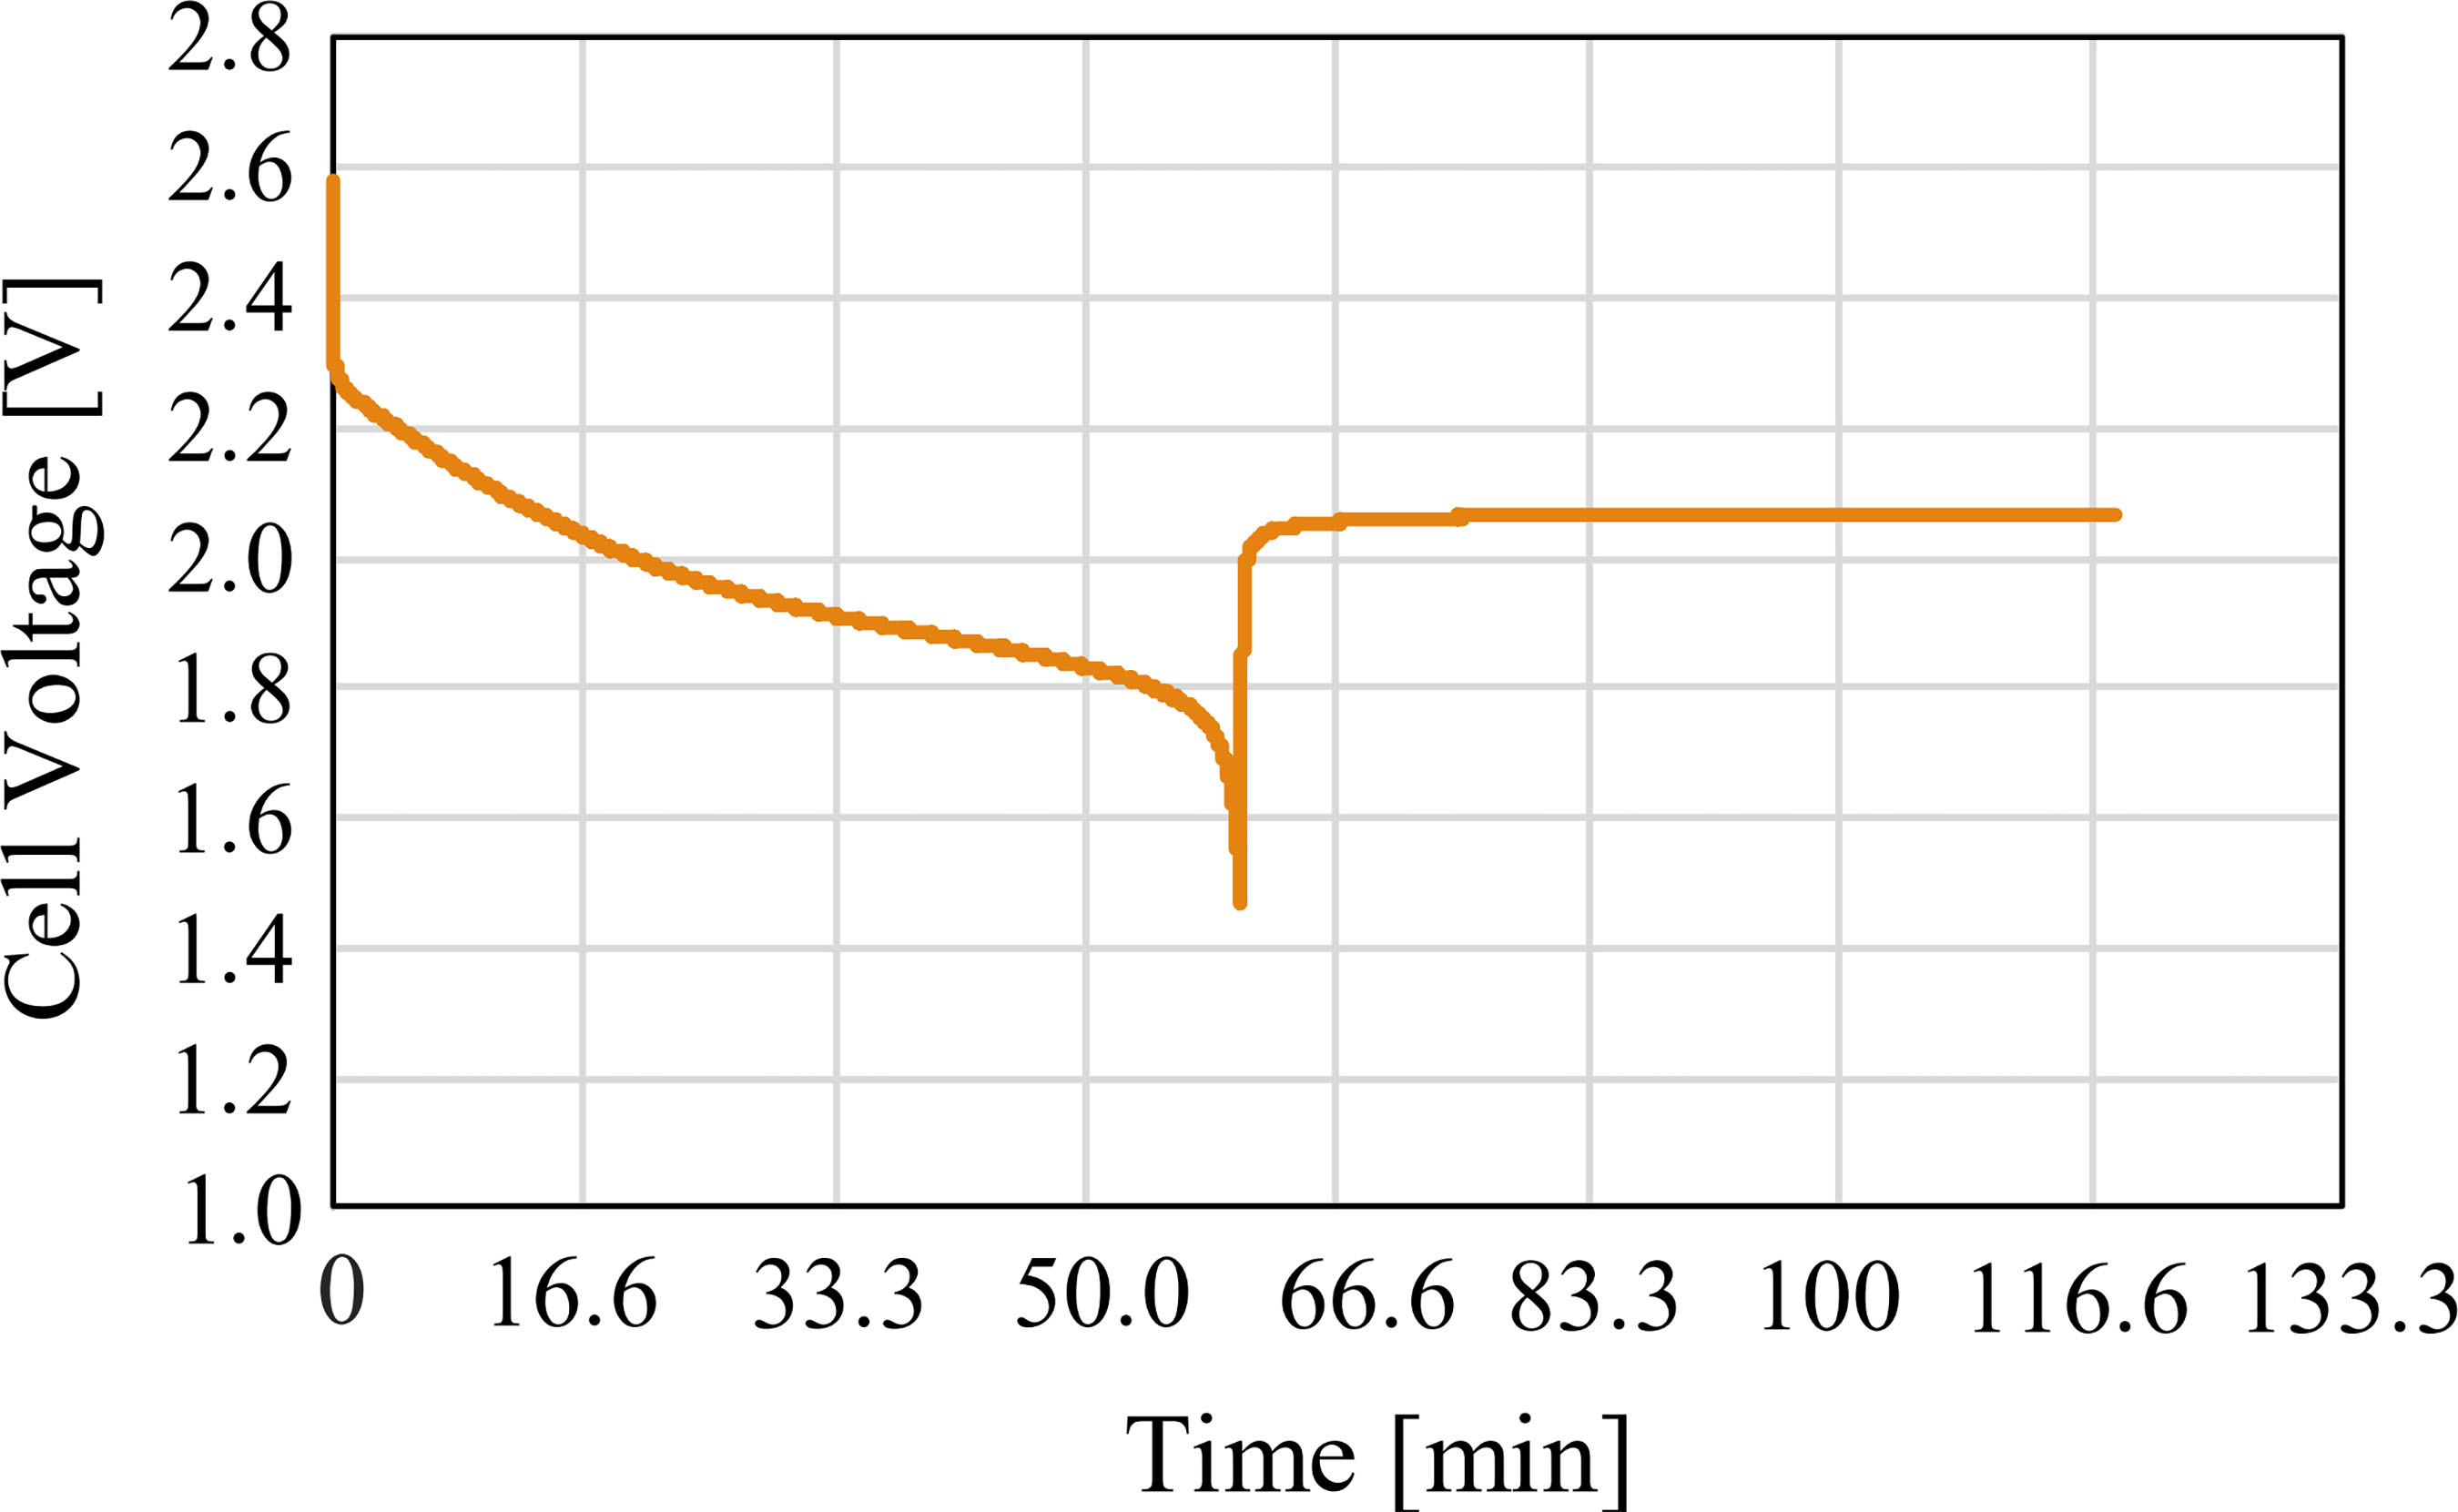
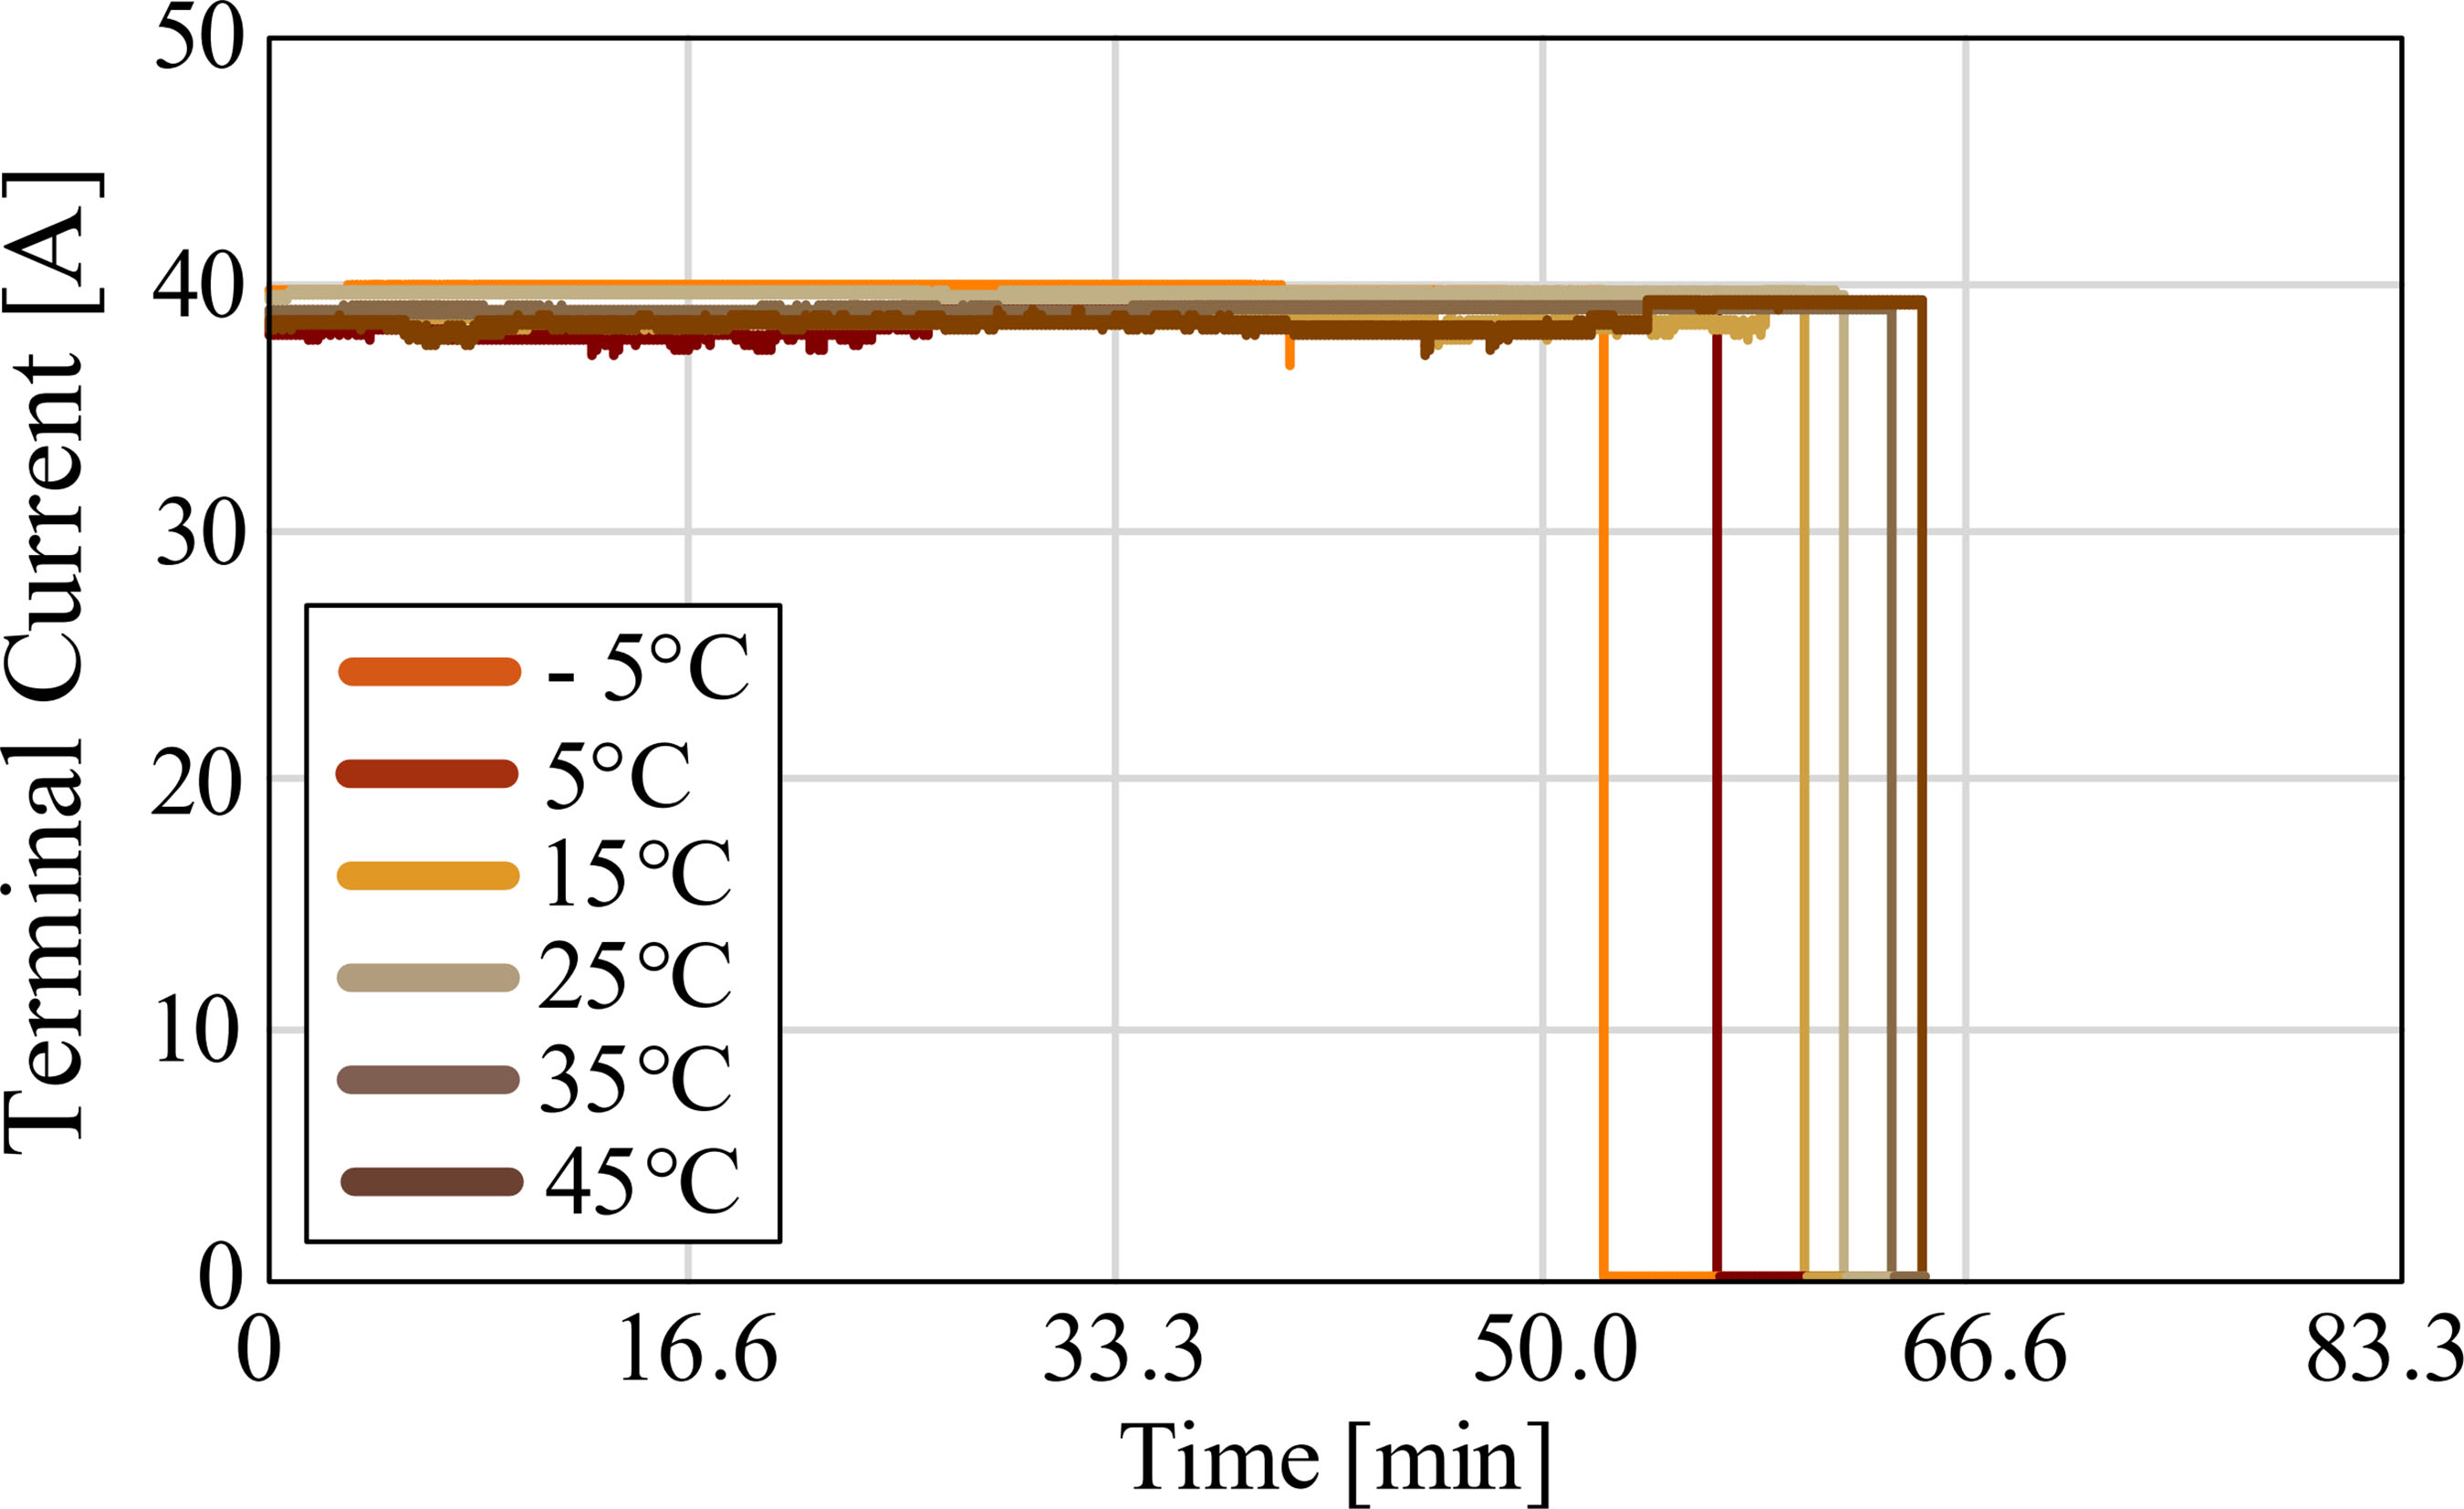
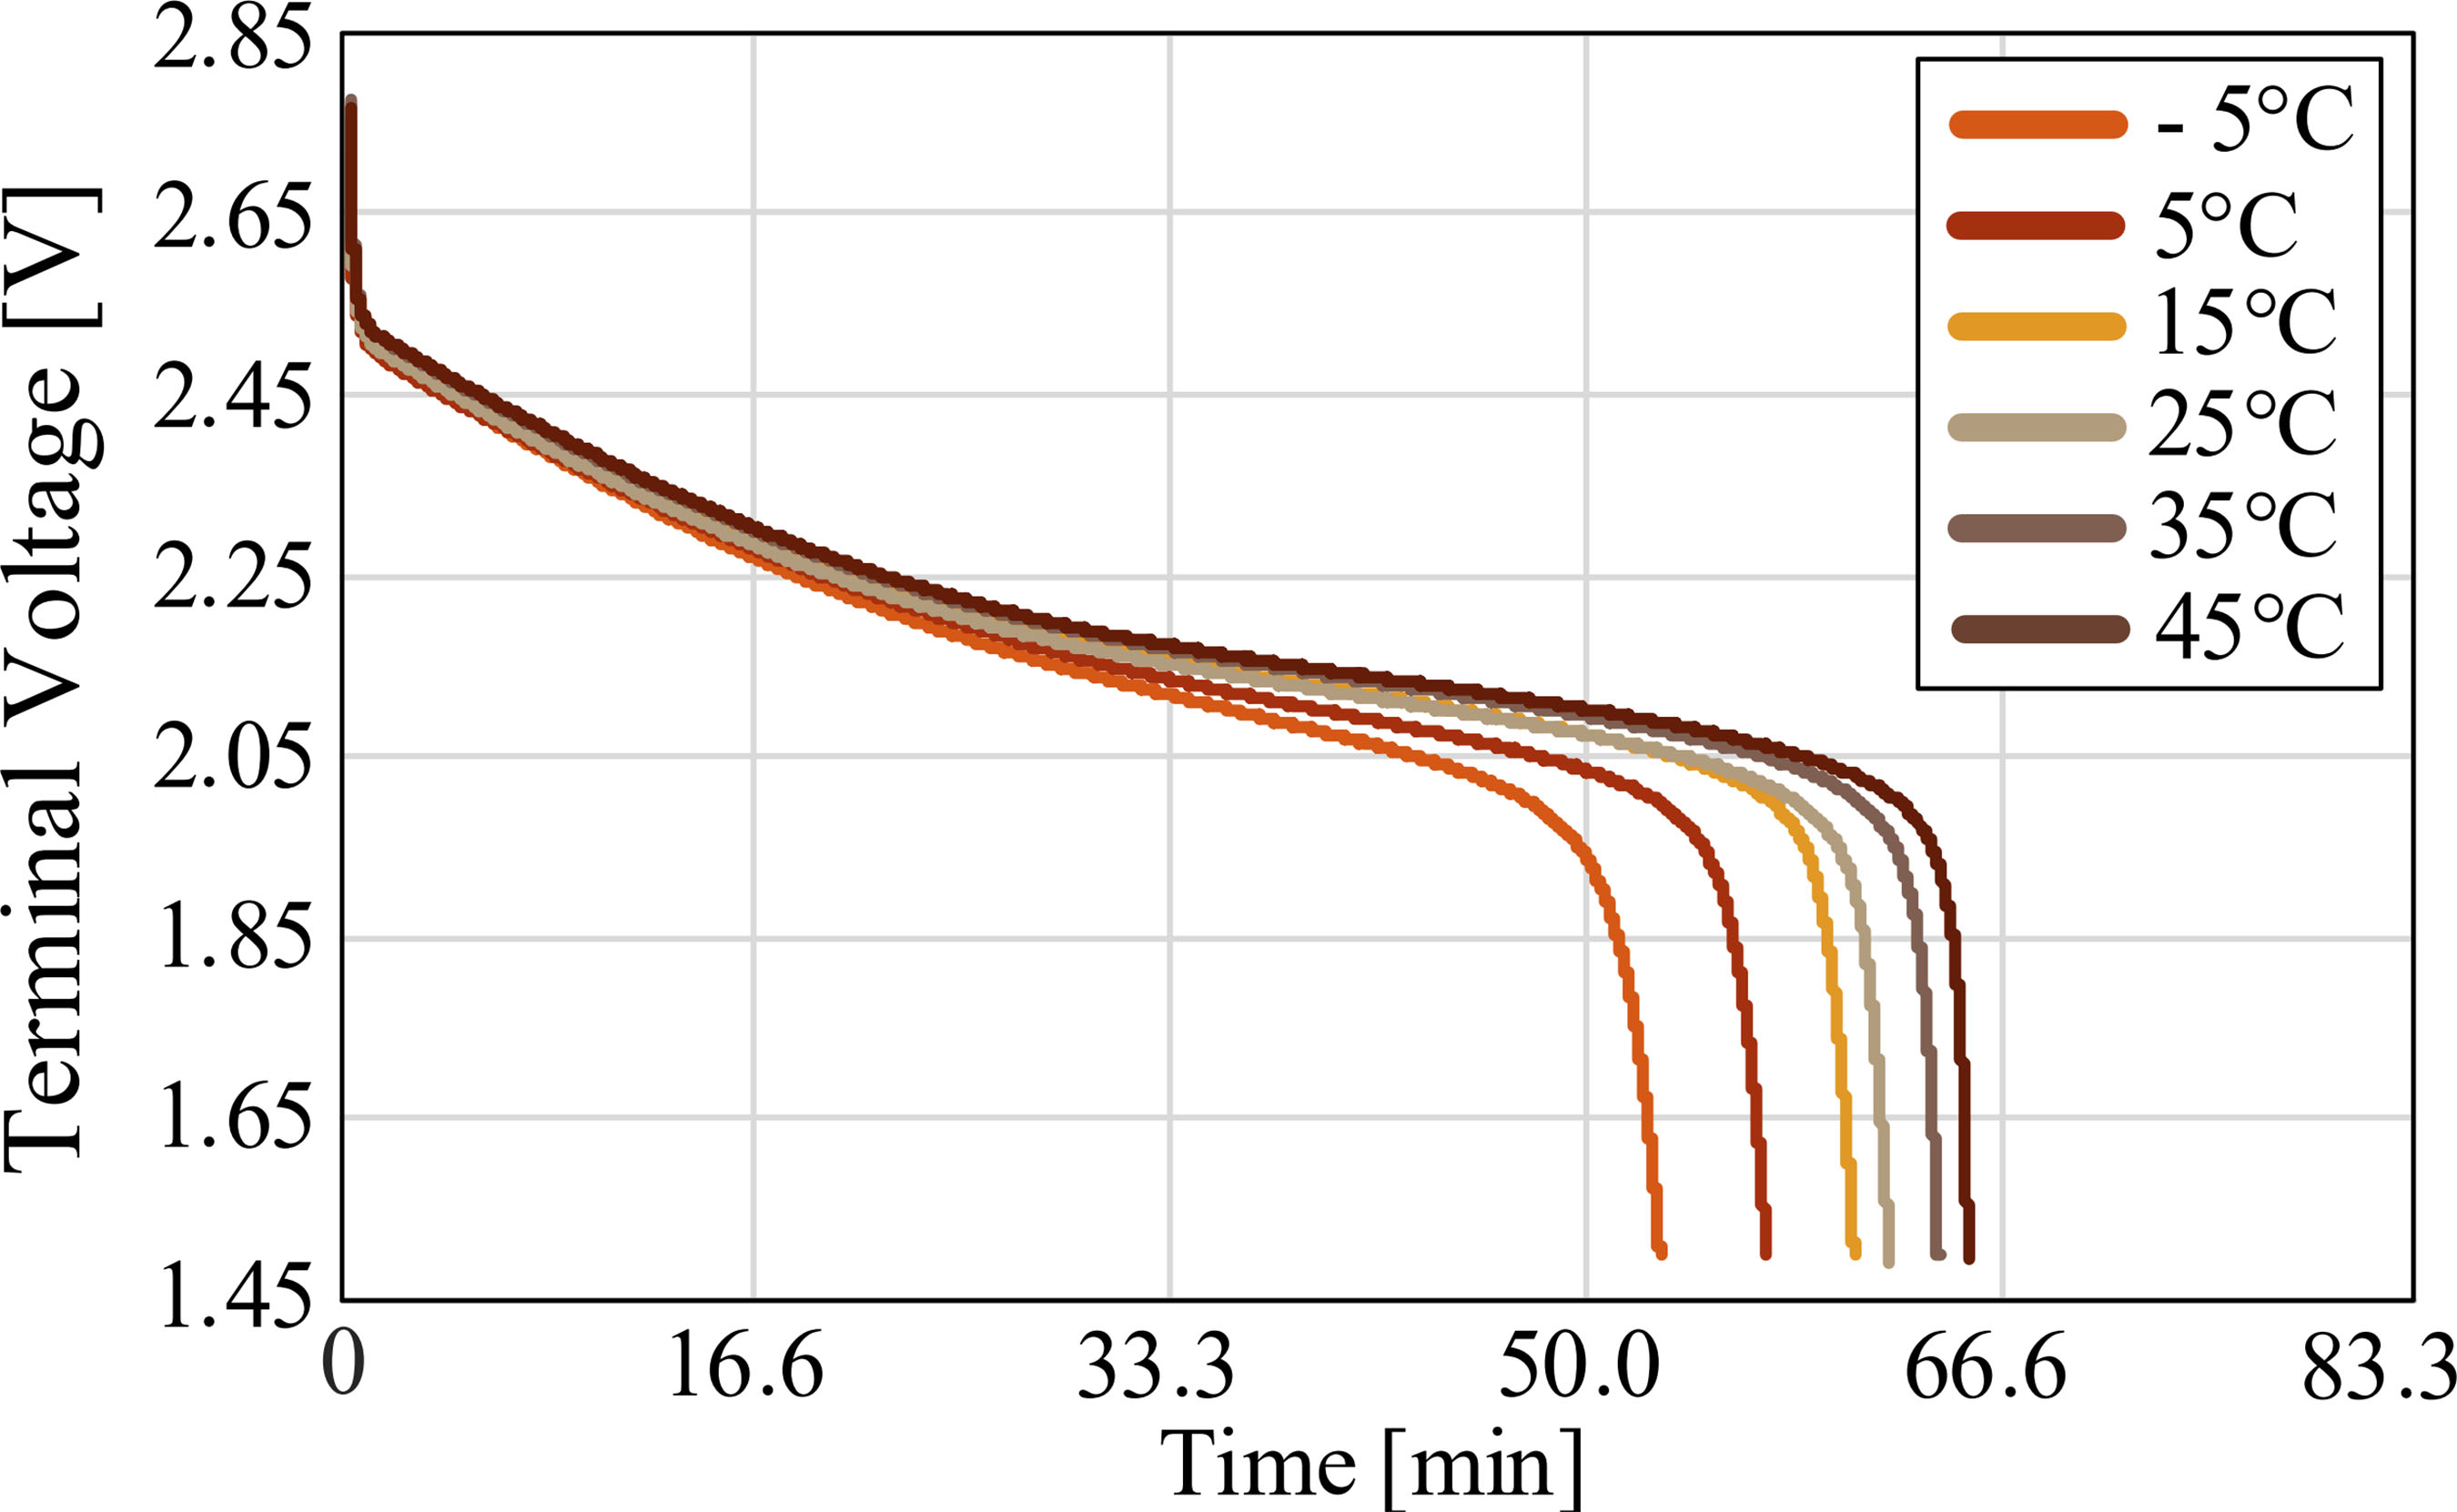
The cell was discharged continuously. Tests were conducted with discharge currents at 1C (40 A) at temperatures of -5°C, 5°C, 15°C, 25°C, 35°C, and 45°C.
The current and voltage behavior in the cell is presented in Fig. 14 and Fig. 15, respectively. Regarding the voltage discharge curves, a reduction in cell capacity was observed at temperatures below 25°C. There is also a noticeable increase in discharge time in tests at higher temperatures. Both behaviors are common in lithium-ion cells because the speed of charge and discharge reactions is influenced by temperature [21], [22]. At temperatures below 25°C, there is a decrease in the reaction speed, reducing ionic mobility. Conversely, at temperatures above 25°C, there is an increase in reaction speed.


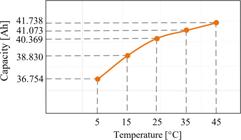
In Fig. 16, the numerical capacity values are presented for a 1-hour regime, equivalent to 1C, calculated by integrating the currents from Fig. 14 for each of the considered temperatures. It is worth noting that determining the nominal capacity in lithium-ion cells requires a discharge rate of 0.2C, totaling 5 hours for complete discharge.
B. PULSED DISCHARGE TESTS
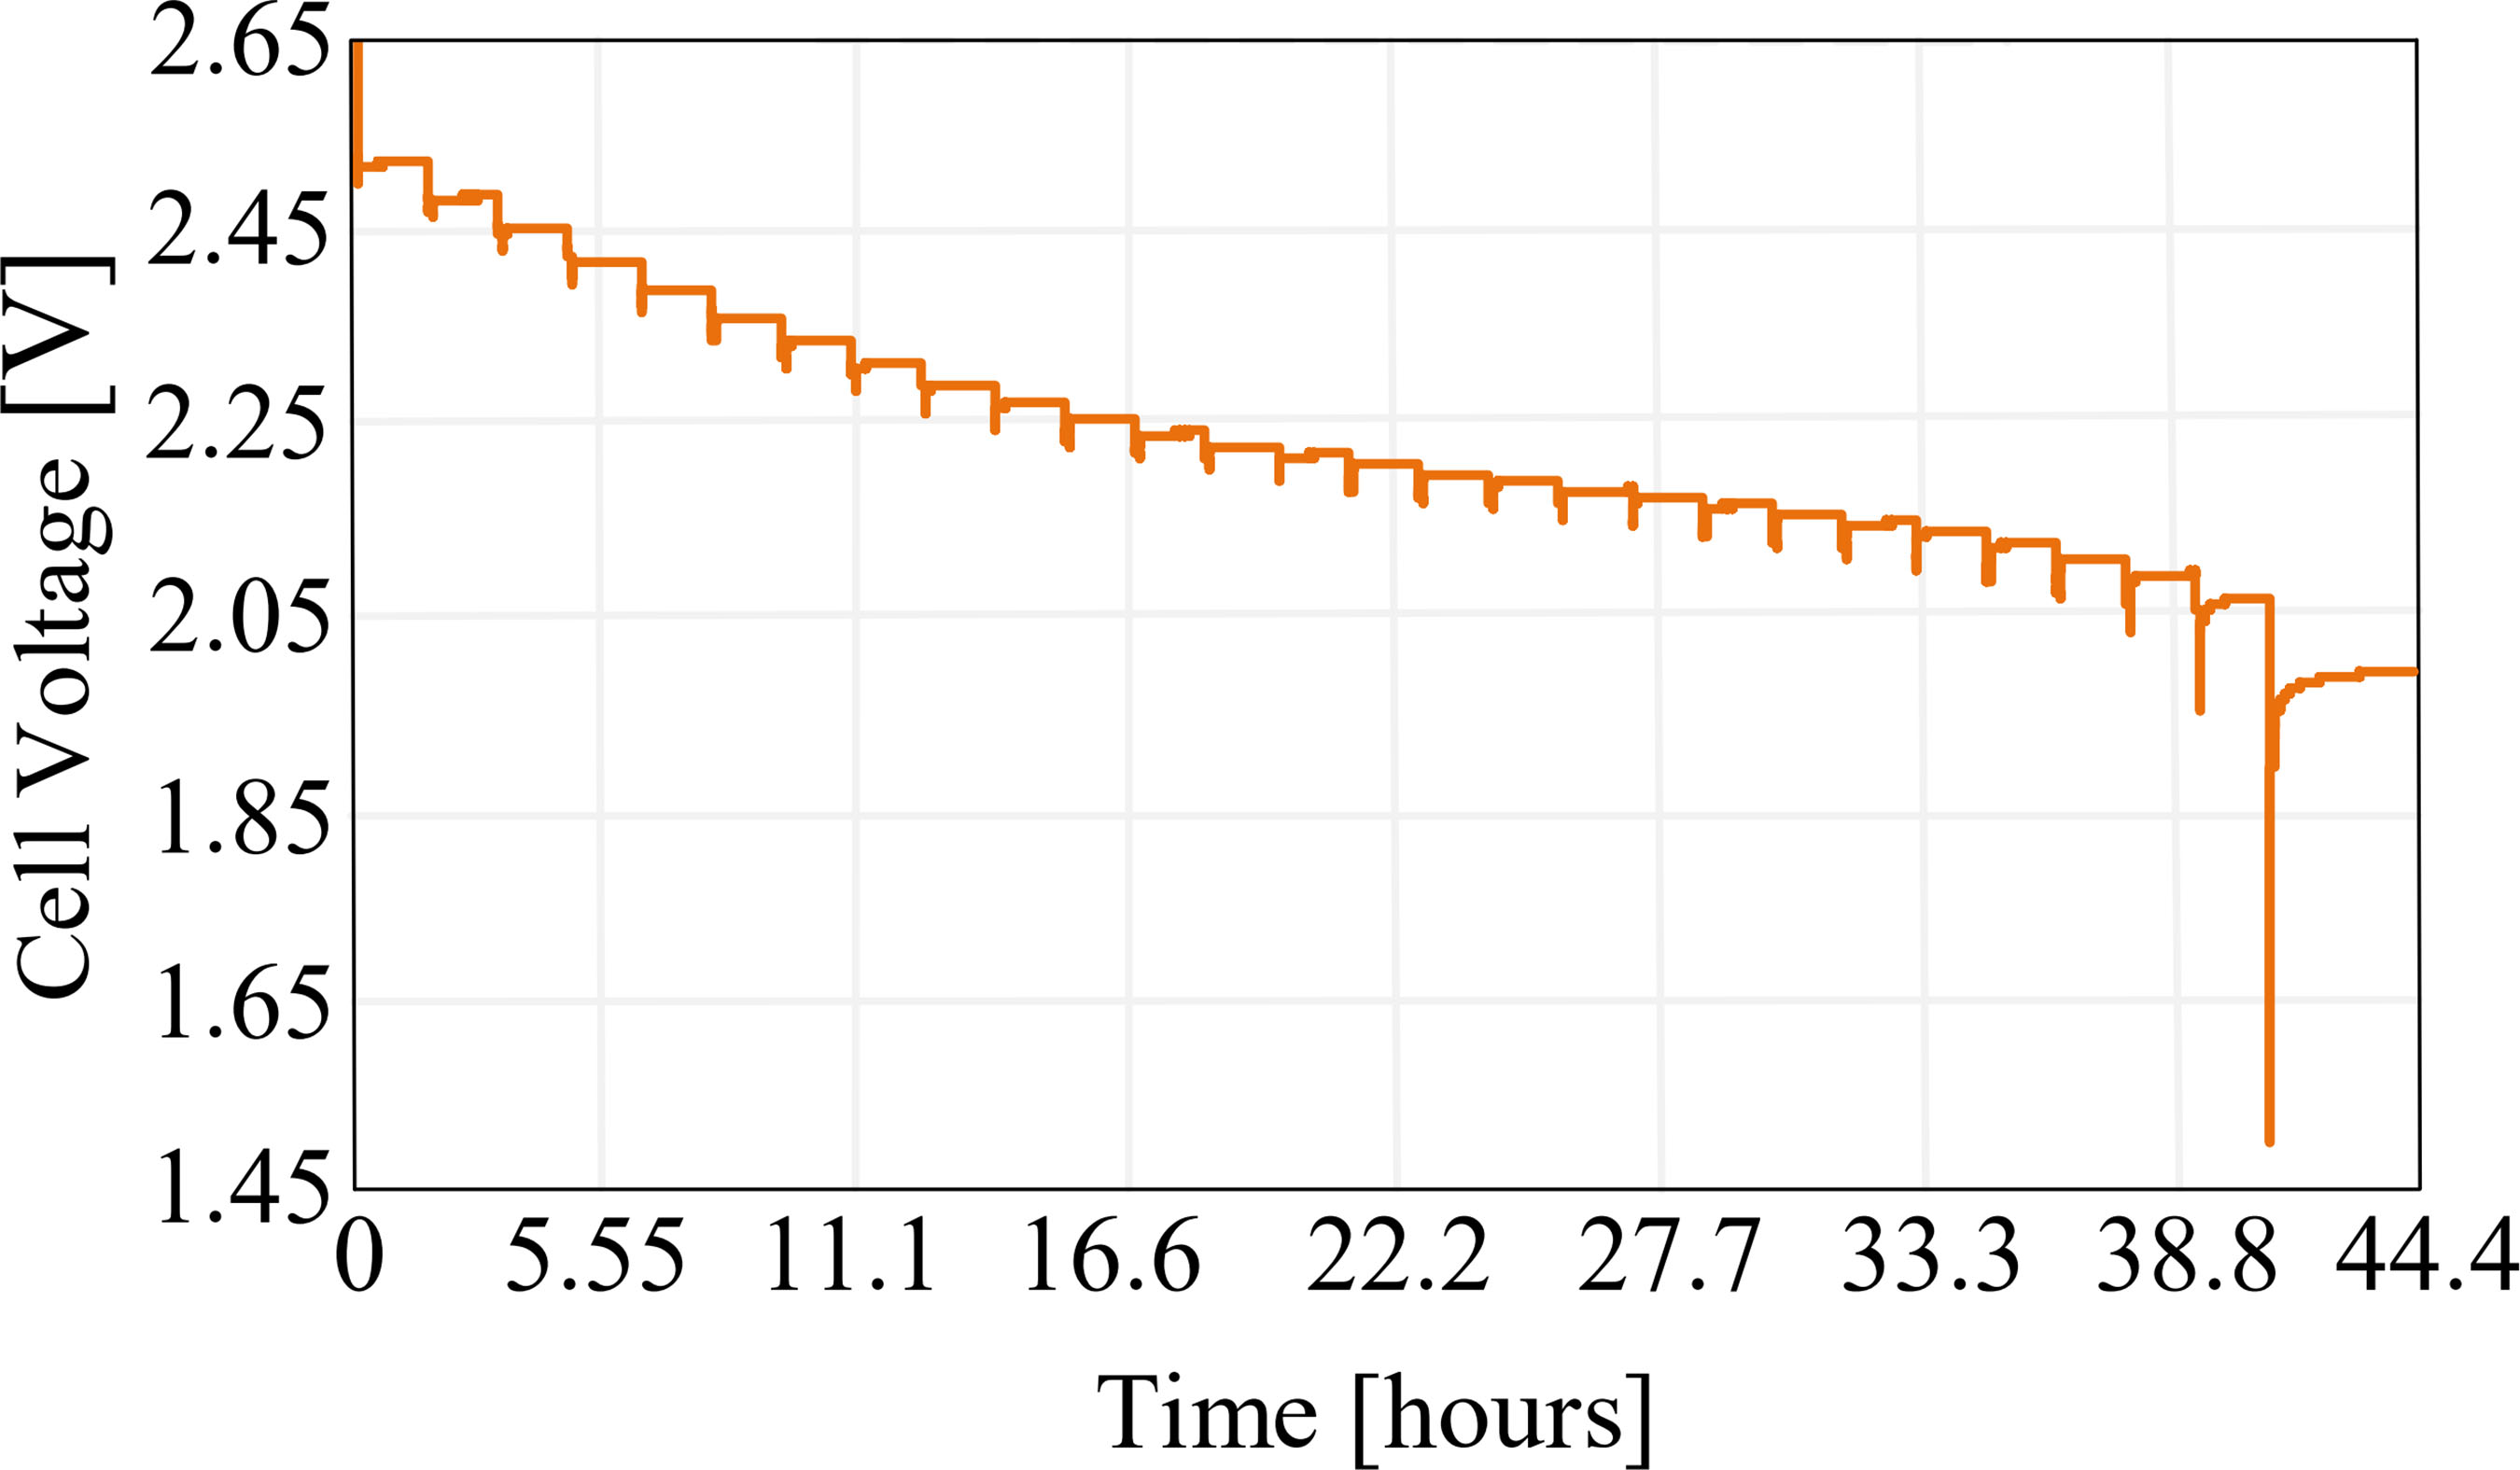
Using the open-circuit voltage values collected after a 90-minute rest period between each current pulse, a function defining the open-circuit voltage dynamics was obtained using the Levenberg-Marquardt numerical method [23]. The numerical algorithm determined the coefficients of (16) in the MATLAB® software.
In Fig. 17, the relation between the state of charge and the open-circuit voltage, as modeled by numerically obtained equations, is displayed [10].
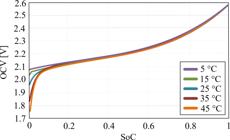
Dynamic behavior of the numerical OCV equations for temperatures 5°C, 15°C, 25°C, 35°C, and 45°C.
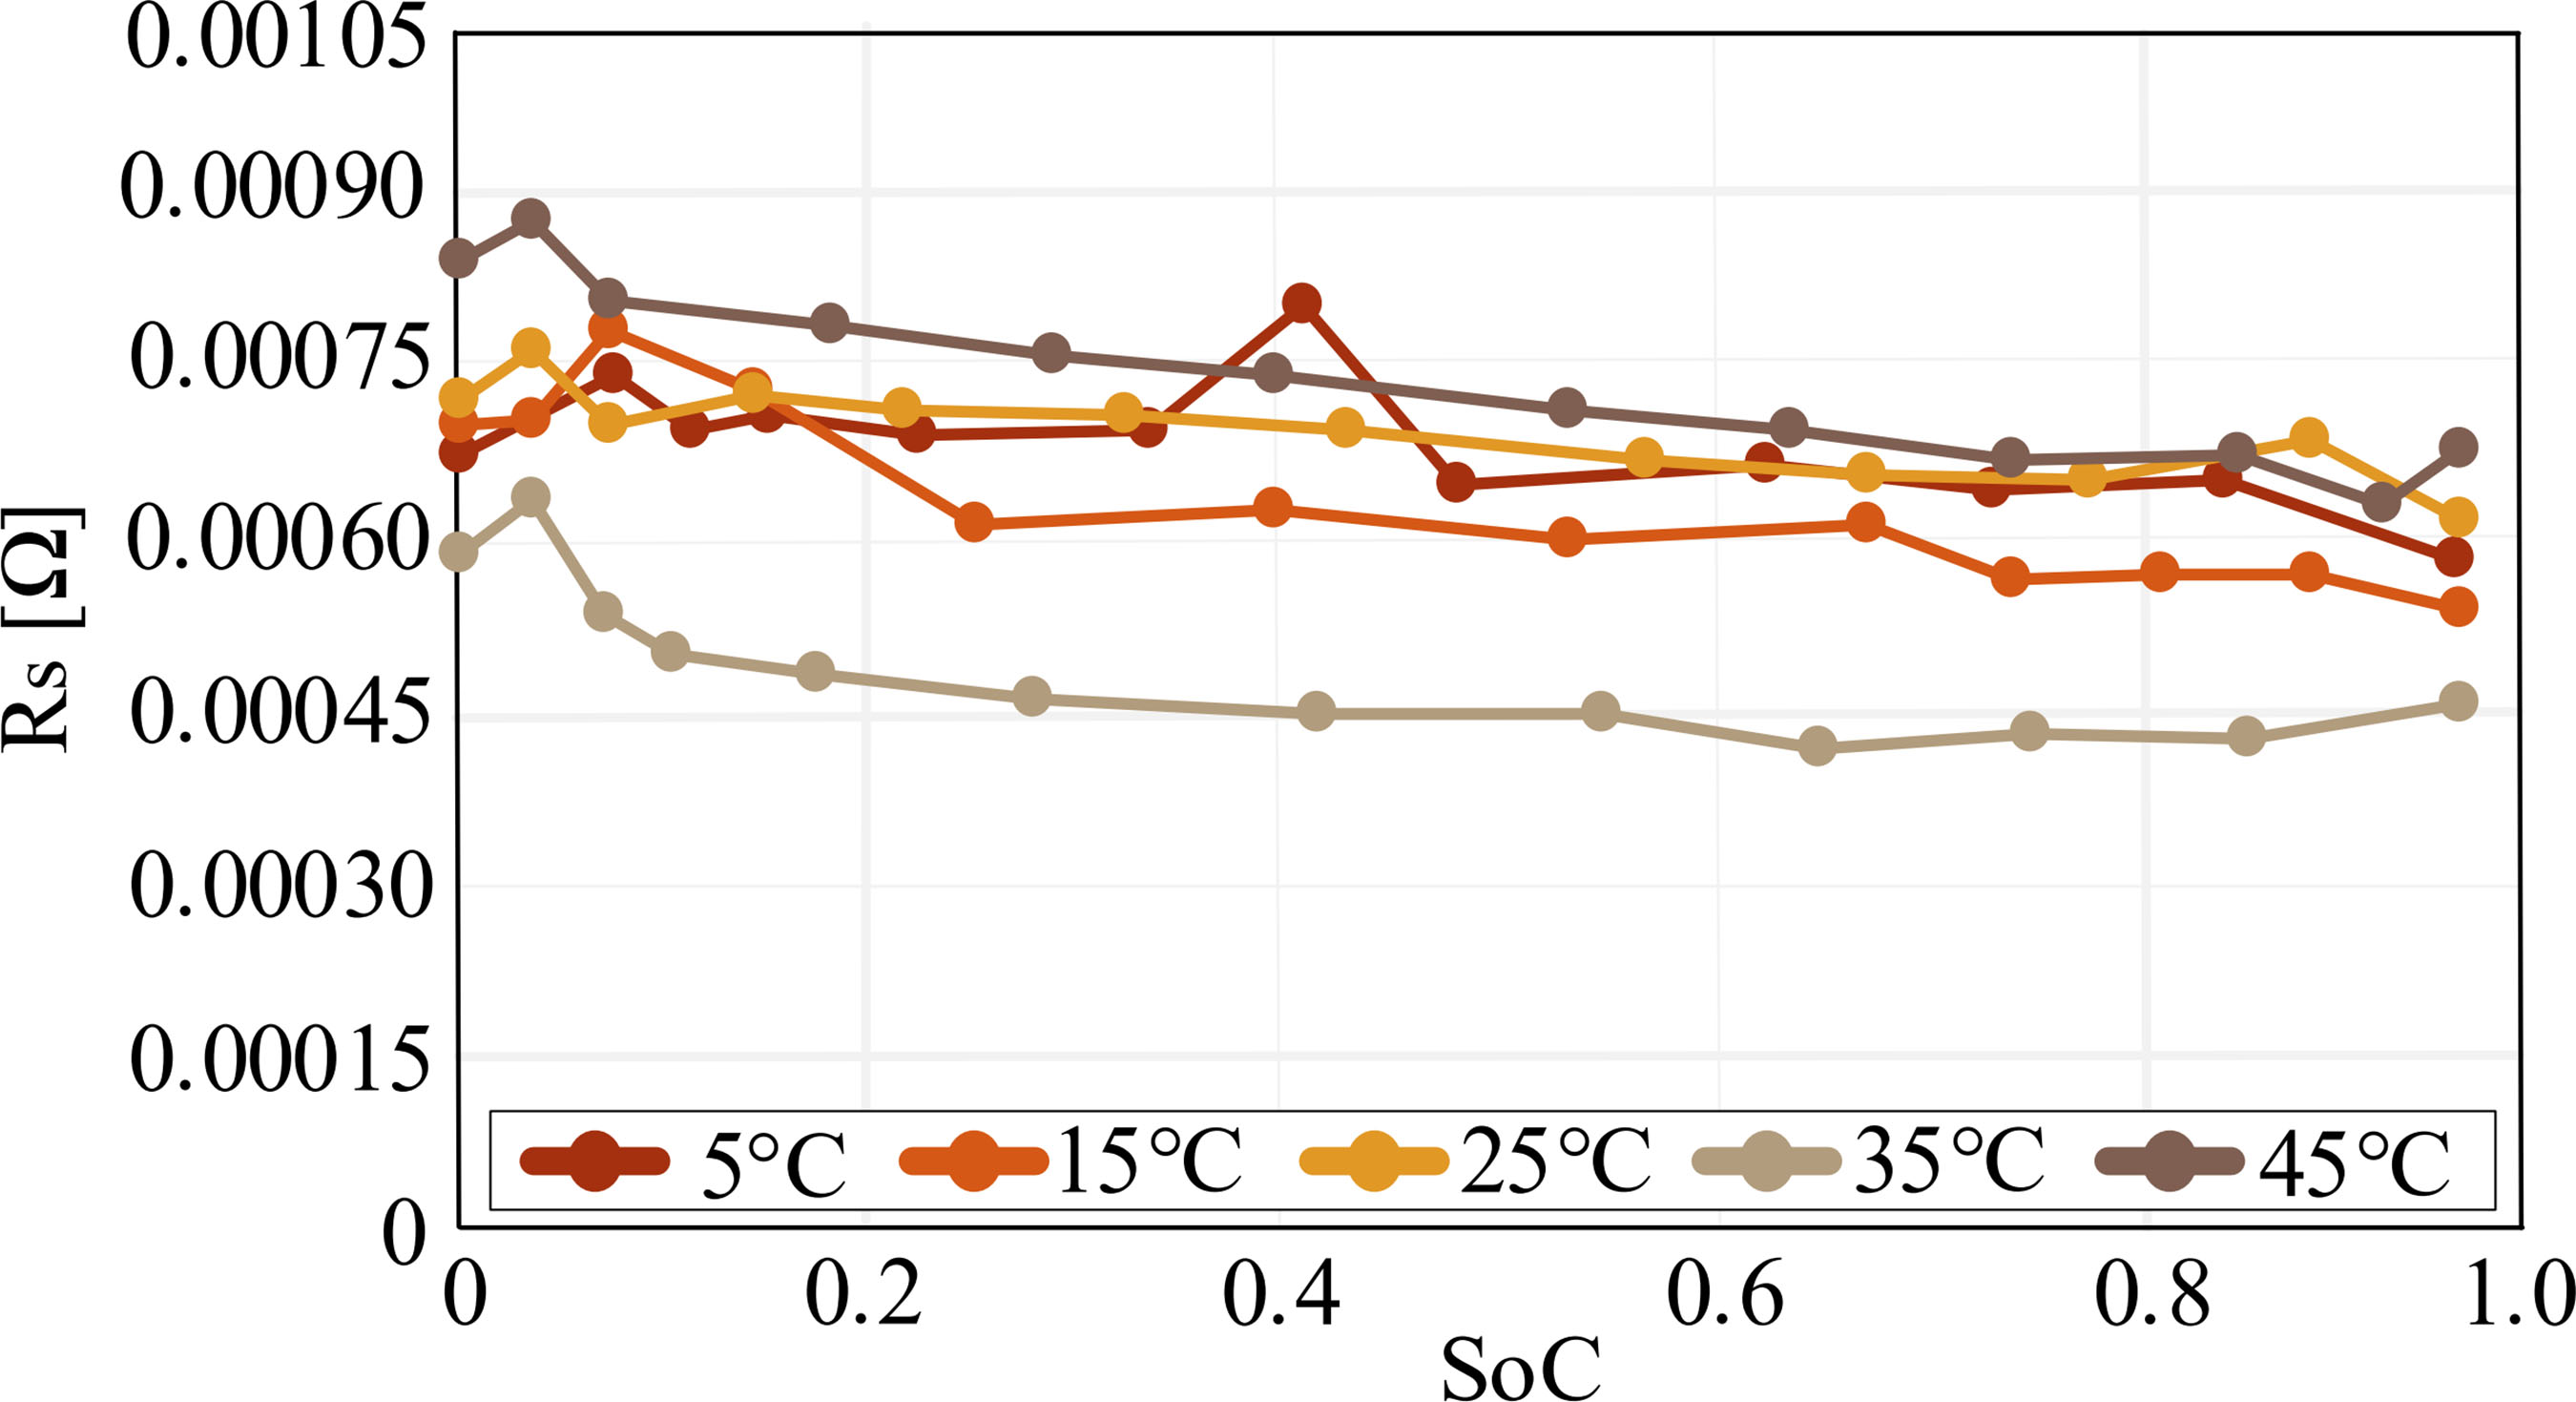
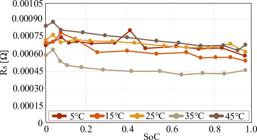
Once the equations for were defined, the parameters Rs, R1, , , and were determined. The parameter Rs was directly obtained through Ohm's law, by analyzing the voltage drop that occurs between rest and discharge shown in Fig. 18.
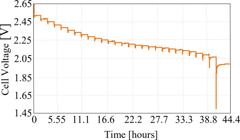
The pulsed methodology is effective, as it accurately captures open-circuit voltage points sufficient to characterize the dynamic effect, making it fully applicable in systems such as electric vehicles and battery energy storage systems. It should be noted that the performance of the method will always depend on the mathematical optimization model employed and the quality of the voltage measurements, in addition to the necessity of mapping the effect under different thermal conditions.
Applying the same numerical process to the transients that lead to the open-circuit voltage, as shown in Fig. 19, values of R1, , , and were generated for 12 out of the 28 discharge pulses, and the equation that relates them is presented in (17), which is an expansion of (2).
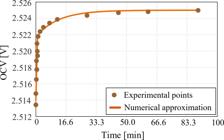
Experimental points associated with the first rest pulse in Fig. 18 and their numerical approximation.
Where z is the number of RC pairs.
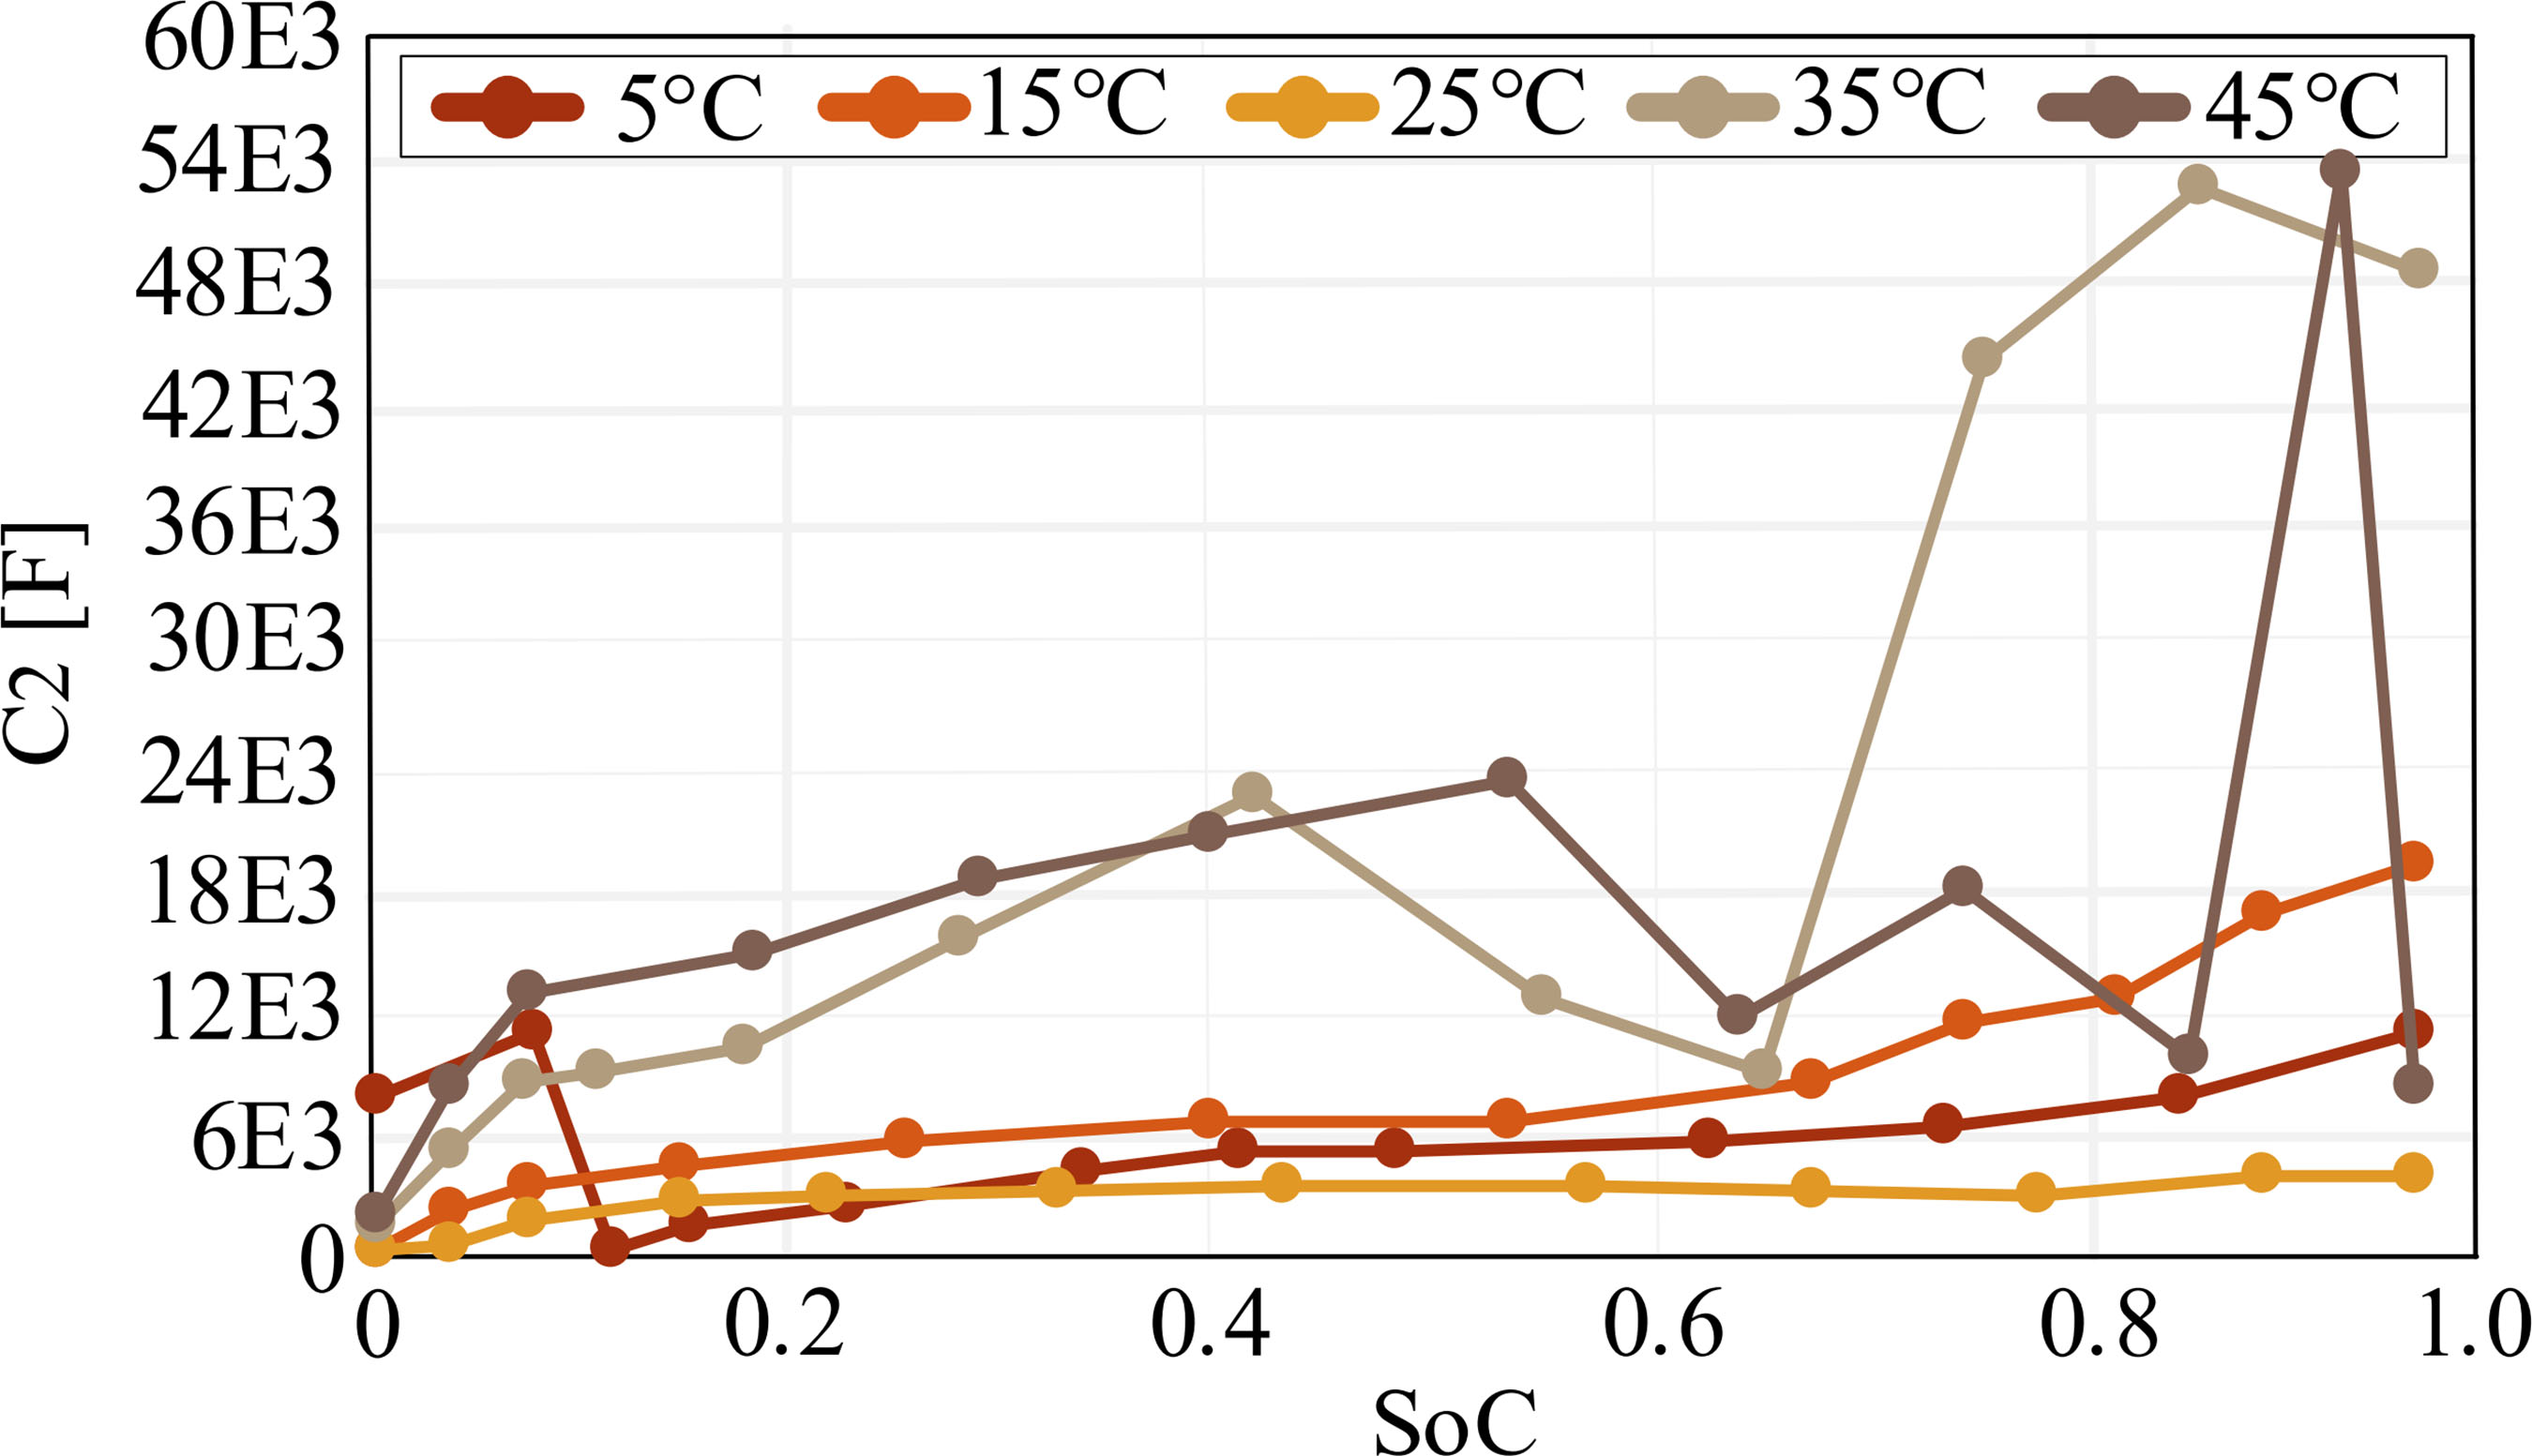
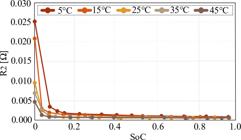
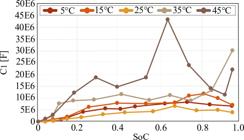
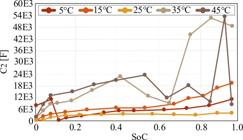
The values of capacitances and resistances for the 12 selected pulses at the 5 temperatures are graphically displayed in Fig. 20 for the series resistance, Fig. 21 for electrochemical polarization resistance, Fig. 22 for concentration polarization resistance, Fig. 23 for electrochemical polarization capacitance, and Fig. 24 for concentration polarization capacitance.
An increase in resistances R1 and is observed as the discharge progresses. The obtained capacitances exhibit two distinct magnitudes, which, when combined, can represent both slow dynamics () and fast dynamics ().

Regarding the accuracy of the results obtained for the series resistance, the time between reading acquisitions would need to be shorter, as the manufacturer specifies a series resistance of less than 0.5 mΩ as the default. Since the capacity indicates that the cell is in excellent condition, these higher resistance measurements are likely due to the deficiency in readings at lower sampling rates.
By obtaining parameterization of the OCV equation at various temperatures, as well as values for R1, , , , and , a dynamic model representing the cell was derived, serving as the foundation for the EKF algorithm to estimate the SoC.
C. SOC ESTIMATION RESULTS
By implementing the EKF algorithm using the data collected from the experiments, the estimation of SoC was obtained.
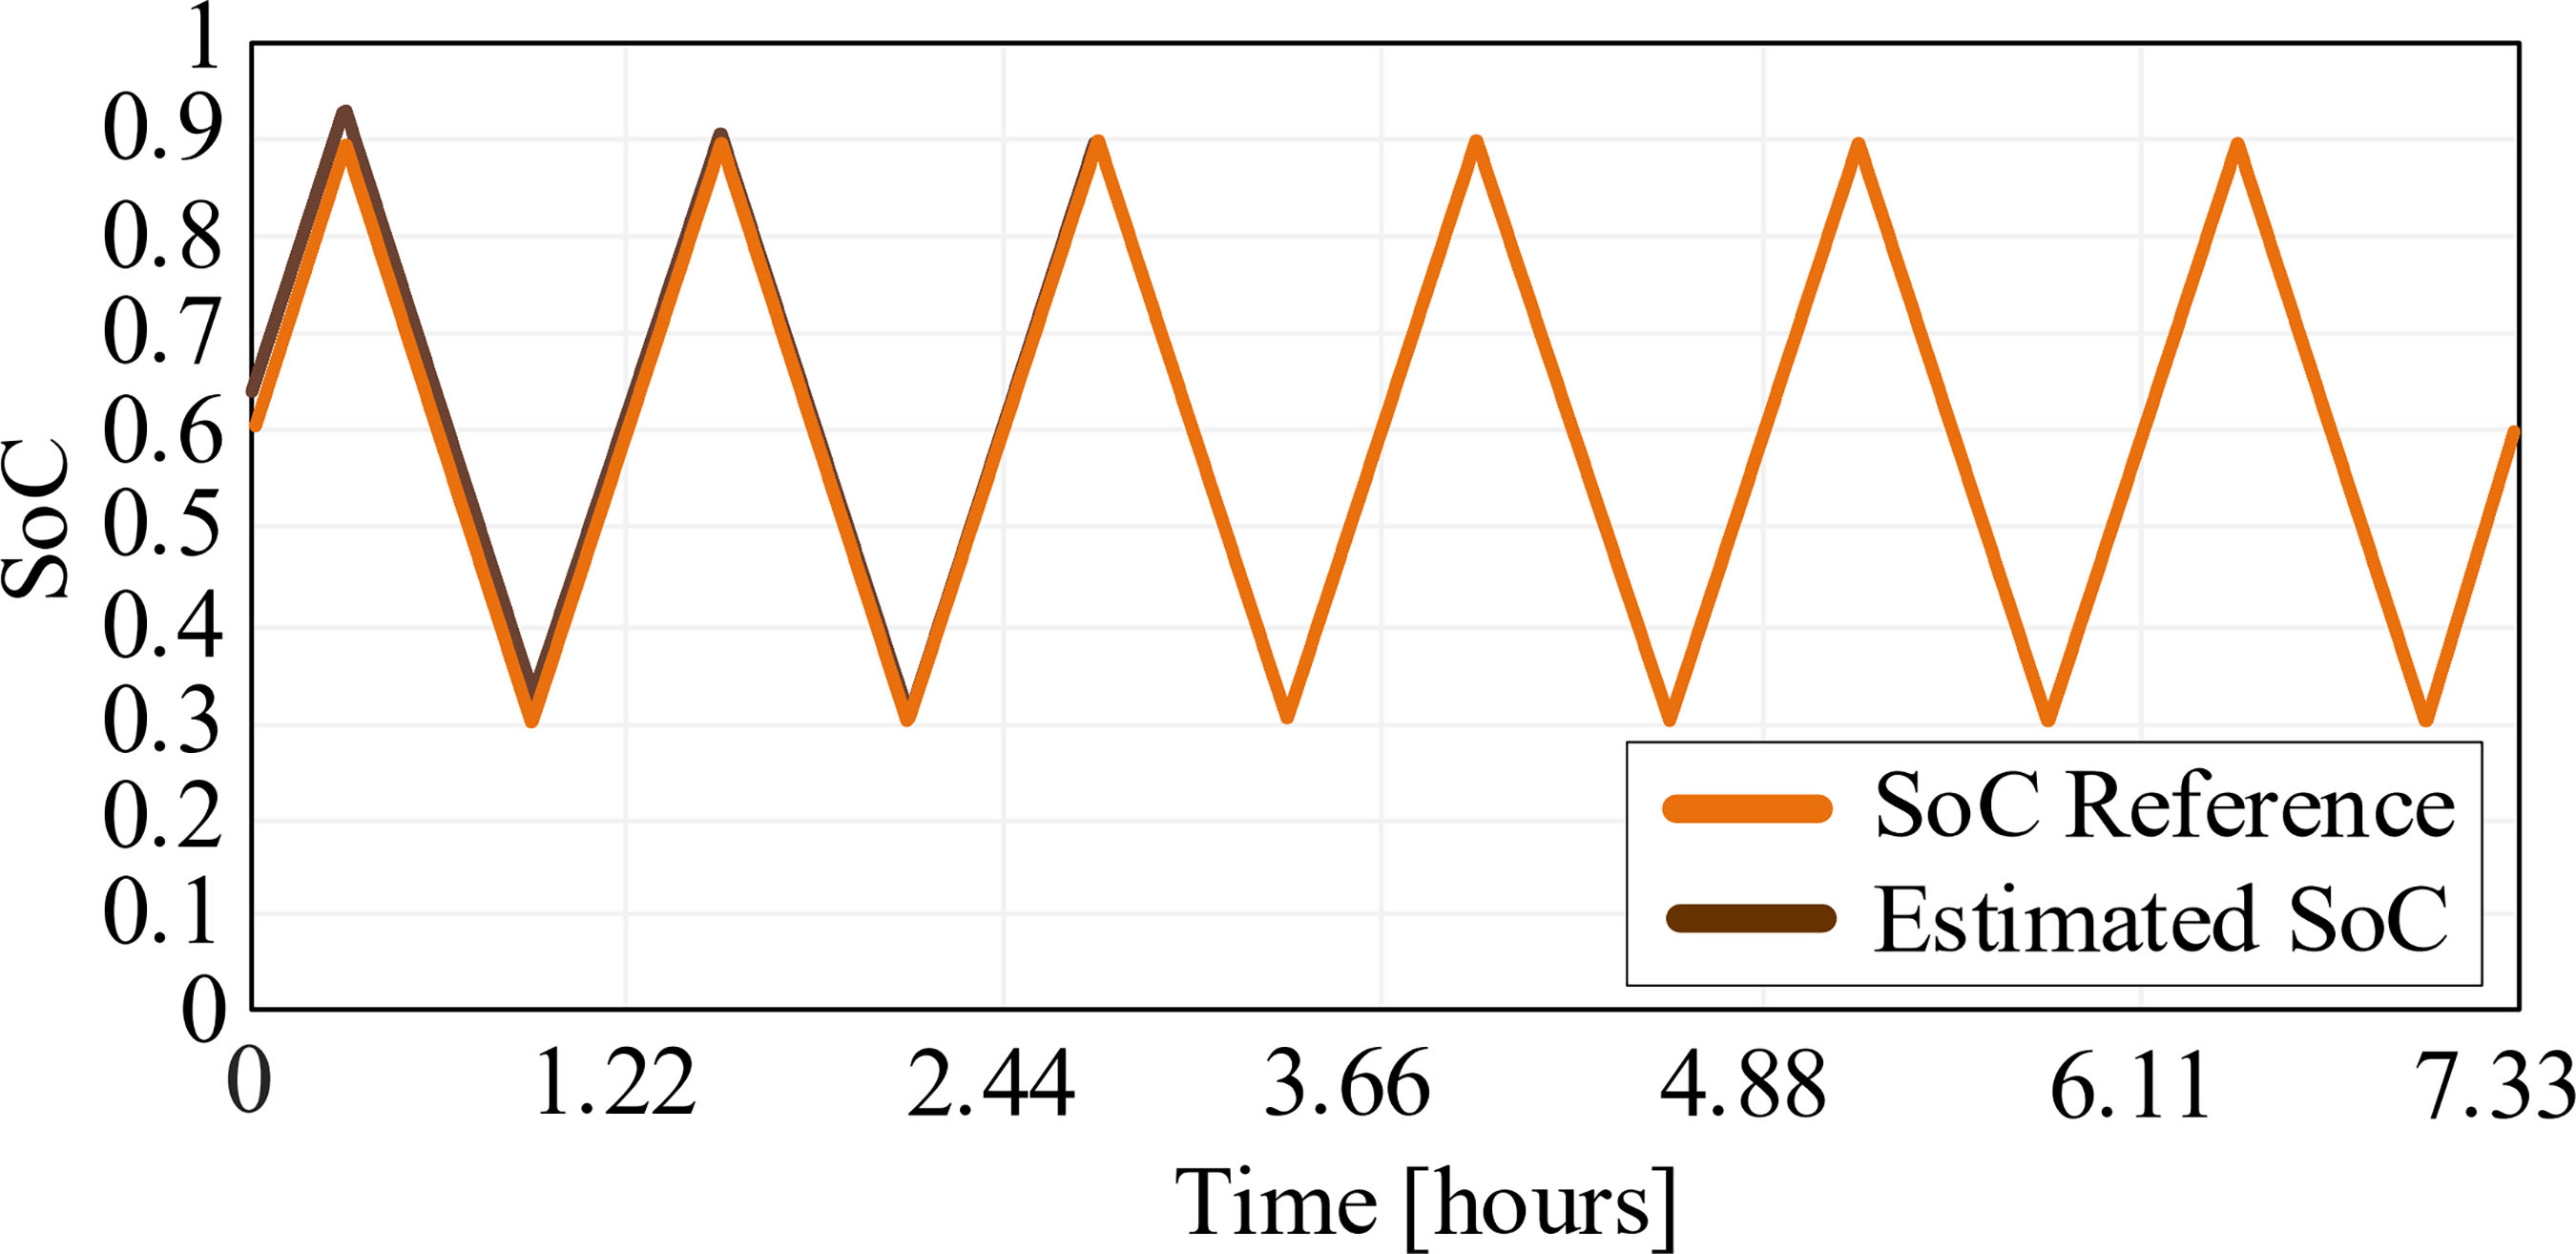
Considering the sensor readings from the charge and discharge current and voltage profiles presented in Fig. 25, at a temperature of 25°C, the cell is charged with a current value of 40 A and discharged at -40 A, with the test starting in the charging cycle. The voltage varies between the values of 2.419 V to 2.107 V, and with this voltage variation, the SoC varies between 90% and 30%. The cell has an initial voltage value of 2.2 V, and the initial SoC to be estimated corresponds to 60%.
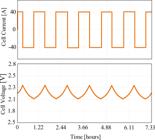
In this configuration, the duration of the charging period is 36.66 minutes, as is the duration of the discharge period, except for the initial charge, which takes approximately 18.33 minutes.
For the current profile presented in Fig. 25, as read by the test board, with an initial SoC value of 65% provided to the EKF algorithm, the behavior shown in Fig. 26 is obtained. In this configuration, it took approximately 3 complete charge cycles for the algorithm to estimate the state of charge with a relative error below 2%.

Reference SoC (Coulomb Counting) and SoC estimated by the EKF method (algorithm with an initial SoC of 65%).
VII. CONCLUSION
This paper presented an electronic load for characterizing parameters of equivalent circuit models of a lithium-ion battery cell for tests up to 80 A. The initial validation of the electronic load was performed solely using laboratory instrumentation equipment. In battery applications, the designed sensors will present errors within acceptable limits for voltage measurement and within the accuracy range of the resistor of the instrumentation, in the case of current measurement. Since the low accuracy is an intrinsic factor of the resistor of the instrumentation used, the associated error does not invalidate the proposed solution. The authors understand that an improvement in this component, in addition to replacing the manufacturing process of the first version of the prototype, is justified to improve the performance of the project.
The effectiveness of the modeling used to estimate the state of charge provides a strong indication that the test curves considered and obtained with the electronic load can provide data of sufficient quality to integrate reliable algorithms into the Battery Management System (BMS). However, for this validation, a comparative analysis with certified commercial equipment (e.g., a commercial battery cycler) needs to be developed. This would provide the reliability margin of the data obtained from the designed electronic load.
Acknowledgment
The authors express their gratitude to the Federal University of Santa Catarina (UFSC), the Institute of Power Electronics (INEP) and Vale S. A. for their collaboration and finance this work. This project was funded by the CNPq Brazilian program (National Council for Scientific and Technological Development).
-
PLAGIARISM POLICY
This article was submitted to the similarity system provided by Crossref and powered by iThenticate – Similarity Check.
REFERENCES
-
1 K. Vigerstol, “A Review of the Suitability of Lithium Battery Technology in ICT Energy Infrastructure,” IEEE International Telecommunications Energy Conference. Oct. 2017. Doi: 10.1109/INTLEC.2017.8214144
» https://doi.org/10.1109/INTLEC.2017.8214144 -
2 S. Kempston, S. R. Coles, F. Dahlmann, and K. Kirwan, "UK electric vehicle battery supply chain sustainability: A systematic review," Renewable and Sustainable Energy Reviews Jan. 2025. Doi: 10.1016/j.rser.2024.115216
» https://doi.org/10.1016/j.rser.2024.115216 -
3 D. A. Cantane, O. H. Ando Junior, and M. B. Hamerschmidt, “Tecnologias de Armazenamento de Energia Aplicadas ao Setor Elétrico Brasileiro,” Editora Scienza, Vol.1, 2020. Doi: 10.26626/978-65-5668-013-2.2020B0001
» https://doi.org/10.26626/978-65-5668-013-2.2020B0001 -
4 Z. Tao, Z. Zhao, C. Wang, L. Huang, H. Jie, H. Li, Q. Hao, Y. Zhou, and K. Y. See, "State of charge estimation of lithium batteries: Review for equivalent circuit model methods," Measurement Aug. 2024. Doi: 10.1016/j.measurement.2024.115148
» https://doi.org/10.1016/j.measurement.2024.115148 -
5 H. Rahimi-Eichi, U. Ojha, F. Baronti, and M. Chow, “Battery Management System: An Overview of Its Application in the Smart Grid and Electric Vehicles,” IEEE Industrial Electronics Magazine, pp. 4-16. Jun. 2013. Doi: 10.1109/MIE.2013.2250351
» https://doi.org/10.1109/MIE.2013.2250351 - 6 G. L. Plett, “Battery Management Systems: Battery Modeling,” Volume I. Artech House, pp. 0-323, 2015.
-
7 M. Chen, and G. A. Rincón-Mora, “Accurate Electrical Battery Model Capable of Predicting Runtime and I–V Performance,” IEEE Transactions on Energy Conversion, Vol. 21, no. 2, pp. 504-511, Jun. 2006. Doi: 10.1109/TEC.2006.874229
» https://doi.org/10.1109/TEC.2006.874229 -
8 S. Bampi, G.Waltrich and A. Vaccari, “Real-Time State-of-Charge Estimation in Lithium-Ion Batteries Using Extended Kalman Filter,” IEEE 8th Southern Power Electronics Conference and 17th Brazilian Power Electronics Conference (SPEC/COBEP), 2023. Doi: 10.1109/SPEC56436.2023.10408586
» https://doi.org/10.1109/SPEC56436.2023.10408586 - 9 D. Larson, “How to Design an Optimal Electronic Load for High-Current, Low Voltage Power Supplies (Part 1, 2, 3),” Electronic Design, Apr. 2020.
-
10 E. Duran, M. Piliougine, M. Sidrach-de-Cardona, J. Galan, and J. M. Andujar, “Different methods to obtain the I–V curve of PV modules: A review,” 33rd IEEE Photovolatic Specialists Conference, 2008. Doi: 10.1109/PVSC.2008.4922578
» https://doi.org/10.1109/PVSC.2008.4922578 - 11 D. C. Martins, and I. Barbi, “Conversores CC-CC Básicos Não Isolados,” 4ª ed. Florianópolis, 2011.
- 12 M. Polasek, and M. Danko, "Testing of batteries used in electric cars," ELEKTRO. Krakow, Poland. 2022.
-
13 E. Vergori, F. Mocera, and A. Somà,"Battery modeling and simulation using a programmable testing equipment," 9th Computer Science and Electronic Engineering (CEEC), 2017. Doi: 10.1109/CEEC.2017.8101618
» https://doi.org/10.1109/CEEC.2017.8101618 -
14 J. Fan, W. He, C. Hendricks, M. Pecht, and K. Yung, "A practical design of reliability and performance test for portable lithium-ion batteries," IEEE International Conference on Information and Automation, 2015. Doi: 10.1109/ICInfA.2015.7279274
» https://doi.org/10.1109/ICInfA.2015.7279274 -
15 A. Marongiu, A. Damiano, and M. Heuer, "Experimental analysis of lithium iron phosphate battery performances," IEEE International Symposium on Industrial Electronics, 2010. Doi: 10.1109/ISIE.2010.5637749
» https://doi.org/10.1109/ISIE.2010.5637749 - 16 WinAck, "Battery Cycler Battery Module Test Equipment," Xiamen Winack Battery Technology CO. LTD, 2024.
-
17 X. Zeng, L. Chen, X. Xia, Y. Sun, and J. Yue, "Modeling of temperature characteristics of lithium-ion batteries considering the state dependency and its robust estimation of internal temperature," Journal of Power Sources Jan. 2025. Doi: 10.1016/j.jpowsour.2025.236432
» https://doi.org/10.1016/j.jpowsour.2025.236432 -
18 Q. Li, R. Li, K. Ji, and W. Dai, “Kalman Filter and Its Application,” 8th International Conference on Intelligent Networks and Intelligent Systems, Nov. 2015. Doi: 10.1109/ICINIS.2015.35
» https://doi.org/10.1109/ICINIS.2015.35 - 19 D. C. Martins, “Eletrônica de Potência Transistores de Potência,” Ed. of the author. Florianópolis, 2018..
-
20 T. iDevices, "Produtos iDevices," URL: https://idevices.com.br/contato/ Jan. 2025.
» https://idevices.com.br/contato/ -
21 G. A. P. Rao, and SR S. Kumar, “A Review of Integrated Battery Thermal Management Systems for Lithium-Ion Batteries of Electric Vehicles,” e-Prime Advances in Electrical Engineering, Electronics and Energy, 2024. Doi: 10.1016/j.prime.2024.100526
» https://doi.org/10.1016/j.prime.2024.100526 -
22 A. Belgibayeva, A. Rakhmetova, M. Rakhatkyzy, M. Kairova, I. Mukushev, N. Issatayev, G. Kalimuldina, A. Nurpeissova, Y. Sun, and Z. Bakenov, “Lithium-ion batteries for low-temperature applications: Limiting factors and solutions,” Journal of Power Sources, 2023. Doi: 10.1016/j.jpowsour.2022.232550
» https://doi.org/10.1016/j.jpowsour.2022.232550 - 23 H. P. Gavin, “The Levenberg-Marquardt algorithm for nonlinear least squares curve-fitting problems,” 2020.
Edited by
-
Associate Editor
Allan F. Cupertino https://orcid.org/0000-0001-8418-1985
-
Editor-in-Chief
Heverton A. Pereira https://orcid.org/0000-0003-0710-7815