
 Os efeitos dos choques de incerteza imobiliária na dinâmica econômica em nível estadual
Neste artigo, analisamos como os choques de incerteza no mercado imobiliário afetam a economia de diferentes estados dos EUA. Primeiramente, construímos uma medida de incerteza imobiliária para cada estado. Utilizando esta medida, estimamos um modelo Bayesiano de Vetor Autorregressivo em Painel para obter funções de resposta ao impulso a choques de incerteza imobiliária. Examinamos então quais as características estaduais podem explicar as variações nas respostas da atividade econômica a estes choques. Os nossos resultados mostram que os choques de incerteza imobiliária têm efeitos adversos sobre a atividade econômica, com intensidades variadas entre os estados. Mostramos também que os impactos adversos sobre a renda são maiores em estados com uma elevada proporção do setor financeiro, de construção e de transformação, bem como uma grande proporção de bancos pequenos. Por outro lado, estados que alocam mais recursos para políticas de bem-estar sofrem impactos menores.
Palavras-chaves:
Incerteza do setor imobiliário; Choques de incerteza; Atividade econômica; PVAR Bayesiano
 Thumbnail
 Thumbnail
 Thumbnail
 Thumbnail
 Thumbnail
 Thumbnail
 Thumbnail
 Thumbnail
 Thumbnail
 Thumbnail
 Thumbnail
 Thumbnail
 Thumbnail
 Thumbnail
 Thumbnail
 Thumbnail
 Thumbnail
 Thumbnail
 Thumbnail
 Thumbnail
 Thumbnail
 Note: The figure shows the composition of GDP by economic sector. The data is the sectorial average among the states that make up each region. Source: Authors’ elaboration.
 Note: Small banks are defined as at or below the 90th percentile of the national distribution of bank size by assets. Source: Authors’ elaboration.
 Note: The vacancy rate for rental properties is defined as the proportion of vacant properties among those available for rent. Source: Authors’ elaboration.
 Note: The figure shows the regional average of state-level debt as a share of total expenditure. Source: Authors’ elaboration.
 Note: The solid line represents the median of state-level real estate uncertainties, SREU, between the second quarter of 1995 and the last quarter of 2017. The dashed horizontal line indicates 1.65 standard deviations above the series average, representing periods of high uncertainty. Source: Authors’ elaboration.
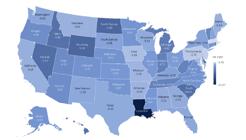
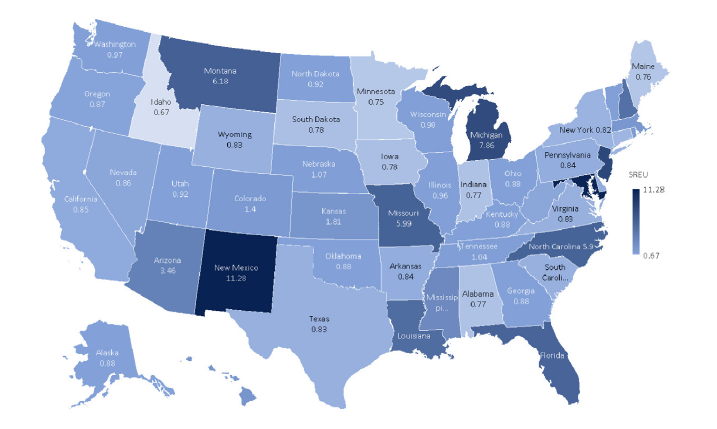 Note: The map shows the median, for each state, of the State Real Estate Uncertainty - SREU between the second quarter of 1995 and the last quarter of 2017. Darker colors reflect higher levels of uncertainty. Source: Authors’ elaboration.

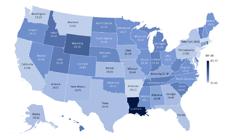
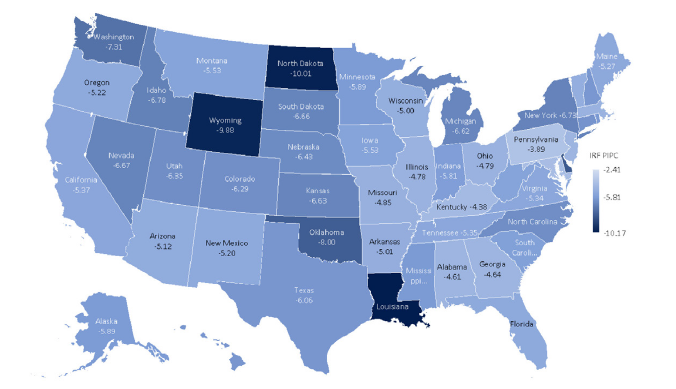 Note: The map depicts the cumulative responses of personal income per capita in each state to one standard deviation shock in state-level real estate uncertainty. Darker colors indicate more pronounced responses to the state-level real estate uncertainty shock. Source: Authors’ elaboration.
 Note: The map displays the accumulated employment responses in each state to one standard deviation shock in state-level real estate uncertainty. Darker colors indicate more pronounced responses to the state- level real estate uncertainty shock. Source: Authors’ elaboration.
 Note(s): The map shows the cumulative responses of the unemployment rate in each state to one standard deviation shock in state-level real estate uncertainty. Darker colors indicate more pronounced responses to the state-level real estate uncertainty shock. Source: Authors’ elaboration.
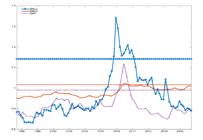
 Note: The crossed line represents the median state real estate uncertainty (SREU), while the solid line represents national real estate uncertainty (NREU), created by
  Note: Impulse response functions to a one standard deviation shock in the real estate market uncertainty measure. The solid line represents the median state-level responses to a state real estate uncertainty shock created by this study. The red dotted line represents the median state-level responses to a national real estate uncertainty shock created by
  Note(s): Impulse response functions to a one standard deviation shock in the real estate market uncertainty measure. The solid line represents the median state-level responses to a state real estate uncertainty shock created by this study (baseline). The dotted line represents the median state-level responses to a national real estate uncertainty shock without a real estate price index. The dashed and dashed-dotted lines represent the 68% credibility interval. Responses are multiplied by 100 to depict the percentage variation. Source: Authors’ elaboration.
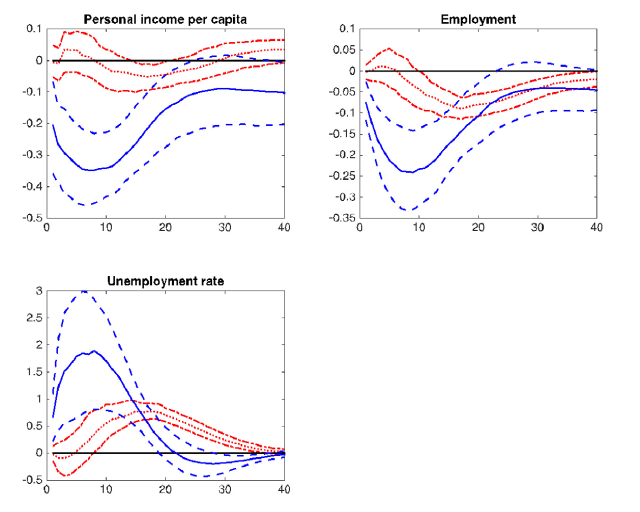 Note(s): The solid blue line represents impulse response functions to a one standard deviation shock in the state-level real estate uncertainty with recursive identification. The solid red line represents the impulse response functions to a one standard deviation shock in the state-level real estate uncertainty with signal restriction identification (baseline). Dashed lines represent the 68% credibility interval. Responses are multiplied by 100 to depict the percentage variation. Source: Authors’ elaboration.
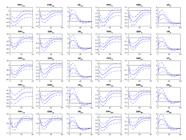
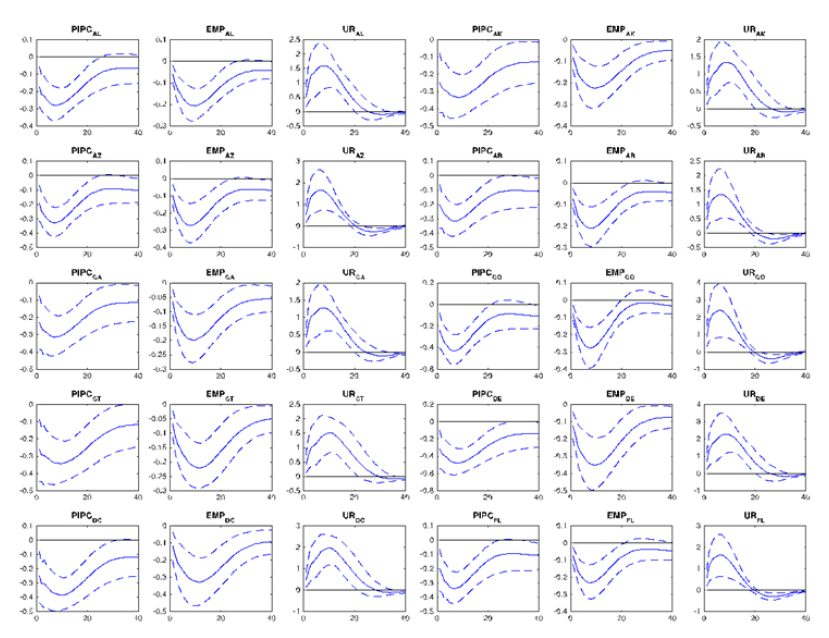 Note(s): Impulse-response functions to a one standard deviation shock in the real estate market uncertainty measure. The solid line represents the impulse-response functions of personal income per capita (PIPC), employment (EMP), and unemployment rate (UR) for Alabama (AL), Alaska (AK), Arizona (AZ), Arkansas (AR), California (CA), Colorado (CO), Connecticut (CT), Delaware (DE), District of Columbia (DC) and Florida (FL) to a one standard deviation uncertainty shock. The dashed lines represent the 68% credibility interval. Source: Authors’ elaboration.
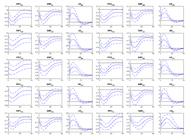
 Note(s): Impulse-response functions to a one standard deviation shock in the real estate market uncertainty measure. The solid line represents the impulse-response functions of per capita personal income (PIPC), employment (EMP), and unemployment rate (UR) for Georgia (GA), Hawaii (HI), Idaho (ID), Illinois (IL), Indiana (IN), Iowa (IA), Kansas (KS), Kentucky (KY), Louisiana (LA) and Maine (ME) to a one standard deviation uncertainty shock. The dashed lines represent the 68% credibility interval. Source: Authors’ elaboration.
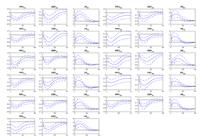
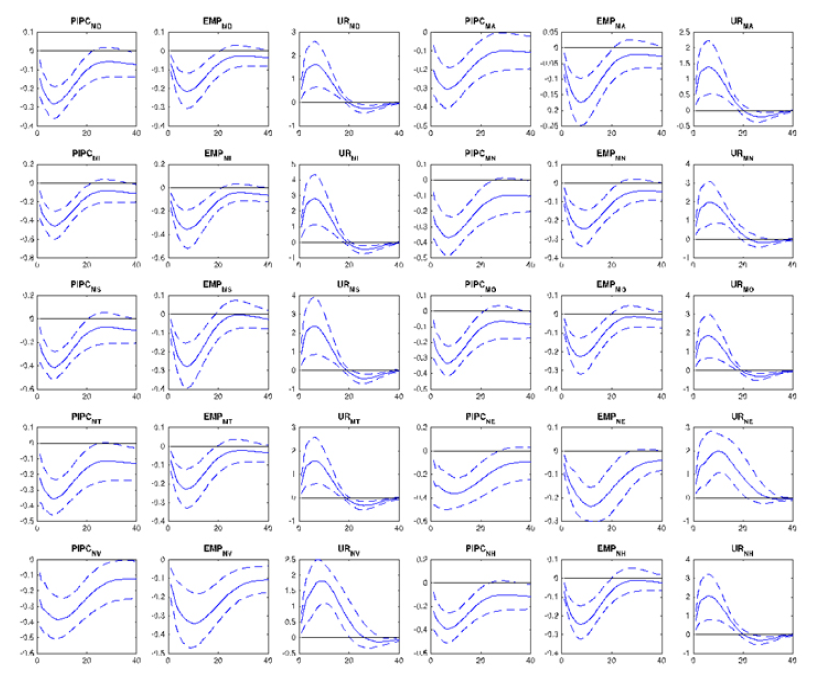 Note: Impulse-response functions to a one standard deviation shock in the real estate market uncertainty measure. The solid line represents the impulse-response functions of per capita personal income (PIPC), employment (EMP), and unemployment rate (UR) for Maryland (MD), Massachusetts (MA), Michigan (MI), Minnesota (MN), Mississippi (MS), Missouri (MO), Montana (MT), Nebraska (NE), Nevada (NV) and New Hampshire (NH) to a one standard deviation uncertainty shock. The dashed lines represent the 68% credibility interval. Source: Authors’ elaboration.
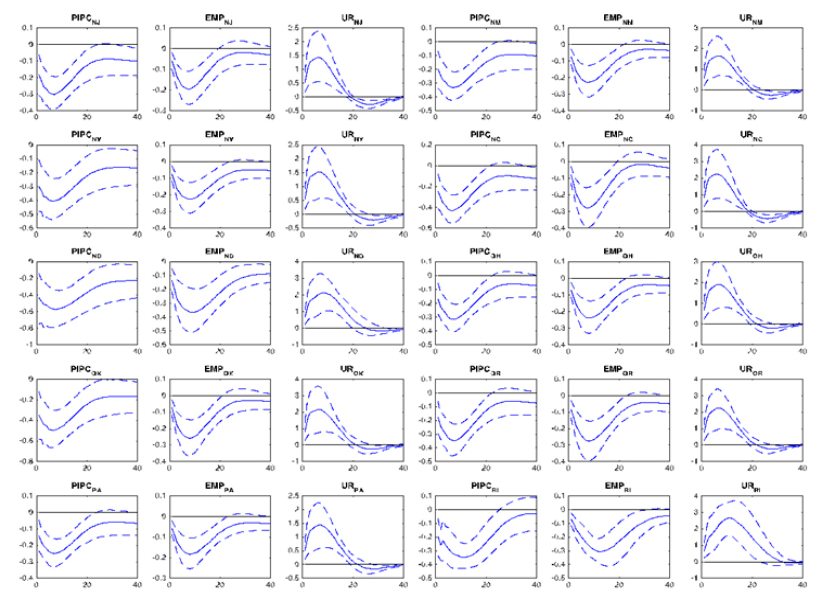 Note(s): Impulse-response functions to a one standard deviation shock in the real estate market uncertainty measure. The solid line represents the impulse-response functions of per capita personal income (PIPC), employment (EMP), and unemployment rate (UR) for New Jersey (NJ), New Mexico (NM), New York (NY), North Carolina (NC), North Dakota (ND), Ohio (OH), Oklahoma (OK), Oregon (OR), Pennsylvania (PA) and Rhode Island (RI) to a one standard deviation uncertainty shock. The dashed lines represent the 68% credibility interval. Source: Authors’ elaboration.
 Note(s): Impulse-response functions to a one standard deviation shock in the real estate market uncertainty measure. The solid line represents the impulse-response functions of per capita personal income (PIPC), employment (EMP), and unemployment rate (UR) for South Carolina (SC), South Dakota (SD), Tennessee (TN), Texas (TX), Utah (UT), Vermont (VT), Virginia (VA), Washington (WA), West Virginia (WV), Wisconsin (WI), and Wyoming (WY) to a one standard deviation uncertainty shock. The dashed lines represent the 68% credibility interval. Source: Authors’ elaboration.
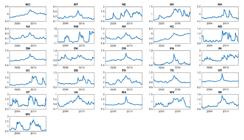
 Note: State Real Estate Uncertainty - SREU in the states of Alabama (AL), Alaska (AK), Arizona (AZ), Arkansas (AR), California (CA), Colorado (CO), Connecticut (CT), Delaware (DE), District of Columbia (DC), Florida (FL), Georgia (GA), Hawaii (HI), Idaho (ID), Illinois (IL), Indiana (IN), Iowa (IA), Kansas (KS), Kentucky (KY), Louisiana (LA), Maine (ME), Maryland (MD), Massachusetts (MA), Michigan (MI), Minnesota (MN), and Mississippi (MS). Source: Authors’ elaboration.
 Note: State Real Estate Uncertainty - SREU in the states of Missouri (MO), Montana (MT), Nebraska (NE), Nevada (NV), New Hampshire (NH), New Jersey (NJ), New Mexico (NM), New York (NY), North Carolina (NC), North Dakota (ND), Ohio (OH), Oklahoma (OK), Oregon (OR), Pennsylvania (PA), Rhode Island (RI), South Carolina (SC), South Dakota (SD), Tennessee (TN), Texas (TX), Utah (UT), Vermont (VT), Virginia (VA), Washington (WA), West Virginia (WV), Wisconsin (WI), and Wyoming (WY). Source: Authors’ elaboration.