 Occurrence, frequency, and trends of heatwaves and cold spells in Maputo under climate change conditions (1984-2023)
Abstract
This study analyzed changes in temperature extremes in Maputo, Mozambique, focusing on heatwave and cold-spell frequency and duration in the context of climate change and their direct impacts on agrometeorology and plant-soil-atmosphere relationships. Using daily maximum and minimum temperature data from the ERA5-LAND reanalysis database for the period 1984–2023, rigorously validated with an imputation RMSE of 0.05 °C and emphasizing the climatological normal for 1991–2020 computed through a mathematically robust 5-day moving window, the study applied indices recommended by the World Meteorological Organization (WMO) and the Expert Team on Climate Change Detection and Indices (ETCCDI). These indices include daily percentiles for hot days (TX90p) and cold nights (TN10p), as well as duration indices for heatwaves (WSDI) and cold spells (CSDI), assessed using Sen's slope estimator and the non-parametric Mann-Kendall test. Results indicate that over the last three decades, a non-significant increase occurred in the frequency of hot days (p = 0.144), accompanied by a decrease in the frequency of cold nights (p = 0.161), as well as a non-significant decline in the number of cold spells (p = 0.243). Although the trend in heatwaves was not statistically significant throughout the study period (p = 0.418), an apparent episodic intensification has occurred since 2010, particularly during years associated with El Niño events. These findings are essential for developing public policies focused on adaptation of climate change, urban planning, and resilience strategies, particularly in agricultural, health, and infrastructure sectors in Maputo. In addition, they reinforce the importance of continuous monitoring of temperature extremes to mitigate adverse impacts of climate change, not only in Maputo but also in other coastal cities across Southern Africa.
Keywords:
climate extremes; climate trends; global warming; urban climate; ETCCDI; agrometeorology; crop thermal stress
Introduction
Rising global temperatures and climate variability observed over recent decades highlight a concerning phenomenon: the intensification of thermal extremes, particularly heatwaves and cold spells. These events directly affect ecosystems, food security, public health, and socioeconomic infrastructure, especially in vulnerable regions (IPCC, 2023; Engelbrecht et al., 2024).
Southern Africa has shown high sensitivity to climate change, characterized by increasing mean temperatures and reduced frequency of extreme cold events, consistent with long-term projections for tropical and subtropical regions (Ringard et al., 2016; Denissen et al., 2024).
Climate extremes are not solely a consequence of global warming; rather, they result from complex interactions among meteorological and atmospheric variables, including air circulation patterns, oceanic anomalies, and interannual variability modulated by events such as El Niño and La Niña (Kunda et al., 2024).
In Mozambique, Maputo is particularly vulnerable to thermal extremes because of combined geographic and urban factors. As the capital city, it has high population density, precarious infrastructure, and considerable socioeconomic vulnerability (Macucule et al., 2022; IPCC, 2023; Kunda et al., 2024). Its location along the Indian Ocean coast exposes the city to cyclonic events and variability associated with the Southern Oscillation Index. Simultaneously, urban dynamics, such as unplanned expansion and increasing impervious surfaces, intensify urban heat island effects (Jury, 2019).
Heatwaves have been associated with increased mortality and morbidity, particularly among vulnerable groups such as older adults, children, and individuals with cardiovascular and respiratory comorbidities (Bell et al., 2018). In Maputo, where a substantial proportion of the population depends on precarious infrastructure and informal housing, prolonged exposure to high temperatures may compromise the body's natural cooling mechanisms, increasing the risk of dehydration and hyperthermia (Kunda et al., 2024).
Research indicates that temperatures exceeding 35 °C substantially increase the risk of heatstroke and heat exhaustion, particularly in densely built urban environments (Engelbrecht et al., 2024). Although less frequent, cold spells continue to represent a significant risk, especially for socially vulnerable populations with limited access to effective heating systems (Chikoore et al., 2024).
During winter, sudden temperature declines may trigger respiratory and cardiovascular complications while increasing electricity demand for heating, placing additional pressure on local energy infrastructure (Iyakaremye et al., 2020). Moreover, impacts on agricultural production are evident, as freezing temperatures may hinder germination, growth, and yield of important crops such as maize and rice, thereby aggravating food insecurity in the region (Parkes et al., 2022). From a thermodynamic perspective, these thermal shifts fundamentally alter plant-soil-atmosphere relationships. Extreme heat accelerates soil moisture depletion through increased atmospheric evaporative demand (Allen et al., 1998; Grossiord et al., 2020), pushing crops beyond physiological thresholds and disrupting critical phenological stages, which may lead to significant yield losses in C4 crops such as maize (Ortiz-Bobea et al., 2021; Eichelmann et al., 2021).
Scientific literature indicates a continuous rise in mean temperatures across Southern Africa, with projections suggesting that extreme heat events will become more frequent and intense over the coming decades (Engelbrecht et al., 2024). Climate simulations indicate that annual mean temperature may increase by 2.5 °C to 4 °C by the end of the 21st century, depending on greenhouse gas emission scenarios (IPCC, 2023).
This increase is not restricted to mean temperatures but is also associated with amplified thermal extremes, with prolonged heatwaves becoming more frequent and cold events becoming increasingly rare (Ringard et al., 2016). Climate time-series analyses for Maputo indicate an acceleration in heatwave occurrence over the last three decades, with drought and high-temperature events reported between 2015 and 2023 (Kunda et al., 2024).
These trends are consistent with patterns observed in other East African coastal cities, where rapid urbanization and environmental degradation have intensified local thermal anomalies (Denissen et al., 2024). Mitigation and adaptation strategies have been recommended to reduce adverse impacts, including policies aimed at expanding urban green areas, improving energy efficiency, and strengthening infrastructure resilience (Jury, 2019).
Despite these advances, an important gap remains. Existing studies frequently lack continuous, high-resolution quantification of ETCCDI indices specifically focused on Maputo's urban-continental interface, where maritime influences may mask the actual severity of heat accumulation over land. Furthermore, integrated analyses connecting atmospheric trends with direct agrometeorological implications remain limited.
Considering these aspects, this study aimed to quantify trends in the frequency, duration, and intensity of heatwaves and cold spells in Maputo, Mozambique, over four decades (1984–2023), while analyzing their seasonal distribution and discussing their direct impacts on agrometeorological stability and regional food security.
Material and Methods
Study Area
The city of Maputo, capital of Mozambique, is located on the southeastern coast of Africa (25.9°S, 32.6°E). The region has a humid subtropical climate with a dry season (Cwa, according to the Köppen–Geiger climate classification), characterized by hot, rainy summers and mild, dry winters (Beck et al., 2018).
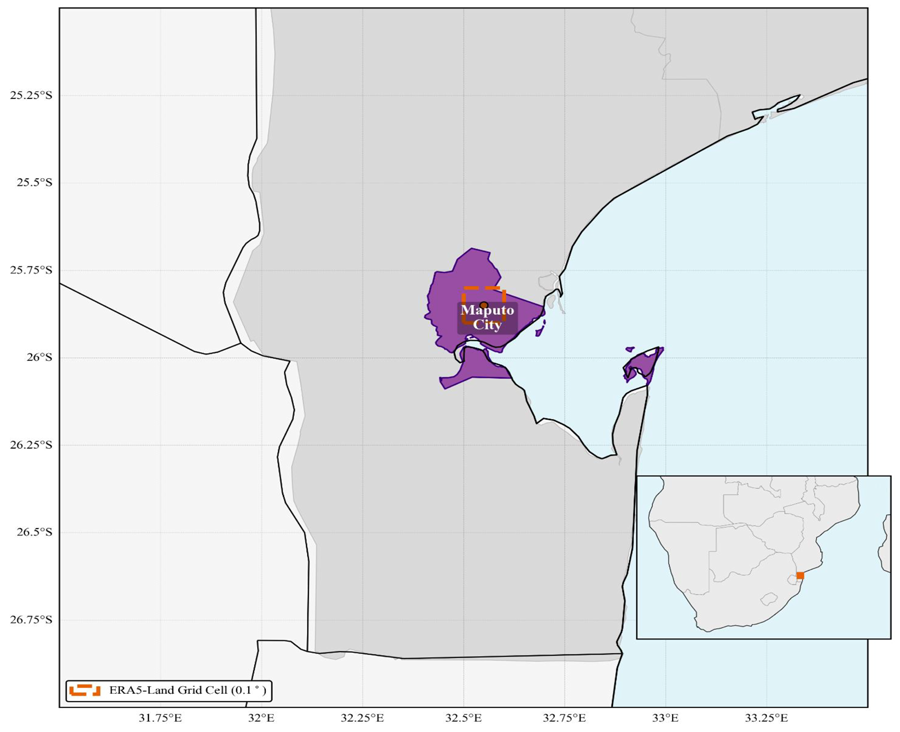
Temperature data from the ERA5-Land reanalysis dataset, developed by the European Centre for Medium-Range Weather Forecasts (ECMWF) and made available through the Copernicus Climate Data Store (CDS), were used. This dataset provides global coverage at a spatial resolution of 0.1° × 0.1°. Maximum (Tmax) and minimum (Tmin) temperature variables were extracted and aggregated daily for the grid cell representative of Maputo, covering the period from January 1, 1984, to December 31, 2023. ERA5-Land was selected because of the historical discontinuity and sparse distribution of local ground-based meteorological stations, providing a physically consistent and continuous dataset essential for long-term agrometeorological assessments. The geographic delimitation of the selected urban-continental domain, highlighting the exact position of the extraction grid cell to isolate terrestrial thermodynamic fluxes from maritime influence, is presented in Figure 1

Pre-processing and Data Imputation
Time series underwent rigorous quality control, including checks for temporal consistency and removal of duplicate records. To standardize the annual calendar for climatological analyses, February 29 records were removed from leap years. Occasional missing values were filled using the Iterative SVD multivariate imputation algorithm (Troyanskaya et al., 2001), which preserves correlations among variables. To validate imputation reliability, a random masking cross-validation procedure was applied to 10% of the dataset, yielding an exceptional Root Mean Square Error (RMSE) of 0.05 °C and ensuring high physical fidelity between observed and imputed values.
Reference Climatology
The 1991–2020 period was used as the climatological reference according to World Meteorological Organization guidelines (WMO, 2021). For each day of the year (DOY), the 90th percentile (P90) for Tmax was calculated, representing the temperature exceeded on only 10% of days for the same DOY during the reference period, while the 10th percentile (P10) for Tmin represented the temperature below which only 10% of days occurred. To strictly follow ETCCDI standards, percentiles were calculated using a 5-day moving window centered on each DOY, a mathematical procedure designed to reduce high-frequency meteorological noise and establish a stable baseline. These daily thresholds served as the basis for identifying thermal extremes.
Identification of Extremes and Thermal Waves
Thermal extremes were characterized according to the guidelines of the Expert Team on Climate Change Detection and Indices (ETCCDI) (Zhang et al., 2005; Zhang et al., 2011; Perkins & Alexander, 2013). A heatwave was defined as a period of at least three consecutive days with Tmax exceeding its corresponding P90. Similarly, a cold spell was characterized as a period of at least three consecutive days with Tmin below its corresponding P10. An algorithm was developed to scan the time series, identifying, and recording each event's start date, end date, duration, and type (heat or cold).
Calculation of Climate Indices
To quantify changes in thermal extremes, the following annual ETCCDI indices were calculated:
-
TX90p: Percentage of days per year with Tmax exceeding the 90th percentile of the reference climatology;
-
TN10p: Percentage of days per year with Tmin below the 10th percentile of the reference climatology.
-
WSDI (Warm Spell Duration Index): Number of days per year associated with heatwaves.
-
CSDI (Cold Spell Duration Index): Number of days per year associated with cold spells.
-
Annual wave count: Total number of heatwave and cold-spell events per year.
-
Average wave duration: Mean duration of heatwave and cold-spell events per year.
Temporal and Seasonal Analysis
Temporal trends in TX90p, TN10p, WSDI, and CSDI were evaluated using Sen’s slope estimator. Trend significance was assessed using the non-parametric Mann-Kendall test, with trends considered statistically significant at p < 0.05. Additionally, time series of annual wave count and mean wave duration were analyzed.
Seasonal analysis was performed for the four climatic seasons: DJF (Dec–Jan–Feb), MAM (Mar–Apr–May), JJA (Jun–Jul–Aug), and SON (Sep–Oct–Nov). For each season, the number of extreme days (TX90p and TN10p days) was quantified over the study period, allowing characterization of the interannual distribution of events.
Computational Implementation
The analysis was performed using the Python programming language with widely recognized scientific libraries. Pandas (McKinney, 2010) and NumPy (Harris et al., 2020) were used for data manipulation, cleaning, and transformation, whereas Matplotlib (Hunter, 2007) and Seaborn (Waskom, 2021) supported graphical visualization and exploratory data analysis.
Pre-processing procedures, including variable scaling and evaluation of imputation metrics, were performed using Scikit-learn (Pedregosa et al., 2011). Missing values were imputed using the Fancyimpute library through the Iterative SVD algorithm (Rubinsteyn & Feldman, 2016). Statistical tests and regression analyses were conducted using SciPy library (Virtanen et al., 2020), while robust non-parametric trend analyses were performed using PyMannKendall library (Hussain & Mahmud, 2019).
Results and Discussion
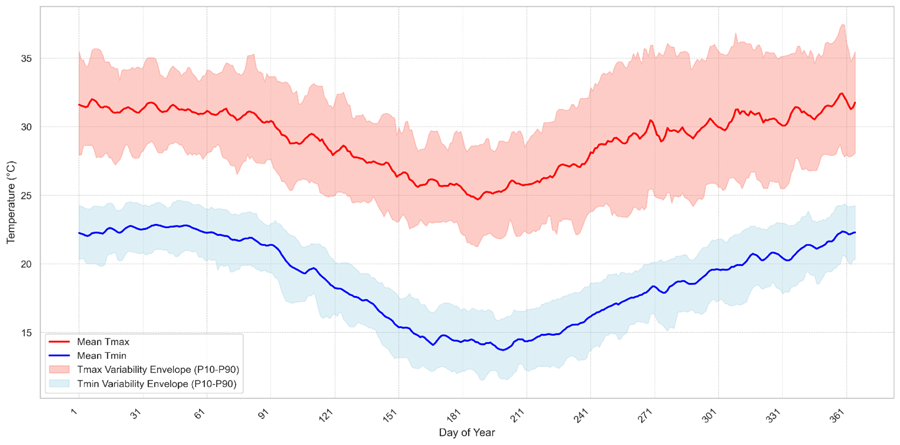
The analysis of temperature time series for Maputo from 1984 to 2023 reveals a clear transition toward a warmer climatic regime. This change is reflected not only in rising average temperatures but, more importantly, in shifts in the frequency, duration, and seasonality of thermal extremes. The main signature of this transition is a marked asymmetry between the evolution of heat and cold extremes. Figure 2 presents the daily temperature climatology for Maputo during the 1991–2020 period.
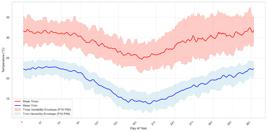
Figure 2 establishes the climatological baseline for subsequent analyses. The central lines represent daily mean temperatures, whereas the shaded area defines the normal variability envelope, represented by the interval between the 10th percentile (P10) and the 90th percentile (P90). These thresholds served as the basis for identifying thermal extremes throughout this study, ensuring methodological consistency. A clear seasonal pattern is observed, with higher temperatures and greater variability during summer (DJF), influenced by the South Indian Convergence Zone (SICZ) and the Mozambique Current, which favor the occurrence of heat extremes (Manhique et al., 2023). The 5-day moving window applied to this baseline reduces high-frequency noise, ensuring that deviations beyond this envelope represent genuine acute thermodynamic stress on local ecosystems.
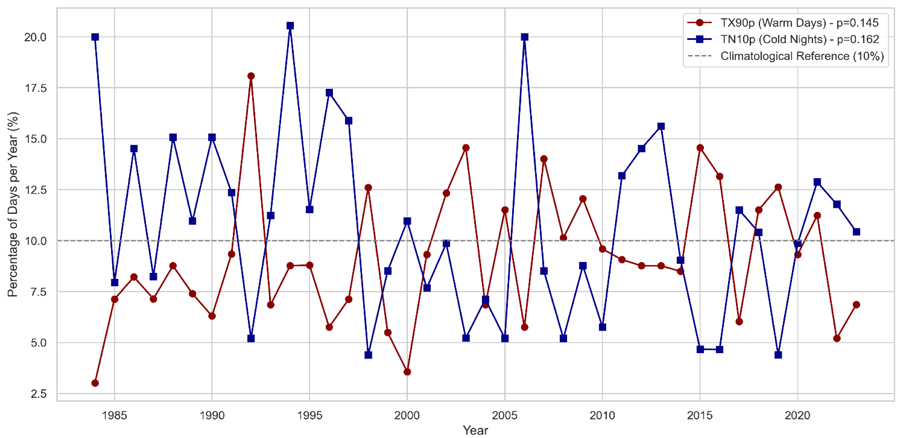
Figure 3 presents the annual frequency of hot days exceeding the 90th percentile and cold days below the 10th percentile.

Analysis of extreme-day frequency (Figure 3 shows a non-significant downward trend in cold-day frequency (TN10p) (p = 0.161), reflecting consistent interannual nocturnal warming. This result corroborates regional studies reporting a decline in cold extremes across Southern Africa (Macucule et al., 2022; Chikoore et al., 2024) and is consistent with Intergovernmental Panel on Climate Change reports (IPCC, 2023). In contrast, the frequency of warm days (TX90p) does not exhibit a statistically significant linear trend throughout the study period (p = 0,144), although a clear intensification is observed after 2010, with pronounced peaks in 2015, 2017, and 2022, suggesting a recent shift in the thermal regime. From an agrometeorological perspective, these interannual heat anomalies may trigger exponential increases in atmospheric vapor pressure deficit (VPD), accelerating soil moisture depletion beyond the compensatory capacity of root systems, which can be particularly detrimental during reproductive stages of maize development (Grossiord et al., 2020; Ortiz-Bobea et al., 2021). The complete statistical summary of these long-term monotonic trends, including Sen’s slope estimates and corresponding Mann-Kendall significance levels, is presented in Table 1
Mann-Kendall trend analysis and Sen’s slope estimates for annual extreme temperature indices in Maputo (1984-2023).
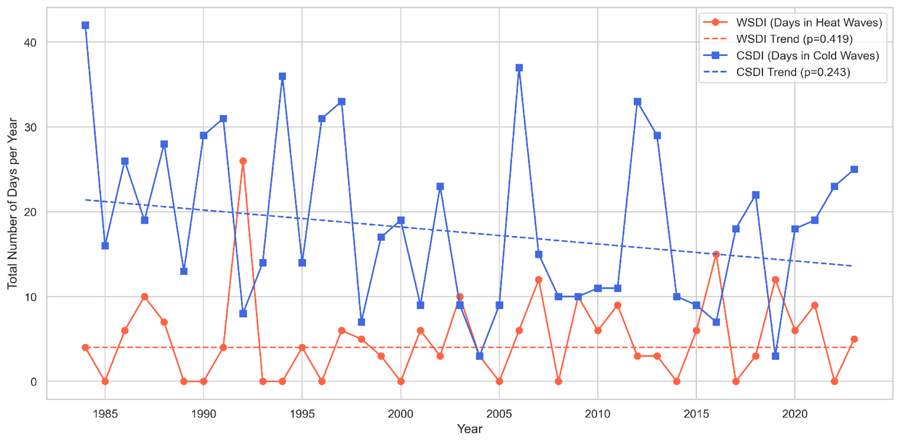
Figure 4 presents the annual duration of heatwave and cold-spell events throughout the study period using ETCCDI metrics.

Figure 4 shows a divergence in the evolution of accumulated thermal-wave duration. CSDI, which quantifies days associated with cold spells, exhibits a downward trend (p = 0.243), indicating that cold spells are becoming not only less frequent but also shorter. In contrast, WSDI does not show a significant linear trend (p = 0.418); however, peaks observed in recent years suggest an increasing risk of prolonged, high-impact heat events, even though their overall frequency does not yet exhibit a clear linear trend (Copernicus, 2024; Engelbrecht et al., 2024). Therefore, the main signature of changes in Maputo's thermal regime is the pronounced suppression of cold extremes rather than a proportional and statistically significant increase in heat-extreme duration.
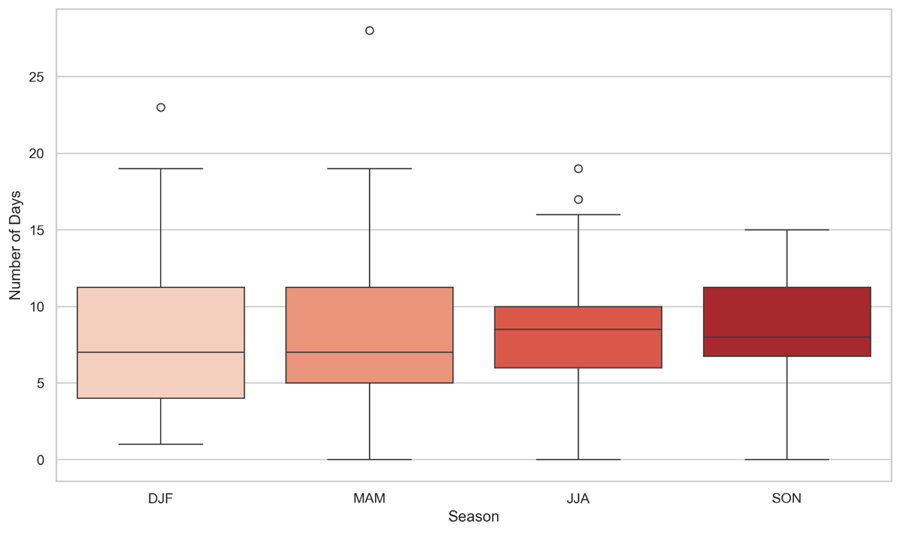
Figures 5A and 5B present the seasonal distribution of extremely hot and cold days throughout the study period, expressed as the number of days per season.

The analysis of seasonal extremes (Figures 5A and 5B) reveals complex patterns. Counterintuitively, the highest frequency of warm days (TX90p) occurs not during summer (DJF), but during late winter (JJA) and spring (SON). This pattern may be attributed to lower cloud cover during the dry season, allowing greater solar radiation incidence and consequently higher maximum temperature peaks. Cold nights (TN10p), in turn, occur more frequently during fall (MAM), spring (SON), and winter (JJA), reflecting greater atmospheric instability and the passage of frontal systems during these periods. Forcings such as the Indian Ocean Dipole (IOD) and the Madden–Julian Oscillation (MJO) may also contribute to seasonal variability (Iyakaremye et al., 2020). This pronounced seasonal variability indicates that thermal stress in Maputo is strongly influenced by episodic out-of-season events rather than only by gradual long-term warming, complicating adaptive agricultural planning.
Figure 6 presents the annual number of heatwaves and cold spells in Maputo from 1984 to 2023.

Annual wave count (Figure 6 indicates a near disappearance of cold spells after 2010, whereas heatwaves became a recurrent annual phenomenon. Peaks in heatwave occurrence coincide with strong El Niño events (2015–2016), reinforcing the influence of teleconnections on regional thermal extremes (Hancke et al., 2014).
Figure 7 presents the average duration of thermal-wave events during the study period.

Figure 7 which presents average annual thermal-wave duration, reveals substantial interannual variability for both event types. Contrary to expectations, no clear trend indicates that heatwaves became longer than cold spells in recent years. In several years after 2010, the mean duration of cold-spell events exceeded that of heatwaves. This finding suggests that although cold spells became much less frequent (as seen in the analysis), the few remaining events may still exhibit considerable individual duration. In contrast, heatwaves, despite occurring more frequently, are often short-duration events that commonly meet the minimum threshold of three consecutive days, as reported by Bell et al. (2018), Parkes et al. (2022), and Kunda et al. (2024). Nevertheless, even short heatwaves, when combined with atmospheric blocking and critical soil water deficits, may initiate cascading biophysical effects in rainfed crops by increasing evapotranspiration demand beyond sustainable thresholds (Eichelmann et al., 2021).
These findings provide strong evidence that Maputo is undergoing a transition toward a warmer climatic regime. The implications for agriculture, a major component of regional food security, are substantial because crucial crops such as maize and rice remain vulnerable to thermal stress that affects germination and yield (Parkes et al., 2022). Results indicate a significant shift in the historical risk profile, characterized by the systematic reduction of cold extremes. The observed decline in cold-night frequency (TN10p, p = 0.161) and accumulated cold-spell duration (CSDI, p = 0.243), combined with the near disappearance of cold spells after 2010 (Figure 6, suggests that extreme cold is no longer a recurrent agricultural stressor. This observation in Maputo is consistent with warming trends previously reported for Mozambique and Southern Africa in general (Macucule et al., 2022; Chikoore et al., 2024).
However, this apparent benefit is increasingly offset by the growing prominence of extreme heat events (Parkes et al., 2022). The clear intensification of warm days (TX90p) and the transformation of heatwaves into a recurrent annual phenomenon (Figure 5), particularly during El Niño years, as also reported by Peng et al. (2025), indicate a shift in the regional risk profile. For agricultural and environmental engineering, the adaptive challenge has moved from cold mitigation toward management of heat and water stress, as intensifying heat extremes are directly associated with increasing ecosystem water limitation (Denissen et al., 2024). Consequently, agricultural sustainability will increasingly depend on heat-resilience strategies, including efficient irrigation management and water-use optimization, reinforcing the urgent need for adaptive measures and local climate policies highlighted in global and regional assessments (IPCC, 2023; Engelbrecht et al., 2024; Jury, 2019).
Conclusions
This study quantified changes in temperature extremes in Maputo during 1984–2023, providing clear evidence that the city is undergoing a significant climatic transition. The central feature of this transition is the asymmetric reconfiguration of thermal extremes.
A marked reduction in cold events, cold-night frequency, and accumulated cold-spell duration was observed, with these events nearly disappearing as recurrent climatic risks after 2010. In contrast, heat extremes intensified episodically and modulated by large-scale forcings such as El Niño, became the dominant driver of the city's thermal variability. Ultimately, the absence of a significant monotonic trend suggests that the primary threat to regional food security arises from highly variable and unpredictable thermal shocks that generate extreme vapor pressure deficits rather than from gradual warming.
References
- Allen, R. G., Pereira, L. S., Raes, D., & Smith, M. (1998). Crop evapotranspiration-Guidelines for computing crop water requirements-FAO Irrigation and drainage paper 56. FAO, Rome, 300(9), D05109.
- Beck, H. E., Zimmermann, N. E., McVicar, T. R., Vergopolan, N., Berg, A., & Wood, E. F. (2018). Present and future Köppen-Geiger climate classification maps at 1-km resolution. Scientific Data, 5, Article 180214.
-
Bell, J. E., Brown, C. L., Conlon, K., Herring, S., Kunkel, K. E., Lawrimore, J., Luber, G., Schreck, C., Smith, A., & Uejio, C. (2018). Changes in extreme events and the potential impacts on human health. Journal of the Air & Waste Management Association, 68 (4), 265-287. https://doi.org/10.1080/10962247.2017.1401017
» https://doi.org/10.1080/10962247.2017.1401017 -
Chikoore, H., Mbokodo, I. L., Singo, M. V., Mohomi, T., Munyai, R. B., Havenga, H., Mahlobo, D. D., Engelbrecht, F. A., Bopape, M.-J. M., & Ndarana, T. (2024). Dynamics of an extreme low temperature event over South Africa amid a warming climate. Weather and Climate Extremes, 44, 100668. https://doi.org/10.1016/j.wace.2024.100668
» https://doi.org/10.1016/j.wace.2024.100668 -
Copernicus Climate Change Service (C3S). (2024). Global Climate Highlights 2023. European Centre for Medium-Range Weather Forecasts (ECMWF). https://climate.copernicus.eu/global-climate-highlights-2023
» https://climate.copernicus.eu/global-climate-highlights-2023 -
Denissen, J. M. C., Teuling, A. J., Koirala, S., Reichstein, M., Balsamo, G., Vogel, M. M., Yu, X., & Orth, R. (2024). Intensified future heat extremes linked with increasing ecosystem water limitation. Earth System Dynamics, 15( 3), 717-734. https://doi.org/10.5194/esd-15-717-2024
» https://doi.org/10.5194/esd-15-717-2024 -
Eichelmann, E., Mantoani, M. C., Chamberlain, S. D., Hemes, K. S., Oikawa, P. Y., Szutu, D., Valach, A., Verfaillie, J., & Baldocchi, D. D. (2021). A novel approach to partitioning evapotranspiration into evaporation and transpiration in flooded ecosystems. Global Change Biology, 28 (3), 990-1007. https://doi.org/10.1111/gcb.15974
» https://doi.org/10.1111/gcb.15974 -
Engelbrecht, F. A., Steinkopf, J., Padavatan, J., & Midgley, G. F. (2024). Projections of future climate change in Southern Africa and the potential for regional tipping points. In G. P. von Maltitz, et al. (Eds.), Sustainability of Southern African ecosystems under global change (pp. 169-190). Springer. https://doi.org/10.1007/978-3-031-10948-5_7
» https://doi.org/10.1007/978-3-031-10948-5_7 -
Grossiord, C., Buckley, T. N., Cernusak, L. A., Novick, K. A., Poulter, B., Siegwolf, R. T. W., Sperry, J. S., & McDowell, N. G. (2020). Plant responses to rising vapor pressure deficit. The New phytologist, 226 (6), 1550-1566. https://doi.org/10.1111/nph.16485
» https://doi.org/10.1111/nph.16485 -
Hancke, G. P., Reason, C. J. C., & Loveday, B. R. (2014). A regional model study of the effects of the Mozambique Channel on the seasonality of southern African rainfall. Climate Dynamics, 42 (5-6), 1547-1568. https://doi.org/10.1007/s00382-013-1789-x
» https://doi.org/10.1007/s00382-013-1789-x -
Harris, C. R., Millman, K. J., van der Walt, S. J., Gommers, R., Virtanen, P., Cournapeau, D., ... & Oliphant, T. E. (2020). Array programming with NumPy. Nature, 585 (7825), 357-362. https://doi.org/10.1038/s41586-020-2649-2
» https://doi.org/10.1038/s41586-020-2649-2 -
Hunter, J. D. (2007). Matplotlib: A 2D graphics environment. Computing in Science & Engineering, 9 (3), 90-95. https://doi.org/10.1109/MCSE.2007.55
» https://doi.org/10.1109/MCSE.2007.55 -
Hussain, M. M., & Mahmud, I. (2019). pyMannKendall: a python package for non parametric Mann Kendall family of trend tests. Journal of Open Source Software, 4 (39), 1556. https://doi.org/10.21105/joss.01556
» https://doi.org/10.21105/joss.01556 -
IPCC. (2023). Climate Change 2022: Impacts, adaptation and vulnerability. Contribution of Working Group II to the Sixth Assessment Report of the Intergovernmental Panel on Climate Change. Cambridge University Press. https://doi.org/10.1017/9781009325844
» https://doi.org/10.1017/9781009325844 -
Iyakaremye, V., Zeng, G., & Zhang, G. (2020). Changes in extreme temperature events over Africa under 1.5 and 2.0°C global warming scenarios. International Journal of Climatology, 41(2), 1506-1524. https://doi.org/10.1002/joc.6868
» https://doi.org/10.1002/joc.6868 -
Jury, M. R. (2019). South Africa's future climate: Trends and projections. In J. Knight & C. M. Rogerson (Eds.), The geography of South Africa (pp. 305-312). Springer. https://doi.org/10.1007/978-3-319-94974-1_33
» https://doi.org/10.1007/978-3-319-94974-1_33 -
Kunda, J. J., Gosling, S. N., & Foody, G. M. (2024). The effects of extreme heat on human health in tropical Africa. International Journal of Biometeorology, 68 (6), 1015-1033. https://doi.org/10.1007/s00484-024-02650-4
» https://doi.org/10.1007/s00484-024-02650-4 -
Macucule, D. A., Reason, C. J. C., & Lucio, F. F. (2022). Observed trends in extreme temperature and precipitation indices over Mozambique. Atmosphere, 13 (5), 785. https://doi.org/10.3390/atmos13050785
» https://doi.org/10.3390/atmos13050785 -
Manhique, A. J., Botai, J. O., Reason, C. J. C., & Tivar, F. (2023). On the relationship between the South Indian Ocean Counter-current and rainfall variability over Mozambique. Atmosphere, 14 (4), 711. https://doi.org/10.3390/atmos14040711
» https://doi.org/10.3390/atmos14040711 -
McKinney, W. (2010). Data structures for statistical computing in Python. [Conference]. Python in Science Conference (pp. 51 - 56). https://doi.org/10.25080/Majora-92bf1922-00a
» https://doi.org/10.25080/Majora-92bf1922-00a -
Ortiz-Bobea, A., Ault, T. R., Carrillo, C. M., Chambers, R. G., & Lobell, D. B. (2021). Anthropogenic climate change has slowed global agricultural productivity growth. Nature Climate Change, 11(4), 306-312. https://doi.org/10.1038/s41558-021-01000-1
» https://doi.org/10.1038/s41558-021-01000-1 -
Parkes, B., Buzan, J. R., & Huber, M. (2022). Heat stress in Africa under high-intensity climate change. International Journal of Biometeorology, 66 (8), 1531-1545. https://doi.org/10.1007/s00484-022-02295-1
» https://doi.org/10.1007/s00484-022-02295-1 -
Pedregosa, F., Varoquaux, G., Gramfort, A., Michel, V., Thirion, B., Grisel, O., Blondel, M., Prettenhofer, P., Weiss, R., Dubourg, V., Vanderplas, J., Passos, A., Cournapeau, D., Brucher, M., Perrot, M., & Duchesnay, É. (2011). Scikit-learn: Machine learning in Python. Journal of Machine Learning Research, 12, 2825-2830. https://www.jmlr.org/papers/v12/pedregosa11a.html
» https://www.jmlr.org/papers/v12/pedregosa11a.html -
Peng, Q., Xie, S., Miyamoto, A., Deser, C., Zhang, P., & Luongo, M. T. (2025). Strong 2023-2024 el niño generated by ocean dynamics. Nature Geoscience, 18 (6), 471-478. https://doi.org/10.1038/s41561-025-01700-9
» https://doi.org/10.1038/s41561-025-01700-9 -
Perkins, S. E., & Alexander, L. V. (2013). On the measurement of heat waves. Journal of Climate, 26 (13), 4500-4517. https://doi.org/10.1175/JCLI-D-12-00388.1
» https://doi.org/10.1175/JCLI-D-12-00388.1 -
Ringard, J., Dieppois, B., Rome, S., Diedhiou, A., Pellarin, T., Konaré, A., & Descroix, L. (2016). The intensification of thermal extremes in West Africa. Global and Planetary Change, 139, 66-77. https://doi.org/10.1016/j.gloplacha.2015.12.009
» https://doi.org/10.1016/j.gloplacha.2015.12.009 -
Rubinsteyn, A., & Feldman, S. (2016). Fancyimpute: Imputation for numerical tables. GitHub repository. https://github.com/iskandr/fancyimpute
» https://github.com/iskandr/fancyimpute -
Virtanen, P., Gommers, R., Oliphant, T. E., Haberland, M., Reddy, T., Cournapeau, D., Burovski, E., Peterson, P., Weckesser, W., Bright, J., van der Walt, S. J., Brett, M., Wilson, J., Millman, K. J., Mayorov, N., Nelson, A. R. J., Jones, E., Kern, R., Larson, E., …. & van Mulbregt, P. (2020). SciPy 1.0: Fundamental algorithms for scientific computing in Python. Nature Methods, 17 (3), 261-272. https://doi.org/10.1038/s41592-019-0686-2
» https://doi.org/10.1038/s41592-019-0686-2 -
Waskom, M. (2021). Seaborn: statistical data visualization. Journal of Open Source Software, 6 (60), 3021. https://doi.org/10.21105/joss.03021
» https://doi.org/10.21105/joss.03021 - World Meteorological Organization. (2021). WMO guidelines on the calculation of climate normals (WMO-No. 1203). WMO.
-
Zhang, X., Alexander, L., Hegerl, G. C., Jones, P., Tank, A. K., Peterson, T. C., Trewin, B., & Zwiers, F. W. (2011). Indices for monitoring changes in extremes based on daily temperature and precipitation data. Wiley Interdisciplinary Reviews: Climate Change, 2 (6), 851-870. https://doi.org/10.1002/wcc.147
» https://doi.org/10.1002/wcc.147 -
Zhang, X., Hegerl, G., Zwiers, F. W., & Kenyon, J. (2005). Avoiding inhomogeneity in percentile-based indices of temperature extremes. Journal of Climate, 18 (11), 1641-1651. https://doi.org/10.1175/JCLI3366.1
» https://doi.org/10.1175/JCLI3366.1