 Sensitivity of continuous emitters to solid particle obstruction
Abstract
Increasing crop productivity relies on techniques such as irrigation; however, drip irrigation systems face recurrent challenges related to dripper clogging, particularly in continuous emitters used in annual crops. Among these challenges, obstruction by solid particles is a major concern. In this context, this study evaluated sensitivity of continuous emitters to clogging by solid particles at two installation positions (upward and downward) using two procedures. Procedure 1 (P1) adopted particle size and concentration based on the test protocol proposed by the National Research Institute of Science and Technology for Agriculture and Environment (IRSTEA), whereas Procedure 2 (P2) used particle sizes corresponding to the minimum filtration level (120 mesh) recommended by irrigation equipment manufacturers. Clogging occurred primarily at the emitter inlet, even with particle diameters smaller than 125 µm, and was intensified by increasing concentrations up to 500 mg L-1. Particles close to 500 µm caused obstruction in emitters with channel depths below 50 mm. Under P1, increasing particle size was one of the main factors increasing susceptibility to obstruction. Under P2, even with particle sizes up to 125 µm and concentrations up to 500 mg L-1, conditions remained favorable for emitter clogging.
Keywords:
clogging; granulometry; procedure; geometric dimensions; drip irrigation
Introduction
Irrigation efficiency is limited by dripper clogging (Hou et al., 2024), which results from physical, chemical, and biological processes (Muhammad et al., 2021). Among these mechanisms, physical clogging occurs more frequently than the others (Shen et al., 2022). Despite its relevance, limited information is available on susceptibility to clogging by solid particles in continuous emitters. Therefore, evaluating emitter performance under different particle sizes and concentrations is necessary. In this context, assessment of emitter constructive characteristics is critical, as these features largely determine sensitivity to clogging (Qiu et al., 2023).
Continuous emitters differ from pellet and cylindrical emitters in the configuration of the pre-filter, labyrinth, and outlet chamber. These emitters are widely adopted in high-density cropping systems because flat and cylindrical emitters involve higher costs, particularly at spacings below 0.5 m. As an alternative, continuous emitters integrated directly into drip tapes have been recommended (Araujo, 2019).
Evaluation of clogging in continuous emitters requires procedures that realistically represent field conditions. Several methods have been developed to assess physical clogging under conditions similar to those encountered in irrigation systems, considering particle diameter, particle concentration, and optimization of emitter constructive characteristics (Li et al., 2024). Given the susceptibility of continuous emitters to clogging, targeted information on this topic supports appropriate selection of filtration systems and enables more effective management of irrigation water quality.
Therefore, studies focusing specifically on clogging in continuous-path emitters integrated into drip tape are required. This study aims to evaluate sensitivity of continuous emitters to clogging caused by solid particles suspended in water, considering upward and downward installation positions and applying two distinct clogging test procedures.
Material and methods
The experiments were conducted at the Irrigation Materials Testing Laboratory (LEMI) of the Luiz de Queiroz School of Agriculture (ESALQ–USP), Piracicaba, São Paulo State, Brazil.
To evaluate susceptibility of continuous emitters to physical clogging, three models were operated simultaneously. For each model, two drip tapes were installed to assess the effect of emitter orientation: one tape with outlet orifices facing upward and another with outlet orifices facing downward. Each drip tape contained 13 emitters.
Models of continuous emitters integrated into drip tape
Models 1 (M1), 2 (M2), and 3 (M3) presented a nominal tape diameter of 16 mm, with emitter spacings of 10, 20, and 30 cm and operating pressures of 70, 100, and 100 kPa, respectively. Technical characteristics of the continuous emitters integrated into drip tape are summarized in Table 1, and their dimensions and geometric features are illustrated in Figure 1.

Dimensions and geometric features of (A) M1 – 1.4 L h-1, (B) M2 – 1.13 L h-1, and (C) M3 – 0.65 L h-1. Labyrinth dimensions in millimeters (mm).
Labyrinth length was measured along a straight line using the inlet and outlet as reference points, and width was measured at its maximum dimension. The labyrinth surfaces of M1 and M2 are uniform (Figures 2A and 2B). In contrast, M3 presents a curved surface, with shallower depth at the center and greater depth near the labyrinth walls (Figure 2C).

Cross-sections of (A) M1 and (B) M2, showing flat labyrinth surfaces, and (C) M3, showing a curved labyrinth surface with greater depth near the wall and reduced depth at the center. Red lines indicate labyrinth boundaries.
Test bench
A polyethylene reservoir with a capacity of 0.25 m3 was used, coupled to a 3 hp motor–pump assembly (Figure 4), which supplied water to the distribution system (Figure 3).

Components of the test bench: (1) reservoir; (2) mechanical agitator; (3) motor–pump assembly; (4) screen filter; (5) discharge valve; (6) return valve; (7) pressure gauge; (8) collectors; (9) emitter; (10) nozzle; (11) bench; (12) collector support; (13) polystyrene sheet; (14) sieve positioned near the funnel of the collection trough; and (15) collection trough.

This assembly supplied a derivation line with symmetrical bifurcations, distributing water uniformly through parallel lines with a length of 5 m. The test bench components are shown in Figure 4.
A pumping and filtering system with an opening larger than the particle diameter was used to retain potential external contaminants and particles larger than those applied in the tests; the filter was installed at the funnel of the collection trough. To maintain particles in suspension, a mechanical agitator coupled to a motor with a blade diameter of 25.5 cm and operating at 135 rpm was used.
The test bench was equipped with a sloped polystyrene surface to allow drainage of water from emitters and nozzles at the ends of the lines and return flow to the reservoir. Pipes between the pump and the lateral line inlets ensured water flow velocity above 1 m s⁻1, enabling effective transport of particles from the reservoir to the line inlets. Line ends were kept open to maintain velocities close to 1 m s⁻1, regulated by the nozzles, reinforcing homogeneous particle distribution among lines.
Plastic tarps (100 µm) were installed on the sides and ceiling of the bench to prevent contamination. To avoid particle deposition on the polystyrene surface, a water distribution system was installed at the end of the piping, allowing continuous flow toward the end of the bench and promoting removal of deposited particles.
Soil and water particles
Water was obtained by reverse osmosis [electrical conductivity (EC) < 10 µS cm⁻1] and further purified using a polypropylene filter (1 µm aperture), a granular activated carbon filter, and a reverse osmosis membrane with a capacity of 16 L h⁻1 (100 gal day⁻1). In addition, the water was chlorinated to prevent clogging of biological origin.
The soil had a particle density of 2.6 g cm⁻3 and pH 5.7, with the following particle-size composition: 60.6% clay, 12.5% silt, and 26.9% sand. Air-dried soil was sieved, followed by removal of organic matter using hydrogen peroxide, particle dispersion, and wet sieving, according to ISO 11277 (ISO, 2009). Particle-size distributions were obtained using sets of 15 and 7 sieves (ASTM International, 2020) for Procedure 1 (P1) and Procedure 2 (P2), respectively. The proportion of soil retained on each sieve was determined based on the relative contribution of particles retained in the upper and lower limits of each sieve, as described by [eq. (1)]:
Where:
Si is percentage of soil from sieve i (with i ranging from 1 to 15 in P1 and from 1 to 7 in P2) used to constitute the soil mixture in test phase j (with j ranging from 1 to 4 particle-size ranges in P1 and a single particle-size distribution in P2);
Ui is upper particle size retained on sieve i (µm);
Li is lower particle size retained on sieve i (µm);
Uj is upper particle size of granulometric range j (µm);
Lj is lower particle size of granulometric range j (µm).
To evaluate emitter clogging, increasing particle concentrations in water were applied using two procedures. In P1, four particle concentration levels were tested (Table 2), whereas in P2, two particle concentrations were evaluated (Table 3).
Clogging test procedures
Two clogging test procedures were applied, differing in particle size distributions and concentration levels across test phases. Procedure 1 (P1) followed protocols established by the National Research Institute of Science and Technology for Agriculture and Environment (IRSTEA) laboratory and was conducted with three repetitions (Rep 1, Rep 2, and Rep 3). Procedure 2 (P2) also included three repetitions (Rep 4, Rep 5, and Rep 6) and used particle sizes corresponding to the minimum filtration level (120 mesh) recommended by manufacturers of continuous emitters integrated into drip tape.
In P1, each test consisted of four phases, with distinct particle size ranges and concentrations in each phase. Each phase lasted 40 h, resulting in a total test duration of 160 h. Phases were completed over five consecutive days, with the system operating for 8 h per day.
In P2, the lowest particle concentration (125 mg L⁻1) represents a severe clogging risk condition according to Nakayama & Bucks (1991), whereas the highest concentration (500 mg L⁻1) simulates an extreme field operating scenario. Under this procedure, each test comprised two phases using particles in the 0–125 µm size range, with concentrations of 125 mg L⁻1 (C1) and 500 mg L⁻1 (C2). A 12 h operating cycle was adopted, with the system running for 10 h followed by a 2 h shutdown period to simulate field rest conditions.
The treatment with a concentration of 125 mg L⁻1 was applied during the first 20 cycles (Phase 1) over 10 days, with two cycles per day. Subsequently, an additional 20 cycles were conducted (Phase 2) by adding 375 mg L⁻1 of particles, resulting in a final concentration of 500 mg L⁻1 at the end of the trial.
Tests and data analysis
Two types of evaluations were performed. In the quantitative evaluation, an emitter was considered obstructed when its flow rate was equal to or less than 75% of the initial flow rate (Equation 2). A batch of emitters was considered obstructed when at least 25% of the emitters in the sample were classified as obstructed (Equation 3), as proposed by (Lavanholi et al., 2018).
Where:
qa – current emitter flow rate (L h-1);
qo – initial emitter flow rate (L h-1), determined using supply water;
No – number of obstructed emitters;
Nt - total number of emitters in the sample.
Qualitative evaluation was performed under both procedures. Obstructed emitters were removed from the test bench and carefully opened using a scalpel to assess particle sedimentation within the emitter, using images acquired with a Mitutoyo™ microscope equipped with a high-resolution digital camera (1080/2M).
To minimize chemical and biological contamination, deionized water was used throughout the experiments, and water temperature, hydrogen potential (pH), and electrical conductivity (EC) were monitored twice daily, at the beginning and midpoint of the daily tests. Daily chlorination was applied at a free chlorine concentration of 3 ppm using sodium hypochlorite (NaOCl) as the chlorine source, aiming to suppress biological activity and prevent biofilm formation.
Results and discussion
Water characteristics during Procedure 1 tests
During P1, hydrogen ion potential (pH) of the solution was maintained between 6.0 and 7.5 (Figure 5a) to standardize water conditions throughout the tests and prevent formation of chemical precipitates that could contribute to emitter contamination.

Hydrogen ion potential (pH) (a), electrical conductivity of the solution (EC) (b), and water temperature (c) measured at the end of each day during the P1 tests.
Electrical conductivity (EC) increased over test duration (Figure 5b), with gradual rises leading to maximum values of 580.5, 659.3, and 420.1 µS cm⁻1 in repetitions 1 (Rep 1), 2 (Rep 2), and 3 (Rep 3), respectively (Figure 5b). This increase resulted from addition of HCl and NaClO, used for water acidification and chlorination. Water temperature was not actively controlled and exhibited minor variations driven by local climatic conditions (Figure 5c). Elevated temperatures reduce water viscosity, potentially delaying emitter clogging, whereas lower temperatures increase viscosity and may favor clogging. Fathi & Abdi (2015) reported that temperatures near 13 °C can promote physical clogging in emitters, particularly those with narrow flow channels, whereas increases up to 43 °C may delay clogging.
Obstruction of continuous emitters in Procedure 1
In P1, obstruction of M1 increased proportionally with particle size and concentration (Figure 6), with a clear influence of emitter orientation. The downward orientation intensified obstruction (Figure 6b); by the end of Phase 1 (0–75 µm and 125 mg L⁻1), 100% of the batch was obstructed across all three repetitions (Figure 6b). In contrast, the upward orientation (Figure 6a) did not reach 25% batch obstruction during Phase 1.

Number of obstructed emitters according to emitter orientation during P1. M1 installed with outlet orifices facing upward

 (a) and downward (b)
 .
.
In Phase 2, particle sizes did not exceed the emitter flow-section dimensions; thus, obstruction observed during this phase is attributed to gradual accumulation of smaller particles (≤125 µm). Sediment deposition intensifies as particles progressively accumulate within the emitter channels (Hou, Puig-Bargués, et al., 2024).
Model M1, when oriented downward, showed susceptibility to clogging by particles up to 125 µm. Although some studies report no sensitivity to particles within equivalent size and concentration ranges (Niu et al., 2013), the sensitivity observed here for M1 within the 75–125 µm range and at lower concentrations than those reported by these authors is attributable to its constructive characteristics. Specifically, the relatively narrow labyrinth geometry of M1—length of 38 mm, width of 0.325 mm, and channel depth of 0.28 mm—likely increases its vulnerability to particle accumulation and subsequent obstruction.
In Phase 2 for M2, increasing particle size and concentration resulted in emitter clogging, with 100% of the batch obstructed when emitters were installed in the downward orientation. Furthermore, in Phase 3, complete clogging occurred regardless of emitter orientation (Figure 7a,b).

Number of obstructed emitters according to emitter orientation during the three repetitions of P1. M2 installed with outlet orifices facing upward (a)
and downward (b) .
Clogging observed in Phase 3 was primarily driven by particle size. Depending on emitter geometry and internal dimensions, clay alone does not act as an isolated clogging agent (Oliveira et al., 2020). These authors showed that clay sedimentation within the labyrinth causes variations in emitter flow rate but does not lead to complete obstruction. However, they emphasized that, when combined with larger particles, clay promotes aggregate formation, resulting in emitter clogging. This mechanism was evident in Rep 1, Rep 2, and Rep 3 during Phase 2, when particles in the 75–125 µm range were introduced, enhancing interactions between fine and coarse particles.
Similar trends have been reported in studies using the same methodology as P1 to evaluate pellet-type emitters, in which increases in particle size and concentration—particularly at the onset of Phase 3—led to higher degrees of emitter obstruction (Lavanholi et al., 2018; Pereira et al., 2020).
Model M3 was the only one that exhibited lower sensitivity to clogging when installed in the upward orientation (Figure 8a), with only one emitter becoming obstructed at the end of Phase 3 in Rep 1. This isolated event was attributed to contamination by unidentified extraneous material. In contrast, when M3 was installed in the downward orientation, the entire batch became clogged when particles with sizes between 125 and 212 µm were applied at a concentration of 375 mg L⁻1 (Figure 8b).

Number of obstructed emitters according to emitter orientation during the three repetitions of P1. M3 installed with outlet orifices facing upward (a)
and downward (b) .
The reduced sensitivity to clogging observed for M3 is associated with its constructive characteristics, including labyrinth length, width, and depth (Table 1), as well as the presence of a pre-filter located upstream of the labyrinth, which is absent in the other models. This finding supports previous evidence that labyrinth type and geometric parameters are critical factors influencing both hydraulic performance and susceptibility to clogging in emitters (Qin et al., 2022).
The low clogging sensitivity of M3 contrasts with observations reported by Shi et al. (2022), who indicated that narrow labyrinths with inadequate dimensions, particularly flow channels with widths close to 1 mm, tend to promote obstruction. Although M3 has a channel width of 1.09 mm (Figure 1), it exhibited lower sensitivity to clogging than M2, which has a wider channel (1.54 mm). This behavior can be explained by the combined effects of labyrinth length and depth. Compared with M1, M3 has a labyrinth that is 78.6 mm longer and 0.32 mm deeper. Relative to M2, the increases are 68 mm in length and 0.24 mm in depth (Table 1).
Water characteristics during Procedure 2 tests
During P2, solution pH remained between 6.5 and 7.5 throughout the experimental period (Figure 9a). According to Nakayama & Bucks (1991), pH values below 7 and within the range of 7–8 are classified as low and moderate severity, respectively, with respect to chemical precipitation. Therefore, given that pH remained within these ranges during the tests, chemical precipitate formation was unlikely.

Hydrogen ion potential (pH) (a), electrical conductivity of the solution (EC) (b), and water temperature (c) measured at the end of each day during the P2 tests.
An increase in electrical conductivity (EC) was also observed during P2. EC values increased progressively, reaching maximum values of 910, 798, and 810 µS cm⁻1 at the end of the tests in repetitions 4 (Rep 4), 5 (Rep 5), and 6 (Rep 6), respectively (Figure 9b).
Water temperature was monitored without active control. Although temperature varied both among tests and within the same day, no extreme conditions were recorded that could substantially alter water viscosity or interfere with clogging processes (Figure 9c). He et al. (2023) reported lower clogging rates at temperatures between 25 and 30 °C compared with temperatures near 15 °C, with clogging intensity increasing as operating pressure decreases.
Obstruction of continuous emitters in Procedure 2
In P2, obstruction in M1 was caused by particles with diameters ≤125 µm, particularly when emitters were installed in the downward orientation (Figure 10b). Obstruction intensified with increasing particle concentration, and 25% of the batch was classified as obstructed in all repetitions when concentration reached 500 mg L⁻1, regardless of emitter orientation.

Number of obstructed emitters according to emitter orientation during P2. M1 installed with outlet orifices facing upward (a) and downward (b). C1 corresponds to a particle concentration of 125 mg L⁻1, and C2 corresponds to a particle concentration of 500 mg L⁻1 in water.
Although it is widely reported that clay suspended in water alone does not necessarily cause emitter obstruction (Oliveira et al., 2020), exceptions may occur under specific conditions. Accumulation of clay at high concentrations, such as those applied in P2 (500 mg L⁻1), can induce obstruction in emitters with labyrinth dimensions similar to those of M1. Oliveira et al. (2020) evaluated a clay concentration of 500 mg L⁻1 and reported no complete clogging; however, the emitters assessed in that study had larger labyrinth widths (1.20 and 0.78 mm) than M1, which has a width of only 0.33 mm.
Under severe clay concentration conditions, complete obstruction of M1 is likely, particularly because clay particles are commonly present in irrigation water under field conditions and can readily pass through filtration systems due to their small diameter (Niu et al., 2013). Obstruction of M1 is strongly associated with its reduced labyrinth depth and width, 0.28 mm and 0.33 mm, respectively (Table 1). This model features a circular labyrinth geometry, in which geometric dimensions play a key role in energy dissipation (Li et al., 2022) and, consequently, in susceptibility to clogging. These authors demonstrated that channel width and central radius are critical parameters governing formation of low-velocity vortex zones, which favor sedimentation and particle accumulation.
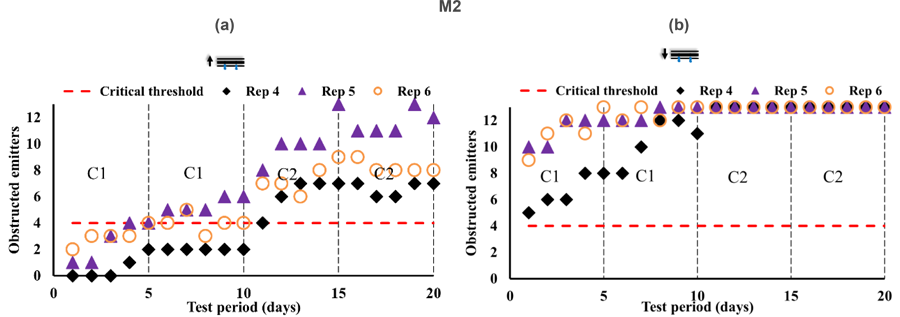
In M2, particles with diameters smaller than 125 µm caused sensitivity to clogging, particularly as particle concentration increased (Figure 11a,b). Particles within this size range are commonly present under field conditions, as they can pass through filtration systems even when water treatment and filtration are applied.

Number of obstructed emitters according to emitter orientation during P2. M2 installed with outlet orifices facing upward (a) and downward (b). C1 corresponds to a particle concentration of 125 mg L⁻1, and C2 corresponds to a particle concentration of 500 mg L⁻1 in water.
In this context, increases in clay particle concentration represent one of the primary causes of clogging, as elevated concentrations promote particle aggregation, leading to complete obstruction. Aggregate formation depends strongly on emitter constructive characteristics because, depending on labyrinth geometry, emitters may be prone to inadequate vortex formation and enhanced particle sedimentation within flow stagnation zones (Feng et al., 2025).
Particle sedimentation that initiates the clogging process is closely associated with vortex zones within the labyrinth. These zones are characterized by spatial variations in flow velocity, with the vortex center representing the region of lowest velocity and highest likelihood of particle deposition (Feng et al., 2018). Excessive deposition in these regions promotes particle accumulation and aggregate formation. In addition to vortex zones, stagnation zones also favor particle deposition due to low flow velocities. These zones are generated by the geometry and angle of the deflectors (flow barriers) within the labyrinth, and deflector angle can either intensify or mitigate formation of such zones (Lavanholi et al., 2020).
Emitter obstruction associated with increased clay concentration was also investigated by Oliveira et al. (2017), who reported that clay mineralogy (kaolinite and montmorillonite) did not significantly affect emitter performance. However, they observed that increasing particle concentration reduced emitter flow rate and that emitters with lower nominal flow rates (0.60 L h⁻1) were more susceptible to flow variation than those with higher nominal flow rates (1.70 L h⁻1).
Higher nominal flow rate emitters are not necessarily more resistant to clogging. In the present study, M2, with a nominal flow rate of 1.13 L h⁻1, became completely clogged as particle concentration increased, despite having a flow rate 0.53 L h⁻1 higher than the lower-flow emitter evaluated by Oliveira et al. (2017). A more reliable indicator of clogging sensitivity is labyrinth geometry. When comparing M1, which has a labyrinth length, width, and depth of 48.6, 1.54, and 0.36 mm, respectively, with M3, which has corresponding dimensions of 116.6, 1.09, and 0.60 mm, it is evident that emitters with larger labyrinth dimensions exhibit lower sensitivity to obstruction.
Results from P2 indicate that M3 exhibited lower susceptibility to clogging when installed in the upward orientation at both particle concentrations, 125 and 500 mg L⁻1 (Figure 12a). Clogging of this emitter occurred only when a concentration of 500 mg L⁻1 of particles with diameters up to 125 µm was applied and the emitter was installed in the downward orientation.

Number of obstructed emitters according to emitter orientation during P2. M3 installed with outlet orifices facing upward (a) and downward (b). C1 corresponds to a particle concentration of 125 mg L⁻1, and C2 corresponds to a particle concentration of 500 mg L⁻1 in water.
Because M3 was the only emitter evaluated in this study that did not show high susceptibility to clogging, these results further reinforce that, regardless of solid particle concentration and granulometry, upward installation of emitters represents the most suitable field practice (Fernandes & Saad, 2021), as it reduces the likelihood of particles sedimented within the hose entering the emitter.
Process and location of obstruction in continuous emitters
After opening the emitters, M1 showed pre-filters with clay aggregates adhered at the interface between the emitter and the drip tape, indicating obstruction (Figure 13a). Particle accumulation was primarily observed along the labyrinth, especially in the region between the inlet and the first deflector (Figure 13b). This configuration promotes low-velocity zones near channel walls, where particles readily deposit, creating favorable conditions for particle concentration and eventual complete obstruction (Li et al., 2008).

Obstruction by particles in different emitter sections. (a) M1 installed upward, P1, obstruction at the interface between drip tape and emitter inlet; (b) M1 installed upward, P1, particle sedimentation at the first labyrinth deflector; (c) M1 installed downward, P2, partially obstructed pre-filter; (d) M1 installed downward, P2, particle deposition at the pre-filter inlet; (e) M2 installed upward, P1, obstruction at the interface between drip tape and emitter inlet; (f) M2 installed upward, P2, obstruction at the interface between drip tape and emitter inlet; (g) M2 installed downward, P2, particle accumulation at the labyrinth outlet; (h) M3 installed downward, P1, obstructed labyrinth; and (i) M3 installed downward, P2, particle sedimentation near deflector walls.
Clay aggregate accumulation within the labyrinths of M1 installed in the upward orientation occurred more frequently in P2 than under P1 conditions. This difference is likely related to particle loading, as P2 used 45 g of particles smaller than 45 µm, whereas P1 used 18.75 g for the same size class. In M1 installed in the downward orientation, the pre-filter was partially obstructed, with only a small region near the labyrinth inlet remaining free of sediment (Figure 13c). Particle deposition extended along the entire edge of the pre-filter (Figure 13d), restricting water passage.
In M2, cementation of clay adhered at the emitter inlet and at the interface with the drip tape, preventing water entry (Figures 13e and 13f). In some emitters, aggregates were confined to this inlet region, with no detectable particle residues beyond the pre-filter (Figures 13e and 13f). Given that fine particles can pass through filtration systems and reach emitters, low susceptibility to obstruction depends strongly on emitter constructive characteristics. Bounoua et al. (2016) reported that filtration alone does not fully prevent emitter clogging because fine particles can bypass filters and agglomerate within emitters, creating obstruction conditions. For M2 installed in the downward orientation, higher particle concentrations led to complete labyrinth obstruction, and in one emitter, obstruction occurred near the labyrinth outlet (Figure 13g). This behavior is likely associated with reduced flow velocity near the outlet, which favors sedimentation and particle accumulation (Liu et al., 2010; Feng et al., 2025).
For M3 installed in the downward orientation, obstruction occurred within the labyrinth section (Figure 13h), with particles deposited in vortex and stagnation zones. Two forces govern this process: inertial force, which is proportional to particle diameter, and drag force, which scales with the square of particle size. As particle diameter increases, particles tend to deviate from the main high-velocity flow path and migrate into vortex and stagnation zones (Ouarriche et al., 2020), accumulating near deflector walls and ultimately causing labyrinth obstruction (Figure 13i).
Studying obstruction in continuous emitters integrated into drip tape requires careful evaluation, and the images above provide useful evidence because assessment of particle distribution can indicate sections more prone to clogging. However, developing methods to observe particle behavior in real time within these emitters, under different constructive characteristics, would strengthen understanding of clogging mechanisms.
Conclusions
In P1, increasing particle size was one of the main factors driving higher sensitivity to clogging, whereas in P2, even small particles (<125 µm) created favorable conditions for clogging at concentrations ranging from 125 to 500 mg L⁻1. Given that filtration systems do not retain particles smaller than 125 µm, continuous emitters integrated into drip tape with internal dimensions similar to those of M1 and M2 are highly susceptible to clogging when installed in the downward orientation. When installed upward, clogging may still occur and can be exacerbated by the presence of particles larger than 125 µm, even at low concentrations, or by high concentrations (500 mg L⁻1) of particles smaller than 125 µm.
The primary mechanisms responsible for clogging in continuous emitters include sedimentation, accumulation, and aggregation of fine particles within the pre-filter and at the entrance of the labyrinth. In the pre-filter, factors such as particle arrangement, inlet baffle height, and available cross-sectional area can facilitate obstruction. Labyrinth dimensions further accentuate clogging, and obstruction by solid particles is not necessarily correlated with nominal flow rate. In this study, the emitter with the lowest flow rate exhibited the lowest sensitivity to clogging.
In this context, future studies aimed at mitigating clogging in continuous emitters integrated into drip tape should focus on optimizing constructive characteristics, including labyrinth length, width, and depth, as well as pre-filter configuration. Designs similar to those of M1 and M2 should be modified to achieve constructive features closer to those of M3, which demonstrated lower susceptibility to obstruction.
References
-
Araujo, A. C. S. de. (2019). Desempenho hidráulico de fitas gotejadoras operando sob diferentes temperaturas da água. [Dissertação Mestrado, Piracicaba USP]. https://doi.org/10.11606/D.11.2019.tde-01082019-164735
» https://doi.org/10.11606/D.11.2019.tde-01082019-164735 -
ASTM International. (2020). ASTM E11-20: Standard specification for woven wire test sieve cloth and test sieves. https://doi.org/10.1520/E0011-20
» https://doi.org/10.1520/E0011-20 -
Bounoua, S., Tomas, S., Labille, J., Molle, B., Granier, J., Haldenwang, P., & Izzati, S. N. (2016). Understanding physical clogging in drip irrigation: in situ, in-lab and numerical approaches. In Irrigation Science, 34, 327-342. Springer Verlag. https://doi.org/10.1007/s00271-016-0506-8
» https://doi.org/10.1007/s00271-016-0506-8 -
Fathi, P., & Abdi, C. (2015). Study the Effect of temperature on the physical clogging of the long path emitters. Journal of Water and Soil Conservation, 22 (5), 275-286. https://jwsc.gau.ac.ir/article_2867_en.html
» https://jwsc.gau.ac.ir/article_2867_en.html -
Feng, J., Li, Y., Wang, W., & Xue, S. (2018). Effect of optimization forms of flow path on emitter hydraulic and anti-clogging performance in drip irrigation system. Irrigation Science, 36(1), 37-47. https://doi.org/10.1007/S00271-017-0561-9
» https://doi.org/10.1007/S00271-017-0561-9 -
Feng, J., Liu, H., Liu, Y., Sun, H., Ma, C., Shi, P., Wang, W., Xue, S., & Wen, J. (2025). Optimal structure selection of emitter flow path in drip irrigation system with inferior water resources. Revista Brasileira de Engenharia Agricola e Ambiental, 29 https://doi.org/10.1590/1807-1929/agriambi.v29n2e281773
» https://doi.org/10.1590/1807-1929/agriambi.v29n2e281773 -
Fernandes, C. N., & Saad, J. C. C. (2021). Evaluation of pulsating pressure and emitter position in preventing drip emitters from clogging. Journal of Irrigation and Drainage Engineering, 148 (3), 06021015. https://doi.org/10.1061/ (ASCE)IR.1943-4774.0001658
» https://doi.org/10.1061/ -
He, K., Wei, Z., Chen, X., Jia, W., & Wei, C. (2023). Research on the Influence of Temperature and Pressure on Clogging of Integrated Water and Fertilizer Drip Irrigation System. Journal of Irrigation and Drainage, 42 (3), 74-81. https://doi.org/10.13522/J.CNKI.GGPS.2022169
» https://doi.org/10.13522/J.CNKI.GGPS.2022169 -
Hou, P., Liu, L., Tahir, M., Li, Y., Wang, X., Shi, N., Xiao, Y., Ma, C., & Li, Y. (2024). Effect of fertilization on emitter clogging in drip irrigation using high sediment water: Perspective of sediment discharge capacity. Agricultural Water Management, 294. https://doi.org/10.1016/j.agwat.2024.108723
» https://doi.org/10.1016/j.agwat.2024.108723 - International Organization for Standardization. (2009). ISO 11277: Soil quality - Determination of particle size distribution in mineral soil material - Method by sieving and sedimentation. Geneva.
-
Lavanholi, R., Oliveira, F. C., Camargo, A. P. D., Frizzone, J. A., Molle, B., Ait-Mouheb, N., & Tomas, S. (2018). Methodology to evaluate dripper sensitivity to clogging due to solid particles: An assessment. Scientific World Journal, 2018. https://doi.org/10.1155/2018/7697458
» https://doi.org/10.1155/2018/7697458 -
Lavanholi, R., Pires De Camargo, A., Bombardelli, W. W. Á., Frizzone, J.A., Ait-Mouheb, N., Silva, E. A. da, & Correia De Oliveira, F. (2020). Prediction of pressure-discharge curves of trapezoidal labyrinth channels from nonlinear regression and artificial neural networks. https://doi.org/10.1061/ (ASCE)IR.1943-4774.0001485
» https://doi.org/10.1061/ -
Li, Y., Feng, X., Han, X., Sun, Y., & Li, H. (2024). Analysis of anti-clogging performance and particle transport characteristics of a stellate irrigation emitter. Biosystems Engineering, 242, 50-66. https://doi.org/10.1016/j.biosystemseng.2024.04.010
» https://doi.org/10.1016/j.biosystemseng.2024.04.010 -
Li, Y., Feng, X., Liu, Y., Han, X., Liu, H., Sun, Y., Li, H., & Xie, Y. (2022). Research on hydraulic properties and energy dissipation mechanism of the novel water-retaining labyrinth channel emitters. Agronomy, 12 (7). https://doi.org/10.3390/AGRONOMY12071708
» https://doi.org/10.3390/AGRONOMY12071708 -
Li, Y., Yang, P., Xu, T., Ren, S., Lin, X., Wei, R., & Xu, H. (2008). CFD and digital particle tracking to assess flow characteristics in the labyrinth flow path of a drip irrigation emitter. Irrigation Science, 26, 427-438. https://doi.org/10.1007/s00271-008-0108-1
» https://doi.org/10.1007/s00271-008-0108-1 -
Liu, H.-s., Li, Y.-k., Liu, Y.-z., Yang, P.-l., Ren, S.-m., Wei, R.-j., & Xu, H.-b. (2010). Flow characteristics in energy dissipation units of labyrinth path in the drip irrigation emitters with DPIV technology. Journal of Hydrodynamics, 22, 137-145. https://doi.org/10.1016/S1001-6058 (09)60038-X
» https://doi.org/10.1016/S1001-6058 (09)60038-X -
Muhammad, T., Zhou, B., Liu, Z., Chen, X., & Li, Y. (2021). Effects of phosphorus-fertigation on emitter clogging in drip irrigation system with saline water. Agricultural Water Management, 243, 106392. https://doi.org/10.1016/J.AGWAT.2020.106392
» https://doi.org/10.1016/J.AGWAT.2020.106392 -
Nakayama, F. S., & Bucks, D. A. (1991). Water quality in drip/trickle irrigation: A review. Irrigation Science, 12, 187-192. https://doi.org/10.1007/BF00190522
» https://doi.org/10.1007/BF00190522 -
Niu, W., Liu, L., & Chen, X. (2013). Influence of fine particle size and concentration on the clogging of labyrinth emitters. Irrigation Science, 31, 545-555. https://doi.org/10.1007/s00271-012-0328-2
» https://doi.org/10.1007/s00271-012-0328-2 -
Oliveira, F. C. de, Lavanholi, R., de Camargo, A. P., Ait-Mouheb, N., Frizzone, J. A., Tomas, S., & Molle, B. (2020). Clogging of drippers caused by suspensions of kaolinite and montmorillonite clays. Irrigation Science, 38, 65-75. https://doi.org/10.1007/s00271-019-00652-4
» https://doi.org/10.1007/s00271-019-00652-4 -
Oliveira, F. C., Lavanholi, R., Camargo, A. P., Frizzone, A., Ait, M. N., Tomas, S., & Molle, B. (2017). Influence of concentration and type of clay particles on dripper clogging. Irrigation & Drainage Systems Engineering, 06 https://www.hilarispublisher.com/abstract/influence-of-concentration-and-type-of-clay-particles-on-dripper-clogging-21186.html
» https://www.hilarispublisher.com/abstract/influence-of-concentration-and-type-of-clay-particles-on-dripper-clogging-21186.html -
Ouarriche, H., Bouhali, M. El, Bouisfi, F., Chaoui, M., & Hannaoui, M. (2020). Numerical simulation of flow in trapezoidal labyrinth-channels of drip irrigation. FME Transactions, 49, 147-153. https://doi.org/10.5937/FME2101147O
» https://doi.org/10.5937/FME2101147O -
Pereira, D. J. de S., Lavanholi, R., de Araújo, A. C. S., de Camargo, A. P., Ait-Mouheb, N., Frizzone, J. A., & Molle, B. (2020). Evaluating sensitivity to clogging by solid particles in irrigation emitters: Assessment of a laboratory protocol. Journal of Irrigation and Drainage Engineering, 146 https://doi.org/10.1061/ (asce)ir.1943-4774.0001509
» https://doi.org/10.1061/ -
Qin, C., Zhang, J., Wang, Z., Lyu, D., Liu, N., Xing, S., Wang, F., Rodríguez Díaz, A., Qin, C., Zhang, J., Wang, Z., Lyu, D., Liu, N., Xing, S., & Wang, F. (2022). Anti-clogging performance optimization for shunt-hedging drip irrigation emitters based on water-sand motion characteristics. Water, 14 (23), 3901. https://doi.org/10.3390/W14233901
» https://doi.org/10.3390/W14233901 -
Qiu, X., Chen, G., Wang, H., Wang, C., & Wang, J. (2023). Vertical optimisation of tooth shape to improve the anti-clogging performance of emitters in drip irrigation systems. Biosystems Engineering, 233, 193-203. https://doi.org/10.1016/j.biosystemseng.2023.08.006
» https://doi.org/10.1016/j.biosystemseng.2023.08.006 -
Shen, Y., Puig-Bargués, J., Li, M., Xiao, Y., Li, Q., & Li, Y. (2022). Physical, chemical and biological emitter clogging behaviors in drip irrigation systems using high-sediment loaded water. Agricultural Water Management, 270, 107738. https://doi.org/10.1016/J.AGWAT.2022.107738
» https://doi.org/10.1016/J.AGWAT.2022.107738 -
Shi, K., Lu, T., Zheng, W., Zhang, X., & Zhangzhong, L. (2022). A review of the category, mechanism, and controlling methods of chemical clogging in drip irrigation system. Agriculture, 12 (2), 202. https://doi.org/10.3390/AGRICULTURE12020202
» https://doi.org/10.3390/AGRICULTURE12020202
-
Data Availability Statement:
The datasets generated during and/or analyzed during the current study are not publicly available due the data in the article have not been subjected to complex statistical analyses, but are available from the corresponding author on reasonable request. The datasets generated during and/or analyzed during the current study are available from the corresponding author on reasonable request.
-
Funding:
This study was financed in part by the Coordination for the Improvement of Higher Education Personnel – Brazil (CAPES) – Finance Code 001.
Edited by
-
Area Editor:
Fernando França da Cunha
The datasets generated during and/or analyzed during the current study are not publicly available due the data in the article have not been subjected to complex statistical analyses, but are available from the corresponding author on reasonable request. The datasets generated during and/or analyzed during the current study are available from the corresponding author on reasonable request.