 IMPROVING YIELD PREDICTION OF OAT AND SORGHUM BY INTEGRATION OF SAR AND OPTICAL DATA
ABSTRACT
Obtaining reliable yield data is a challenge. Optical remote sensing (RS) can be an alternative for yield prediction. However, one of its limitations lies in its wavelength, which captures only information from the top of the crop canopy. In contrast, synthetic aperture radar (SAR) has greater interaction with plants due to its distinct wavelength. Therefore, this study aimed to investigate whether the inclusion of SAR images in a dataset composed of optical vegetation indices (VIs) derived from different acquisition principles could enhance yield prediction performance. Using yield monitor data as reference for oat and sorghum crops, we employed four optical vegetation indices (EVI, TCG, PVI, and SFDVI) from Sentinel-2 and three SAR variables (VH, VV, and DPSVI) from Sentinel-1 at the peak vegetative stage of the crops. In addition, for SAR images, we tested three different backscatter normalizations: σ0, β0, and γ0. Correlation analysis, principal component analysis, and machine learning techniques were applied for prediction using the Random Forest algorithm under multiple scenarios, aiming to compare predictive performance with and without SAR data inclusion. When only one vegetation index was used, the addition of SAR data contributed to yield prediction. However, when multiple optical vegetation indices were employed together, SAR data no longer added predictive power to the model. Thus, for short-stature crops such as oat and sorghum, the inclusion of SAR data does not provide predictive gains; therefore, the use of optical vegetation indices derived from different acquisition principles is sufficient for yield prediction.
KEYWORDS
radar remote sensing; machine learning; DPSVI; backscatter coefficient
INTRODUCTION
Precision agriculture (PA) aims to optimize input use and improve crop management by the identification and handling of spatial variability (Gebbers & Adamchuk, 2010). For this purpose, the availability of yield data across fields is essential to map variation patterns, support decision-making, assess crop responses to site-specific management, and improve predictive models. However, one of the challenges lies in obtaining reliable data from yield monitors (Arslan & Colvin, 2002; Blackmore & Marshall, 2015).
In this context, the use of satellite-based optical remote sensing (RS) is an alternative that enables the assessment of crop development and the inference of yield (Sishodia et al., 2020; Weiss et al., 2020). Studies using this approach commonly convert spectral band reflectance data into vegetation indices (VIs), which highlight canopy attributes of interest (Jensen, 2009). Varela et al. (2021), using VIs derived from multispectral images combined with machine learning (ML) algorithms, obtained coefficients of determination (r2) ranging from 0.59 to 0.63 for sorghum yield prediction. Similarly, Karongo et al. (2025) reported a maximum r2 of 0.59 when employing multispectral data and ML for the same crop. Nonetheless, this predictive performance is insufficient to estimate yield at the field scale and effectively support decision-making in PA. The Remote Sensing-based yield predictions rely on the direct relationship between vegetation indices and canopy biomass, and on the subsequent association between biomass and grain yield (Delécolle et al., 1992). However, higher biomass does not always result in higher yields, since optical RS measures canopy top reflectance, which may not adequately represent crop vigor and yield components. Furthermore, in many agricultural regions, cloud cover during the crop growing season is frequent, often preventing the acquisition of optical satellite imagery at the desired time, thereby compromising inference and predictive modeling (Prudente et al., 2020).
Alternatively, Synthetic Aperture Radar (SAR) remote sensing systems are increasingly being explored for agricultural applications due to their radar wavelength, which enables the retrieval of different types of information about targets (Hashemi et al., 2024; McNairn & Shang, 2016). SAR images have distinct characteristics compared to optical data, such as their ability to penetrate objects, reduced sensitivity to cloud cover, and the capability to control the polarization of the measured electromagnetic radiation (Schmugge, 1983). The primary parameter in SAR imagery is the backscatter per unit area, whose interaction with the crop canopy provides information on biomass per unit volume, gravimetric water content, and plant structure (Dong et al., 2006; Ribbes & Letoan, 1999). In contrast, the interaction of waves captured by optical sensors varies depending on the material composition (Jensen, 2009). Studies using SAR images alone for crop yield prediction have already been conducted, such as those by Sun et al. (2023) and Parida & Singh (2023), which reported r2 values of 0.67 and 0.54 for rice and wheat, respectively. Although backscatter is highly sensitive to changes in cereal crop vegetation (Vreugdenhil et al., 2018), the exclusive use of SAR images has not yet provided satisfactory results for predicting the yield of short-stature crops in PA. This limitation is consistent with findings from the few available studies that employed only optical RS data (Karongo et al., 2025; Sun et al., 2023; Varela et al., 2021).
Research such as that of Alebele et al. (2021), Cunha et al. (2024), and Hosseini et al. (2020) has demonstrated that the predictive performance of ML models can be enhanced when optical and SAR imagery are integrated. However, these studies primarily focused on crops with well-structured canopies and high-leaf area index (LAI) at peak vegetative stage, conditions that are generally not observed in short-stature grasses grown as off-season crops, such as oat and sorghum. Thus, the incorporation of SAR-derived information may capture a broader range of canopy characteristics beyond the spectral mixture of plant and soil, potentially leading to more reliable yield predictions, as SAR features provide insights into crop canopy structure. Therefore, this study evaluated whether the inclusion of SAR images can improve yield prediction models when combined with optical VIs.
MATERIAL AND METHODS
The study was conducted in a commercial grain and cereal production area of approximately 107 hectares, located in the municipality of Cosmópolis, inland São Paulo State, Brazil (22°41′55.16″S, 47°10′34.15″W) (Figure 1). Yield data, optical RS data from the multispectral optical sensor (MSI – Sentinel-2), and synthetic aperture radar (SAR – Sentinel-1) data were used, all collected during the peak vegetative stage of oat and sorghum crops. From these two types of sensor data, four optical vegetation indices (VIs) based on different acquisition principles (EVI, PVI, TCG, and SFDVI) were calculated, along with SAR-derived backscatter coefficients (VV and VH) and a SAR-based VI (DPSVI), using different backscatter normalizations (σ0, β0, and γ0). To explore the complementarity between SAR images and optical vegetation indices, yield prediction scenarios were created and evaluated using the Random Forest algorithm. For comparison, predictions using only optical indices were also conducted, serving as a reference for the analysis of results.

The experimental area dataset consisted of dry grain yield (t/ha) from off-season crops, including two sorghum seasons (2021 and 2023) and one oat season (2022) (Figure 1). Yield data were obtained using a monitor installed on the harvester. To minimize errors and inconsistencies, we adopted the filtering procedure suggested by Maldaner et al. (2021), ensuring data quality. In addition, to avoid external influences on the crop, such as access roads and field borders, a 15 m buffer was applied around each plot, and only the data within these limits were considered. After this process, 15,000 points were randomly selected from the remaining dataset to continue the analyses, optimizing data processing and interpretation while preserving the statistical representativeness of the datasets (Table 1).
Descriptive statistics of the complete datasets after the filtering procedure (Total) and of the 15,000 randomly selected points (Selected) for each season.
Optical data
The optical images used onboard the Sentinel-2 mission were already processed with atmospheric correction (Level 2A). These images have a spatial resolution of 10 m and a temporal resolution of 5 days, which is suitable for various agricultural applications, including yield prediction at different crop growth stages (Amaral et al., 2024; de Freitas et al., 2024). Images were selected during the peak vegetative stage, when canopy cover is denser and, consequently, soil interference is minimized, since short-stature crops such as sorghum and oat are more susceptible to soil influence at other stages. Identification of this period was carried out using a time series of the EVI index derived from Sentinel-2 images.
The use of VIs based on different acquisition principles enhances the performance of yield prediction models when compared to their isolated use (Amaral et al., 2024). Thus, four optical VIs from distinct groups for vegetation characterization were calculated: EVI, SFDVI, PVI, and TCG (Table 2). The Enhanced Vegetation Index (EVI) is based on the slope of the spectrum between the absorption and reflectance peaks of photosynthetically active vegetation, i.e., it relies on the difference between near-infrared (NIR) and red reflectance, as vigorous plants strongly reflect in the NIR and weakly in the red (Huete et al., 2002). The Spectral Feature Depth Vegetation Index (SFDVI) belongs to the group of spectral feature depth indices, which are based on measuring the depth of spectral features. It calculates the difference between the integration of maximum reflectance in the green and NIR bands and the integration of spectral characteristics in the red (R) and red-edge (RE) regions. This index was specifically developed for this purpose (Baptista, 2015). The Perpendicular Vegetation Index (PVI) is derived from the soil line and expresses the relationship between red and NIR bands (Richardson & Wiegand, 1977). It represents the orthogonal distance of each pixel from the soil line in the red–NIR space. In this study, PVI values were obtained from Sentinel-2 scenes based on empirical regression coefficients between red and NIR bands (see Supplementary Material). The Tasseled Cap Greenness (TCG) belongs to the group of indices based on orthogonal axes. It assigns specific weights to the MSI spectral bands to efficiently represent vegetation “greenness” (Kauth & Thomas, 1976), including the shortwave infrared bands (SWIR1 and SWIR2). This index corresponds to the Greenness component of the Tasseled Cap transformation, which emphasizes vegetation variation from the soil line to crop maturity. In this study, we used TCG with weights adjusted to Sentinel-2 bands (Table 2).
Slope (a) and intercept (b) coefficients for each Sentinel-2 image used in the calculation of PVI.
SAR data
SAR images from the Sentinel-1 mission were collected on dates close to those of the optical images (Table 3). Although the revisit time is 12 days and does not exactly coincide with Sentinel-2 acquisition dates, the difference between the two satellites was less than 5 days. During this period, corresponding to the peak vegetative stage, no major variation in crop development is expected, which minimizes the impact of this temporal difference. These images are freely available from the European Space Agency (ESA) and were accessed by the Alaska Satellite Facility (ASF) platform (https://search.asf.alaska.edu). The SAR images were acquired at the GRD (Ground Range Detected) level in IW (Interferometric Wide) mode, in which the sensor operates with dual polarization: VH (vertical transmit, horizontal receive) and VV (vertical transmit, vertical receive). The images have a spatial resolution of 10 m, matching the spatial resolution of the optical data (ESA, 2025).
Acquisition dates of Sentinel-1 (SAR) and Sentinel-2 (optical) images for the different crops analyzed.
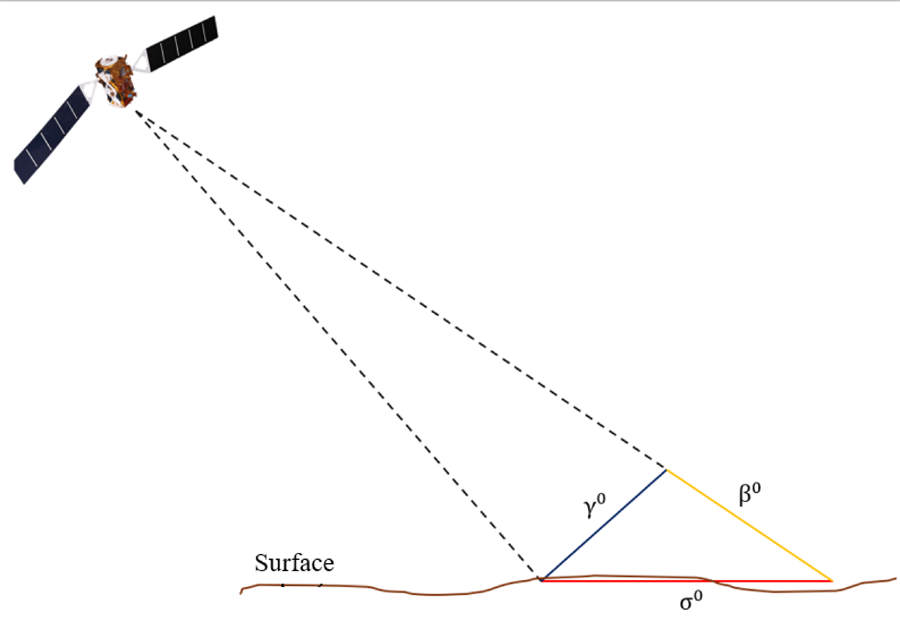
SAR images were preprocessed using the open-source software SNAP (version 7.0), provided by ESA. The procedure described by Filipponi (2019) was adopted to extract the backscatter coefficients corresponding to the three normalizations: Beta (𝛽𝑉𝑉0𝑒𝛽𝑉𝐻0), Gamma (𝛾𝑉𝑉0𝑒𝛾𝑉𝐻0), and Sigma (𝜎𝑉𝑉0𝑒𝜎𝑉𝐻0). In SAR imagery, backscatter coefficients quantify the intensity of the radar signal reflected by the surface. Due to the side-looking geometry of the sensor acquisition, these coefficients are expressed by three main normalizations: Beta (β0), Sigma (σ0), and Gamma (γ0) (Figure 2). Beta represents the backscatter relative to the radar incidence plane, measuring signal scattering without considering surface topography. It is also referred to as radar brightness, as it represents the intensity of the reflected signal before any incidence angle normalization (Raney et al., 1994). Sigma is the most used normalization since it corrects for the effect of incidence angle, adjusting backscatter to the ground range geometry. Gamma, in turn, is adjusted to the plane perpendicular to the slant range (Small, 2011). Differences in backscatter normalizations may influence the relationship between these measures and the analyzed crop, as factors such as phenology and plant development affect backscatter behavior (McNair & Shang, 2016).
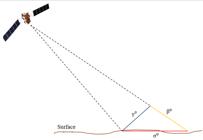
Illustrative scheme of backscatter coefficient normalizations in synthetic aperture radar (SAR) images: Sigma (σ⁰), Beta (β⁰), and Gamma (γ⁰). σ⁰ (red) represents scattering relative to the local surface; β⁰ (yellow) refers to scattering relative to the plane perpendicular to the sensor’s line of sight; and γ⁰ (blue) is defined relative to the vertical of the terrain. The dashed line represents the SAR sensor beam, and the terrain surface is indicated by an irregular brown line, highlighting the influence of topography on the radar response.
The preprocessing of Sentinel-1 SAR images consisted of seven steps: applying orbit files, thermal noise removal, border noise removal, radiometric calibration, speckle filtering, terrain correction, and transformation to decibels (Filipponi, 2019). The first three steps were conducted using the default settings of the processing software. Subsequently, radiometric calibration was carried out to generate Sigma naught (σ0), Gamma naught (γ0), and Beta naught (β0) as output bands, allowing the evaluation of which normalization best correlates with yield prediction. To reduce speckle noise, the Boxcar filter was applied, since it is less complex and, moreover, the choice of filter type does not affect yield prediction (Cunha et al., 2024). Terrain correction was conducted using a digital elevation model (DEM) from the PALSAR sensor, with a spatial resolution of 12.5 m, obtained by the Alaska Satellite Facility platform (https://search.asf.alaska.edu/). Finally, the conversion from intensity to dB was carried out as the last preprocessing step. Thus, each Sentinel-1 image resulted in six images after pre-processing, corresponding to the combinations of backscatter normalizations and polarizations: 𝜎𝑉𝑉0,𝜎𝑉𝐻0,𝛽𝑉𝑉0,𝛽𝑉𝐻0,𝛾𝑉𝑉0 ∧ 𝛾𝑉𝐻0.
In addition, based on these images, the DPSVIm (Modified Dual Polarization SAR Vegetation Index) (Eq. 1) was calculated for each normalization. This dual-polarization index, modified to incorporate SAR signal intensities, provides greater sensitivity to variations in vegetation biomass (dos Santos et al., 2021). DPSVIm was chosen due to its strong performance in prediction studies (Cunha et al., 2024; dos Santos et al., 2021). Thus, in addition to the six bands generated during preprocessing (𝜎𝑉𝑉0,𝜎𝑉𝐻0,𝛽𝑉𝑉0,𝛽𝑉𝐻0,𝛾𝑉𝑉0 𝑒 𝛾𝑉𝐻0), three additional images were obtained corresponding to the DPSVIm calculated for each normalization: DPSVImβ, DPSVImγ, DPSVImσ.
Data analysis
To analyze the data, values from optical and SAR images at the coordinates of the 15,000 yield points were extracted. The data were then subjected to linear correlation analysis, principal component analysis (PCA), and an initial prediction using all SAR and optical images. These analyses were conducted to understand the relationship and relevance of the variables to yield, as well as their interdependence within remote sensing datasets, aiming to identify and remove redundant variables. Eliminating redundancy in existing datasets can improve the efficiency of machine learning (ML) model training (Li et al., 2023). Based on these results, SAR images from a single normalization (Sigma – σ0) were selected to proceed with subsequent analyses.
Initially, the predictions were composed of only one optical index and one SAR image, namely EVI and VH, respectively, which formed the scenario referred to as “EVI+VH”. These images were selected because they showed stronger statistical correlation with yield (VH: 0.21, -0.07, -0.23, and EVI: 0.59, 0.36, 0.50, respectively for the 2021, 2022, and 2023 growing seasons), as well as higher relevance in PCA and variable importance analyses. This scenario was compared to predictions using EVI alone. Subsequently, to enhance predictive performance, these two scenarios (EVI and EVI+VH) were compared to a third scenario composed of four optical vegetation indices (VIs) based on different acquisition principles, referred to as “4VIs”. Amaral et al. (2024) demonstrated that the use of VIs derived from different acquisition principles improves the performance of yield prediction models compared to relying on a single vegetation index.
Given the strong performance achieved with the set of four optical vegetation indices based on different spectral principles (4VIs), two additional scenarios were tested to assess potential gains in performance with the inclusion of SAR variables. The first scenario consisted of combining the 4VIs with the SAR image from VH polarization, referred to as “4VIs + VH”. The second scenario included, in addition to the 4VIs, three SAR variables (VH, VV, and DPSVI), referred to as “4VIs + VH + VV + DPSVI”. These two scenarios were compared to the scenario using only the optical indices based on different acquisition principles (4VIs), aiming to evaluate whether the inclusion of SAR images and other vegetation indices could improve yield prediction.
For yield prediction, the Random Forest (RF) regression algorithm (Breiman, 2001) was used due to its ability to handle large datasets and noise (Viljanen et al., 2018). For model development, the datasets from each growing season were randomly divided into 70% for training and 30% for testing. The model hyperparameters were optimized for each season using Bayesian optimization. The performance of the scenarios was evaluated based on RMSE (Root Mean Square Error) and R2 metrics for the test sets of each season.
RESULTS AND DISCUSSION
Normalizations
The results from correlation, PCA, and variable importance analyses indicated no differences between the different backscatter coefficient normalizations with respect to yield. The correlation between SAR images with different normalizations showed an almost perfect relationship (R2 ≈ 1 – Supplementary Material S2, S3, and S4), with identical correlation values with crop yield.
Correlation between yield of the first sorghum crop (Sorghum 21) and remote sensing images (vegetation indices and SAR data).
Correlation between oat yield (Oat 22) and remote sensing images (vegetation indices and SAR data).
Correlation between the second sorghum crop yield (Sorghum 23) and remote sensing images (vegetation indices and SAR data).
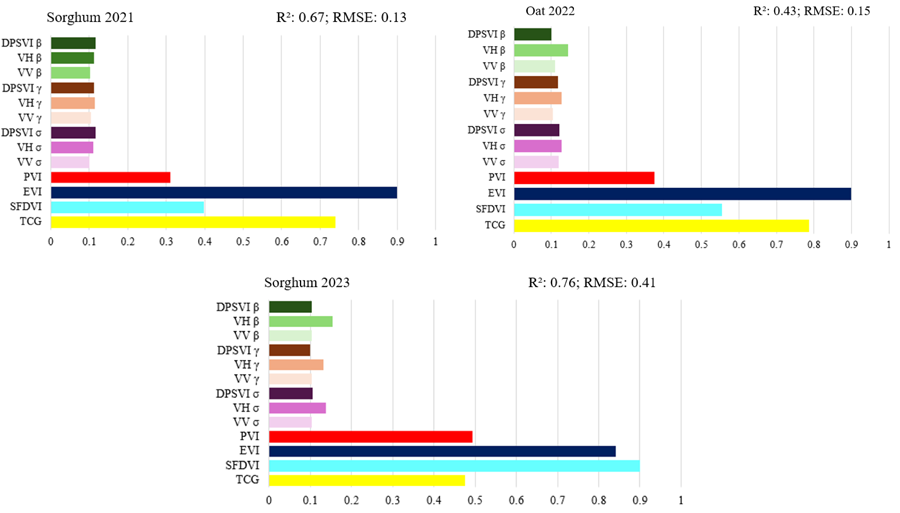
Moreover, in the PCA analysis, the factor loadings, which indicate the degree of correlation between the original variables and the extracted components/factors (Supplementary Material S5), were identical across SAR images from different normalizations. When evaluating variable importance within the Random Forest (RF) model, in which all variables were included, the different normalizations exhibited the same level of importance (Figure 3). Although each normalization is associated with a distinct physical representation of the backscattered energy, which may vary depending on the crop canopy, the normalizations are more strongly related to terrain topography. Sigma (σ⁰) is most used in applications involving flat terrain, while Gamma (γ⁰) is preferred for areas with more complex topography, such as slopes, since it normalizes radar backscatter relative to the vertical of the sloped surface (Small, 2011). Most studies employ Sigma (σ⁰) as an input variable in machine learning algorithms for agricultural predictions using these data (Cunha et al., 2024; Alebele et al., 2021; Vreugdenhil et al., 2018). Therefore, in areas with gentle relief, any form of backscatter normalization (σ⁰, γ⁰ or β⁰) can be used for yield studies in smallholder crops. As the study area presents relatively flat topography (elevation ranging from 530 to 580 m) and no differences were found between normalizations, we chose to use only Sigma for the prediction scenarios, as it is the most applied in the literature and represents the intensity of backscatter relative to the ground surface.
Loadings and cumulative variance (CV) values from principal component analysis applied to remote sensing data, showing up to the third principal component for each crop season.

Performance and importance of predictor variables including all optical and SAR remote sensing data across the three growing seasons.
EVI + SAR
In the first prediction, we evaluated the performance of combining SAR data (VH polarization) with the optical vegetation index EVI, compared to the exclusive use of EVI. The objective was to verify whether the inclusion of SAR imagery could enhance predictive capacity relative to using only the optical index. VH was selected because it showed the highest relevance in the Random Forest models, as well as in correlation and PCA analyses. Moreover, studies such as Tesfaye et al. (2022) demonstrated the superiority of VH polarization for wheat yield prediction in smallholder areas, with the additional advantage of being a native radar band, thus requiring no additional calculations as in the case of DPSVI. Similarly, EVI stood out in its relationship with yield, in addition to being less prone to saturation and showing strong associations with yield variability in cereal crops (Wang et al., 2024).
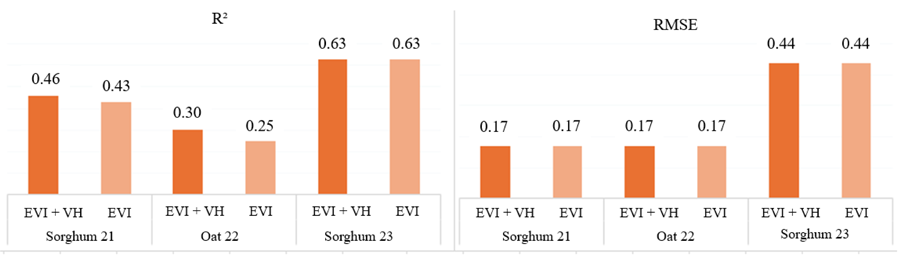
The incorporation of VH into EVI improved performance compared to using EVI alone. EVI provides information related to photosynthetic activity and canopy vigor (Huete et al., 2002). In contrast, VH polarization is effective in detecting changes in the physical structure of vegetation (Shang et al., 2022). This superior performance may be related to the ability of the VH channel to capture structural variations in the canopy, such as stem and leaf density, which are not detected by optical bands, thus providing complementary information for yield prediction. In agricultural areas, especially during advanced growth stages, SAR VH response tends to increase with biomass accumulation and greater structural complexity (McNairn & Shang, 2016), providing additional information on plant structure. Therefore, when using only one vegetation index, the SAR image contributes to improving predictive performance compared to relying on a single optical vegetation index.

R2 and RMSE values for the scenarios using VH and EVI (VH+EVI) together compared to yield prediction based exclusively on EVI.
Optical indices from different acquisition principles
Although SAR images show complementary potential to optical sensors (Alebele et al., 2021; Cunha et al., 2024; Hosseini et al., 2020), their processing requires specialized technical knowledge, higher computational cost, and additional preprocessing steps, making them operationally more complex compared to images from optical sensors. In this context, Amaral et al. (2024) have shown that combining different optical vegetation indices based on distinct principles increases the predictive capacity of models compared to the use of a single index. These authors also observed that spectral diversity enhances the representation of crop conditions. Therefore, to simplify and improve predictive performance, we compared predictions using these four optical indices (4VIs) to those obtained using only EVI and the combination of EVI+VH.
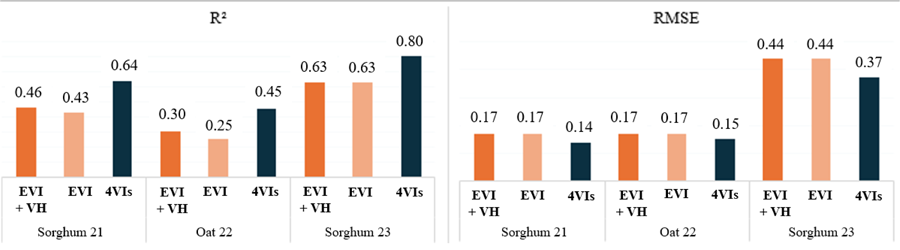
When comparing the prediction obtained with the four optical indices (4VIs) to that of EVI+VH or EVI alone, we found that the exclusively optical indices (4VIs) delivered superior performance (Figure 5). The use of a single index, such as EVI, even though showing the highest correlation with yield, limits the representation of canopy variability to a single biophysical aspect (Huete et al., 2002), whereas combining VIs derived from different bands and spectral principles expands the ability to capture multiple aspects of canopy spatial variability. Furthermore, although VH improves predictive performance when combined with EVI, the four optical vegetation indices show stronger relationships with yield and, despite redundancy, increase the sensitivity of machine learning algorithms to yield variability, ultimately enhancing predictive performance when used together. Therefore, employing a set of optical vegetation indices provides superior predictive performance compared to using a single optical index or combining one optical index with a SAR image.

R2 and RMSE values for predictions using VH and EVI (VH+EVI) together, EVI alone, and compared to predictions using the four vegetation indices from different acquisition principles (4VIs).
Optical Indices from Different Acquisition Principles + SAR
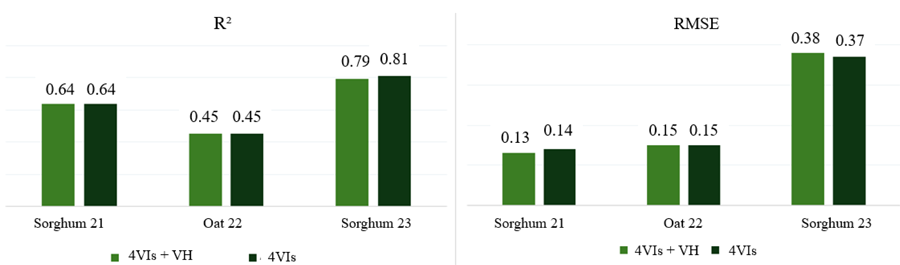
The use of multiple optical vegetation indices (VIs), based on different spectral principles, achieved superior predictive performance when compared to their combination with VH polarization (Figure 6). Since SAR imagery is derived from a distinct acquisition principle and captures complementary information to that of optical sensors, its inclusion alongside the four optical indices was expected to enhance the ability to represent yield variability. However, the results indicated that the exclusive use of the four optical indices (4VIs) achieved similar, or even superior, performance compared to the scenario in which SAR imagery (VH) was incorporated (Figure 6). This behavior is corroborated by the spatial analysis: when VH was included with the 4VIs (4VIs + VH), the predicted yield distribution remained highly similar to that obtained using only optical indices, while also closely matching the actual values represented by yield point data (Figure 7). Thissuggests that the spectral diversity provided by the optical indices alone is sufficient to effectively characterize yield variability in the studied areas. Although SAR images are sensitive to attributes not captured by optical data, such as biomass and moisture, and have demonstrated potential when combined with optical data in other crops, such as rice (Alebele et al., 2021), no significant improvements were observed for sorghum and oats. This difference can be attributed to cropping systems: rice is an irrigated crop, where the water layer directly influences radar backscatter, in addition to exhibiting greater canopy coverage, which enhances volume scattering and multiple reflections between plants and water (Chen & Mcnairn, 2006). In contrast, sorghum and oats are drought-tolerant crops, cultivated without irrigation under low rainfall, and characterized by less canopy closure, which increases soil influence on the backscattered signal. Therefore, under the conditions analyzed, optical indices alone proved sufficient for yield prediction in sorghum and oats, with no significant gain from the inclusion of SAR variables.

Comparison of R2 (a) and RMSE (b) values for predictions using the four optical indices combined with VH (4VIs + VH) versus the exclusive use of the four optical indices (4VIs).

Comparative maps of predicted yield in 30% of the test points for the scenarios “4VIs + VH” and “4VIs”, compared to the actual yield map obtained from the grain harvester. The error maps highlight discrepancies between observed and predicted values.
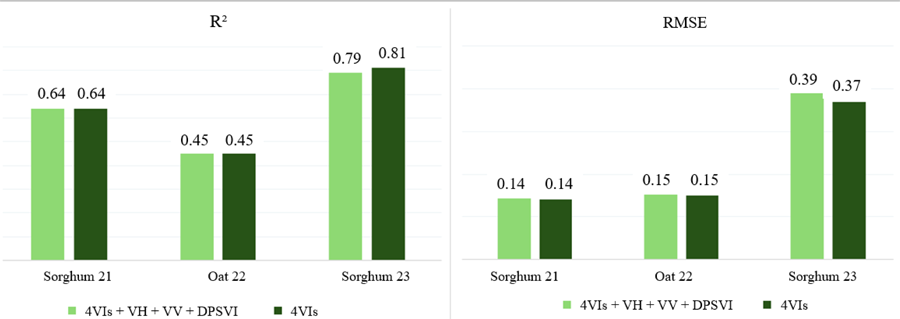
By increasing the number of SAR images and combining all products used (VV, VH, and DPSVI) with the four optical indices, predictive performance decreased compared to the exclusive use of optical indices with different acquisition principles (Figure 8). The inclusion of multiple SAR images, considering their lower importance and correlation with yield, together with optical indices may introduce information redundancy, increasing model complexity without improving predictive performance (Li et al., 2023). Although optical indices also present redundancy, they show stronger correlations with yield and cover a broader range of information across the spectrum. In contrast, SAR data are limited to two polarizations, with DPSVI derived from them and highly correlated with these polarizations, while maintaining weak correlations with yield. This can introduce noise into predictions. One of the causes of such low correlation is the inherent noise in SAR images, known as speckle, generated by the interaction of radar signals with targets. Even when smoothing filters are applied, this noise still hampers the detection of patterns related to field variability, negatively affecting prediction accuracy in cereal crops (Shang et al., 2013). On the other hand, optical sensors directly capture spectral information related to crop vigor, particularly during the peak vegetative stage, when vigor is highest. Despite the predominance of volume scattering at the crop’s vegetative peak, caused by greater leaf cover and moisture retention in the canopy, which increase backscatter and affect the radar signal (Ulaby et al., 1981), this effect could potentially complement optical data. Nevertheless, for oat and sorghum, which are shorter crops, radar signals are more influenced by soil moisture or crop residues (Jiao et al., 2011), factors not directly linked to yield. Thus, when multiple optical vegetation indices are used, the inclusion of SAR images becomes less relevant, as variability is already well represented by the VIs, which have stronger correlations with yield and greater influence on prediction. Although radar offers operational advantages, such as independence from atmospheric conditions and sensitivity to structural attributes of crops, its usefulness for yield prediction studies may be limited when relying on single-date images. Therefore, incorporating multiple SAR-derived products from a single image into models using optical VIs from different spectral principles proves unnecessary, since it does not improve predictive performance, making the exclusive use of optical VIs more efficient for this type of analysis.

Comparison of R2 (a) and RMSE (b) values for predictions using the four optical indices combined with the three SAR images (4VIs + VH + VV + DPSVI) versus the exclusive use of the four optical indices (4VIs).
CONCLUSIONS
In this study, we evaluated scenarios combining SAR and optical imagery to explore the complementarity of these sources in improving yield prediction performance for oat and sorghum, short stature, rainfed off-season crops. Regarding the normalization of SAR backscatter coefficients (σ0, β0, and γ0), no differences were observed in their relationships with yield, indicating that any of these normalizations can be applied for yield-related analyses in the studied crops.
When only a single vegetation index was used, SAR data contributed to yield prediction, improving performance compared to a single optical index. However, when vegetation indices derived from different spectral principles were employed together, SAR data no longer added predictive power to the model. Therefore, for short-stature crops such as oat and sorghum, the inclusion of SAR variables does not enhance predictive performance, and the use of optical vegetation indices based on different acquisition principles is sufficient for yield prediction.
ACKNOWLEDGMENTS
We thank the Brazilian Federal Agency for Support and Evaluation of Graduate Education (CAPES) – Finance Code 001, for the scholarship granted to the first author, and the São Paulo Research Foundation (FAPESP) for the scholarship granted to the second author (grant no. 2024/14044-4). This research was supported by financial assistance from FAPESP (grant no. 2022/03160-8). We are also grateful to Fazenda São José for providing the study area and yield data, without which this research would not have been possible.
REFERENCES
-
Alebele, Y., Wang, W., Yu, W., Zhang, X., Yao, X., Tian, Y., Zhu, Y., Cao, W., & Cheng, T. (2021). Estimation of crop yield from combined optical and SAR imagery using Gaussian kernel regression. IEEE Journal of Selected Topics in Applied Earth Observations and Remote Sensing, 14, 10520-10534. https://doi.org/10.1109/JSTARS.2021.3118707
» https://doi.org/10.1109/JSTARS.2021.3118707 -
Amaral, L. R., Oldoni, H., Baptista, G. M. M., Ferreira, G. H. S., Freitas, R. G., Martins, C. L., Cunha, I. A., & Santos, A. F. (2024). Remote sensing imagery to predict soybean yield: a case study of vegetation indices contribution. Precision Agriculture, 25 (5), 2375-2393. https://doi.org/10.1007/S11119-024-10174-5/FIGURES/8
» https://doi.org/10.1007/S11119-024-10174-5/FIGURES/8 -
Arslan, S., & Colvin, T. S. (2002). Grain yield mapping: Yield sensing, yield reconstruction, and errors. Precision Agriculture, 3 (2), 135-154. https://doi.org/10.1023/A:1013819502827/METRICS
» https://doi.org/10.1023/A:1013819502827/METRICS - Baptista, G. M. de M. (2015). Aplicação do Índice de Vegetação por Profundidade de Feição Espectral (SFDVI - Spectral Feature Depth Vegetation Index) em dados RapidEye. In Anais do XVII Simpósio Brasileiro de Sensoriamento Remoto (SBSR) (pp. 2277-2284). Instituto Nacional de Pesquisas Espaciais - INPE.
-
Breiman, L. (2001). Random forests. Machine Learning, 45 (1), 5-32. https://doi.org/10.1023/a:1010933404324
» https://doi.org/10.1023/a:1010933404324 -
Blackmore, B. S., & Marshall, C. J. (2015). Yield Mapping; Errors and Algorithms 403-415. https://doi.org/10.2134/1996.PRECISIONAGPROC3.C44
» https://doi.org/10.2134/1996.PRECISIONAGPROC3.C44 -
Chen, C., & Mcnairn, H. (2006). A neural network integrated approach for rice crop monitoring. International Journal of Remote Sensing, 27 (7), 1367-1393. https://doi.org/10.1080/01431160500421507
» https://doi.org/10.1080/01431160500421507 -
Cunha, I. A., Baptista, G. M. M., Prudente, V. H. R., Melo, D. D., & Amaral, L. R. (2024). Integration of Optical and Synthetic Aperture Radar Data with Different Synthetic Aperture Radar Image Processing Techniques and Development Stages to Improve Soybean Yield Prediction. Agriculture, 14 (11), 2032. https://doi.org/10.3390/AGRICULTURE14112032
» https://doi.org/10.3390/AGRICULTURE14112032 -
de Freitas, R. G., Oldoni, H., Joaquim, L. F., Pozzuto, J. V. F., & do Amaral, L. R. (2024). Predicting on-farm soybean yield variability using texture measures on Sentinel-2 image. Precision Agriculture, 25 (6), 2977-3000. https://doi.org/10.1007/S11119-024-10176-3
» https://doi.org/10.1007/S11119-024-10176-3 -
Delécolle, R., Maas, S. J., Guérif, M., & Baret, F. (1992). Remote sensing and crop production models: present trends. ISPRS Journal of Photogrammetry and Remote Sensing, 47 (2 - 3), 145 - 161. https://doi.org/10.1016/0924-2716 (92)90030-D
» https://doi.org/10.1016/0924-2716 (92)90030-D -
Dong, Y., Sun, G., & Pang, Y. (2006). Monitoring of rice crop using ENVISAT ASAR data. Science in China Series D, 49 (7), 75 - 763. https://doi.org/10.1007/S11430-006-0755-0
» https://doi.org/10.1007/S11430-006-0755-0 -
dos Santos, E. P., Da Silva, D. D., & do Amaral, C. H. (2021). Vegetation cover monitoring in tropical regions using SAR-C dual-polarization index: seasonal and spatial influences. International Journal of Remote Sensing, 42 (19), 7581-7609. https://doi.org/10.1080/01431161.2021.1959955
» https://doi.org/10.1080/01431161.2021.1959955 -
European Space Agency. (2025). Sentinel-1 mission overview. https://sentinels.copernicus.eu/web/sentinel/missions/sentinel-1
» https://sentinels.copernicus.eu/web/sentinel/missions/sentinel-1 -
Filipponi, F. (2019). Sentinel-1 GRD Preprocessing Workflow. Proceedings, 18 (1), 11. https://doi.org/10.3390/ECRS-3-06201
» https://doi.org/10.3390/ECRS-3-06201 -
Gebbers, R., & Adamchuk, V. I. (2010). Precision agriculture and food security. Science (New York, N.Y.), 327(5967), 828 - 831. https://doi.org/10.1126/science.1183899
» https://doi.org/10.1126/science.1183899 -
Hashemi, M. G. Z., Jalilvand, E., Alemohammad, H., Tan, P. N., & Das, N. N. (2024). Review of synthetic aperture radar with deep learning in agricultural applications. ISPRS Journal of Photogrammetry and Remote Sensing, 218, 20-49. https://doi.org/10.1016/J.ISPRSJPRS.2024.08.018
» https://doi.org/10.1016/J.ISPRSJPRS.2024.08.018 -
Hosseini, M., Becker-Reshef, I., Sahajpal, R., Fontana, L., Lafluf, P., Leale, G., Puricelli, E., Varela, M., & Justice, C. (2020). Crop yield prediction using integration of polarimteric synthetic aperture radar and optical data. Proceedings of the IEEE International Geoscience and Remote Sensing Symposium (IGARSS), 17-20. https://doi.org/10.1109/INGARSS48198.2020.9358978
» https://doi.org/10.1109/INGARSS48198.2020.9358978 -
Huete, A., Didan, K., Miura, T., Rodriguez, E. P., Gao, X., & Ferreira, L. G. (2002). Overview of the radiometric and biophysical performance of the MODIS vegetation indices. Remote Sensing of Environment, 83 (1-2), 195-213. https://doi.org/10.1016/S0034-4257 (02)00096-2
» https://doi.org/10.1016/S0034-4257 (02)00096-2 - Jensen, J. R. (2009). Sensoriamento remoto do ambiente: Uma perspectiva em recursos terrestres.
-
Jiao, X., Mc Nairn, H., Shang, J., Pattey, E., Liu, J., & Champagne, C. (2011). The sensitivity of RADARSAT-2 polarimetric SAR data to corn and soybean leaf area index. Canadian Journal of Remote Sensing, 37 (1), 69-81. https://doi.org/10.5589/M11-023
» https://doi.org/10.5589/M11-023 -
Karongo, J., Mwaniki, J. I., Ndiritu, J., & Mokaya, V. (2025). Sorghum yield prediction based on remote sensing and machine learning in conflict affected South Sudan. Scientific Reports 2025 15:1, 15 (1), 1-16. https://doi.org/10.1038/s41598-025-89030-z
» https://doi.org/10.1038/s41598-025-89030-z -
Kauth, R., & Thomas, G. (1976). The Tasselled Cap -- A Graphic Description of the Spectral-Temporal Development of Agricultural Crops as Seen by LANDSAT. LARS Symposia. https://docs.lib.purdue.edu/lars_symp/159
» https://docs.lib.purdue.edu/lars_symp/159 -
Li, K., Persaud, D., Choudhary, K., DeCost, B., Greenwood, M., & Hattrick-Simpers, J. (2023). Exploiting redundancy in large materials datasets for efficient machine learning with less data. Nature Communications 2023 14:1, 14 (1), 1-10. https://doi.org/10.1038/s41467-023-42992-y
» https://doi.org/10.1038/s41467-023-42992-y -
Maldaner, L. F., Corrêdo, L. de P., Canata, T. F., & Molin, J. P. (2021). Predicting the sugarcane yield in real-time by harvester engine parameters and machine learning approaches. Computers and Electronics in Agriculture, 181, 105945. https://doi.org/10.1016/J.COMPAG.2020.105945
» https://doi.org/10.1016/J.COMPAG.2020.105945 -
McNairn, H., & Shang, J. (2016). A review of multitemporal synthetic aperture radar (SAR) for crop monitoring. Remote Sensing and Digital Image Processing, 20, 317-340. https://doi.org/10.1007/978-3-319-47037-5_15/FIGURES/5
» https://doi.org/10.1007/978-3-319-47037-5_15/FIGURES/5 -
Parida, B. R., & Singh, S. (2023). Spatial mapping of winter wheat using C-band SAR (Sentinel-1A) data and yield prediction in Gorakhpur district, Uttar Pradesh (India). Journal of Spatial Science, 68 (1), 91-106. https://doi.org/10.1080/14498596.2021.1896393
» https://doi.org/10.1080/14498596.2021.1896393 -
Prudente, V. H. R., Martins, V. S., Vieira, D. C., Silva, N. R. de F. e., Adami, M., & Sanches, I. D. A. (2020). Limitations of cloud cover for optical remote sensing of agricultural areas across South America. Remote Sensing Applications: Society and Environment, 20, 100414. https://doi.org/10.1016/J.RSASE.2020.100414
» https://doi.org/10.1016/J.RSASE.2020.100414 -
Raney, R. K., Freeman, T., Hawkins, R. W., & Bamler, R. (1994). Plea for radar brightness. International Geoscience and Remote Sensing Symposium (IGARSS), 2, 1090 - 1092. https://doi.org/10.1109/IGARSS.1994.399352
» https://doi.org/10.1109/IGARSS.1994.399352 -
Ribbes, F., & Letoan, T. (1999). Rice field mapping and monitoring with RADARSAT data. International Journal of Remote Sensing, 20 (4), 745-765. https://doi.org/10.1080/014311699213172
» https://doi.org/10.1080/014311699213172 -
Richardson, A. J., & Wiegand, C. L. (1977). Distinguishing vegetation from soil background information. Photogrammetric Engineering and Remote Sensing, 1541-1552. https://www.asprs.org/wp-content/uploads/pers/1977journal/dec/1977_dec_1541-1552.pdf
» https://www.asprs.org/wp-content/uploads/pers/1977journal/dec/1977_dec_1541-1552.pdf -
Schmugge, T. (1983). Remote Sensing of Soil Moisture with Microwave Radiometers. Transactions of the ASAE, 26 (3), 0748 - 0753. https://doi.org/10.13031/2013.34017
» https://doi.org/10.13031/2013.34017 -
Shang, J., Jiao, X., McNairn, H., Kovacs, J., Walters, D., Ma, B., & Geng, X. (2013). Tracking crop phenological development of spring wheat using synthetic aperture radar (SAR) in Northern Ontario, Canada. 2013 2nd International Conference on Agro-Geoinformatics: Information for Sustainable Agriculture, Agro-Geoinformatics 2013, 517-521. https://doi.org/10.1109/ARGO-GEOINFORMATICS.2013.6621975
» https://doi.org/10.1109/ARGO-GEOINFORMATICS.2013.6621975 -
Shang, J., Liu, J., Chen, Z., McNairn, H., Davidson, A., Shang, J., Liu, J., Chen, Z., McNairn, H., & Davidson, A. (2022). Recent Advancement of Synthetic Aperture Radar (SAR) Systems and Their Applications to Crop Growth Monitoring. Recent Remote Sensing Sensor Applications - Satellites and Unmanned Aerial Vehicles (UAVs). https://doi.org/10.5772/INTECHOPEN.102917
» https://doi.org/10.5772/INTECHOPEN.102917 -
Sishodia, R. P., Ray, R. L., & Singh, S. K. (2020). Applications of Remote Sensing in Precision Agriculture: A Review. Remote Sensing, 12 (19), 3136. https://doi.org/10.3390/RS12193136
» https://doi.org/10.3390/RS12193136 -
Small, D. (2011). Flattening gamma: Radiometric terrain correction for SAR imagery. IEEE Transactions on Geoscience and Remote Sensing, 49 (8), 3081-3093. https://doi.org/10.1109/TGRS.2011.2120616
» https://doi.org/10.1109/TGRS.2011.2120616 -
Sun, C., Zhang, H., Xu, L., Ge, J., Jiang, J., Song, M., & Wang, C. (2023). Rice Yield Prediction Using Sentinel-1 Radar Vegetation Indices and XGBoost. 2023 SAR in Big Data Era, BIGSARDATA. https://doi.org/10.1109/BIGSARDATA59007.2023.10294885
» https://doi.org/10.1109/BIGSARDATA59007.2023.10294885 -
Tesfaye, A. A., Awoke, B. G., Sida, T. S., & Osgood, D. E. (2022). Enhancing Smallholder Wheat Yield Prediction through Sensor Fusion and Phenology with Machine Learning and Deep Learning Methods. Agriculture 2022, Vol. 12, Page 1352, 12 (9), 1352. https://doi.org/10.3390/AGRICULTURE12091352
» https://doi.org/10.3390/AGRICULTURE12091352 - Ulaby, F. T., Moore, R. K., & Fung, A. K. (1981). Microwave remote sensing: Active and passive. Volume 1 - Microwave remote sensing fundamentals and radiometry.
-
Varela, S., Pederson, T., Bernacchi, C. J., & Leakey, A. D. B. (2021). Understanding growth dynamics and yield prediction of sorghum using high temporal resolution UAV imagery time series and machine learning. Remote Sensing, 13 (9), 1763. https://doi.org/10.3390/RS13091763/S1
» https://doi.org/10.3390/RS13091763/S1 -
Viljanen, N., Honkavaara, E., Näsi, R., Hakala, T., Niemeläinen, O., & Kaivosoja, J. (2018). A Novel Machine Learning Method for Estimating Biomass of Grass Swards Using a Photogrammetric Canopy Height Model, Images and Vegetation Indices Captured by a Drone. Agriculture 2018, Vol. 8, Page 70, 8 (5), 70. https://doi.org/10.3390/AGRICULTURE8050070
» https://doi.org/10.3390/AGRICULTURE8050070 -
Vreugdenhil, M., Wagner, W., Bauer-Marschallinger, B., Pfeil, I., Teubner, I., Rüdiger, C., & Strauss, P. (2018). Sensitivity of Sentinel-1 Backscatter to Vegetation Dynamics: An Austrian Case Study. Remote Sensing, 10 (9), 1396. https://doi.org/10.3390/RS10091396
» https://doi.org/10.3390/RS10091396 -
Wang, Z., Zhang, C., Gao, L., Fan, C., Xu, X., Zhang, F., Zhou, Y., Niu, F., & Li, Z. (2024). Time Phase Selection and Accuracy Analysis for Predicting Winter Wheat Yield Based on Time Series Vegetation Index. Remote Sensing, 16 (11), 1995. https://doi.org/10.3390/RS16111995
» https://doi.org/10.3390/RS16111995 -
Weiss, M., Jacob, F., & Duveiller, G. (2020). Remote sensing for agricultural applications: A meta-review. Remote Sensing of Environment, 236, 111402. https://doi.org/10.1016/J.RSE.2019.111402
» https://doi.org/10.1016/J.RSE.2019.111402
-
DATA AVAILABILITY STATEMENT:
The datasets generated during and/or analyzed during the current study are available from the corresponding author on reasonable request.
Edited by
-
Area Editor:
Teresa Cristina Tarlé Pissarra
The datasets generated during and/or analyzed during the current study are available from the corresponding author on reasonable request.