
 Dengue virus introduction and 2025 outlook: scenario-based evaluation of vaccination impact using mathematical modeling
Abstract
This study aims to model multiple scenarios of dengue introduction and spread in Botucatu, São Paulo State, Brazil, and to evaluate the impact of vaccination strategies on the epidemic trajectory in a city that, until 2023, had less than 1% of its population infected with dengue. First, we estimated the basic reproduction number (R 0 ) during the 2024 epidemic and compared it with values reported in the literature. We then developed an age-stratified mathematical model, calibrated to 2024 dengue case data using a genetic algorithm, to simulate transmission dynamics with and without vaccination. This approach enabled us to assess the potential reduction in infections under various immunization scenarios. The estimated R 0 for the 2024 epidemic was 1.57, resulting in an attack rate exceeding 10% of the population. Our model accurately fits the observed data and suggests that, under conditions similar to those of 2024, the introduction of a new serotype in 2025 would likely trigger another epidemic. Vaccination could reduce this peak by up to 80%, depending on coverage among individuals aged 10-14 years. The results indicate that the R 0 of dengue estimated for Botucatu in 2024 is consistent with values reported for other Brazilian cities. The vaccination campaign shows the potential to reduce dengue cases by 75% or more. However, since campaign effectiveness depends on the circulating serotype and the epidemiological status of vaccinated individuals, achieving vaccination coverage above 50% in the target population is essential to avoid the need for individual epidemiological screening.
Keywords:
Basic Reproductive Number; Immunization Programs; Epidemiological Models
 Thumbnail
 Thumbnail
 Thumbnail
 Thumbnail
 Thumbnail
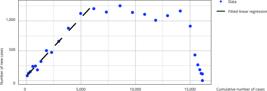
 Note: the dashed line represents the linear regression fitted to data collected up to the 10th Epidemiological Week of 2024. The estimated angular coefficient is Λ = 0.195 week-1.
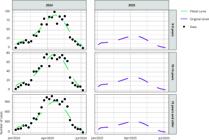
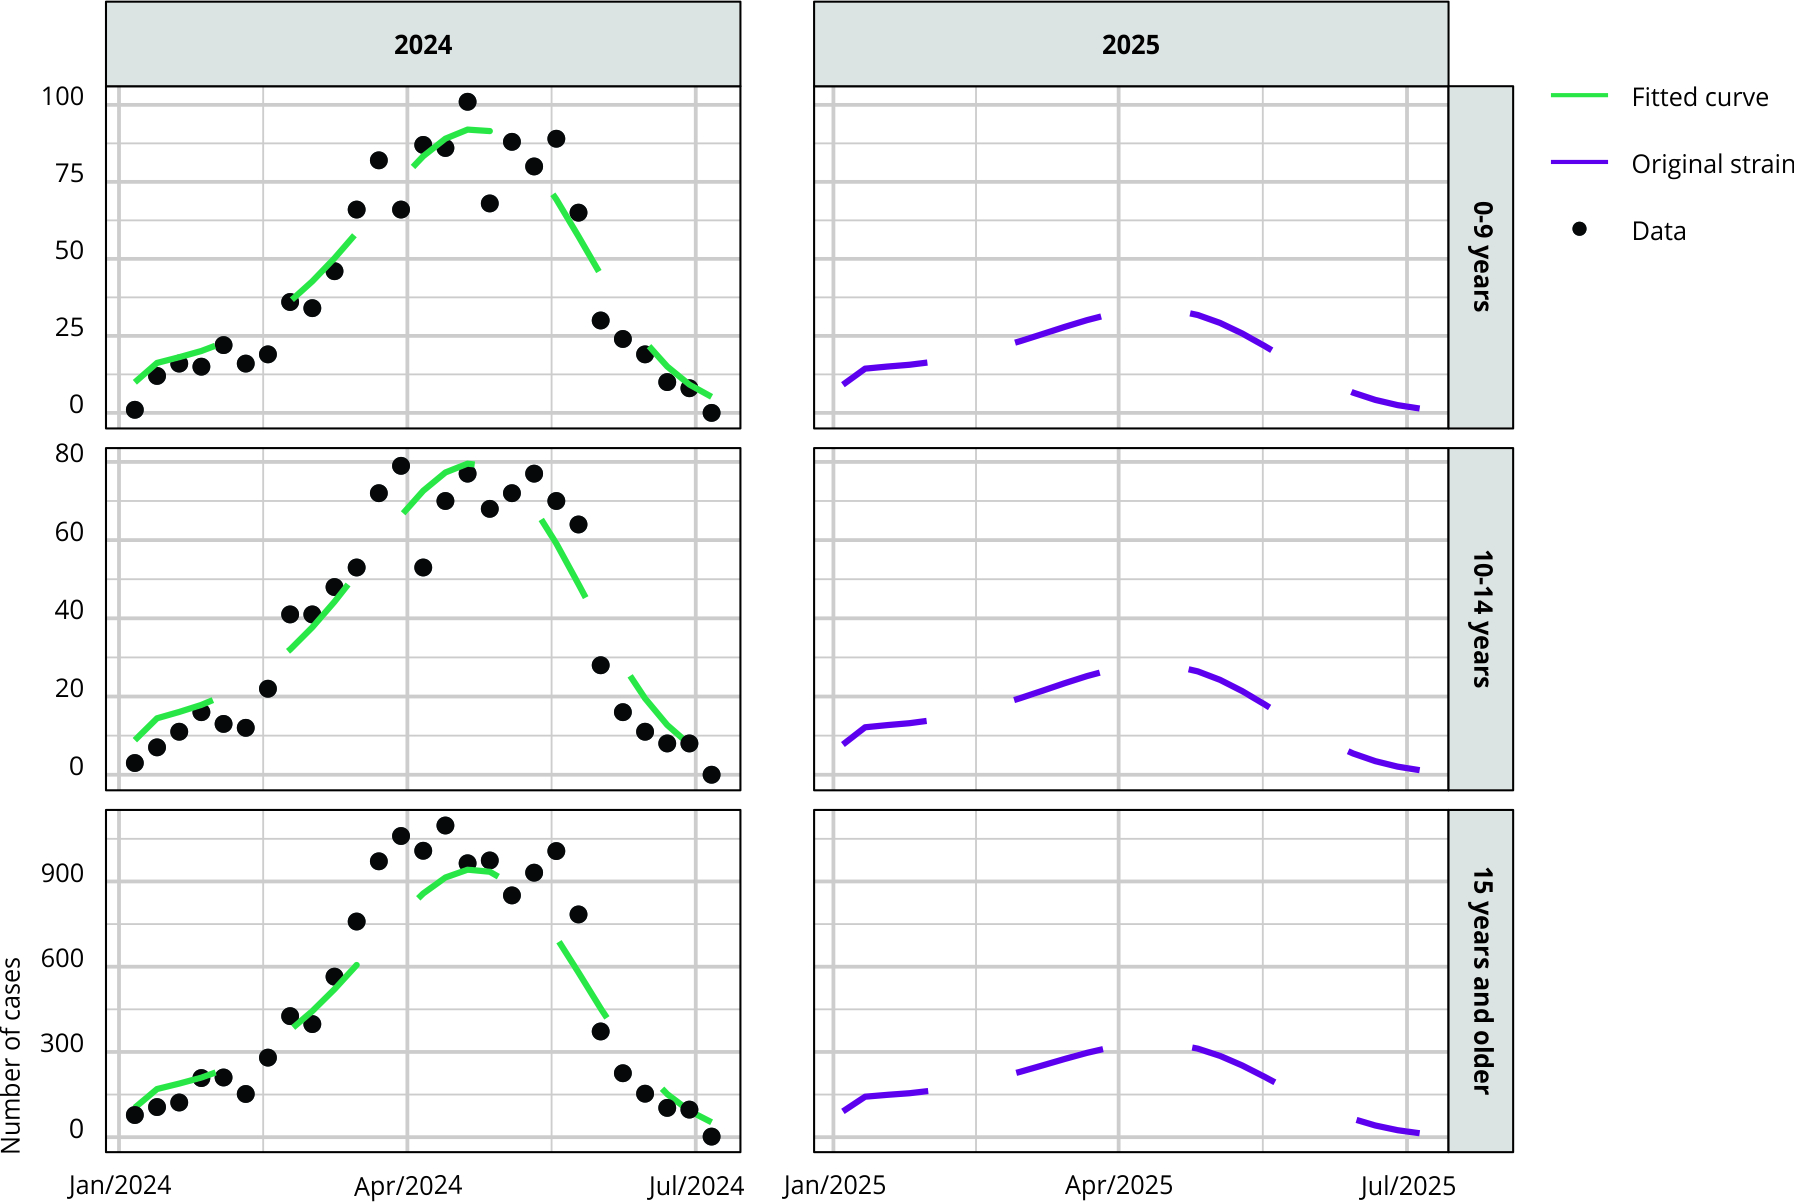 Note: reported data from 2024 are shown as black dots for the three age groups. The parameters estimated by the genetic algorithm (GA) are ba = [11.5, 19.4, 17.1] week-1, for each age group; bh = 0.054; bv = 0.0102; d = 0.48; and 𝐼 1,𝑎 0 = [24, 43, 35] individuals in each age group respectively. The other fixed parameters are µm =1/3 week-1, γ = 1.0 week-1; and η = 1.4 week-1.
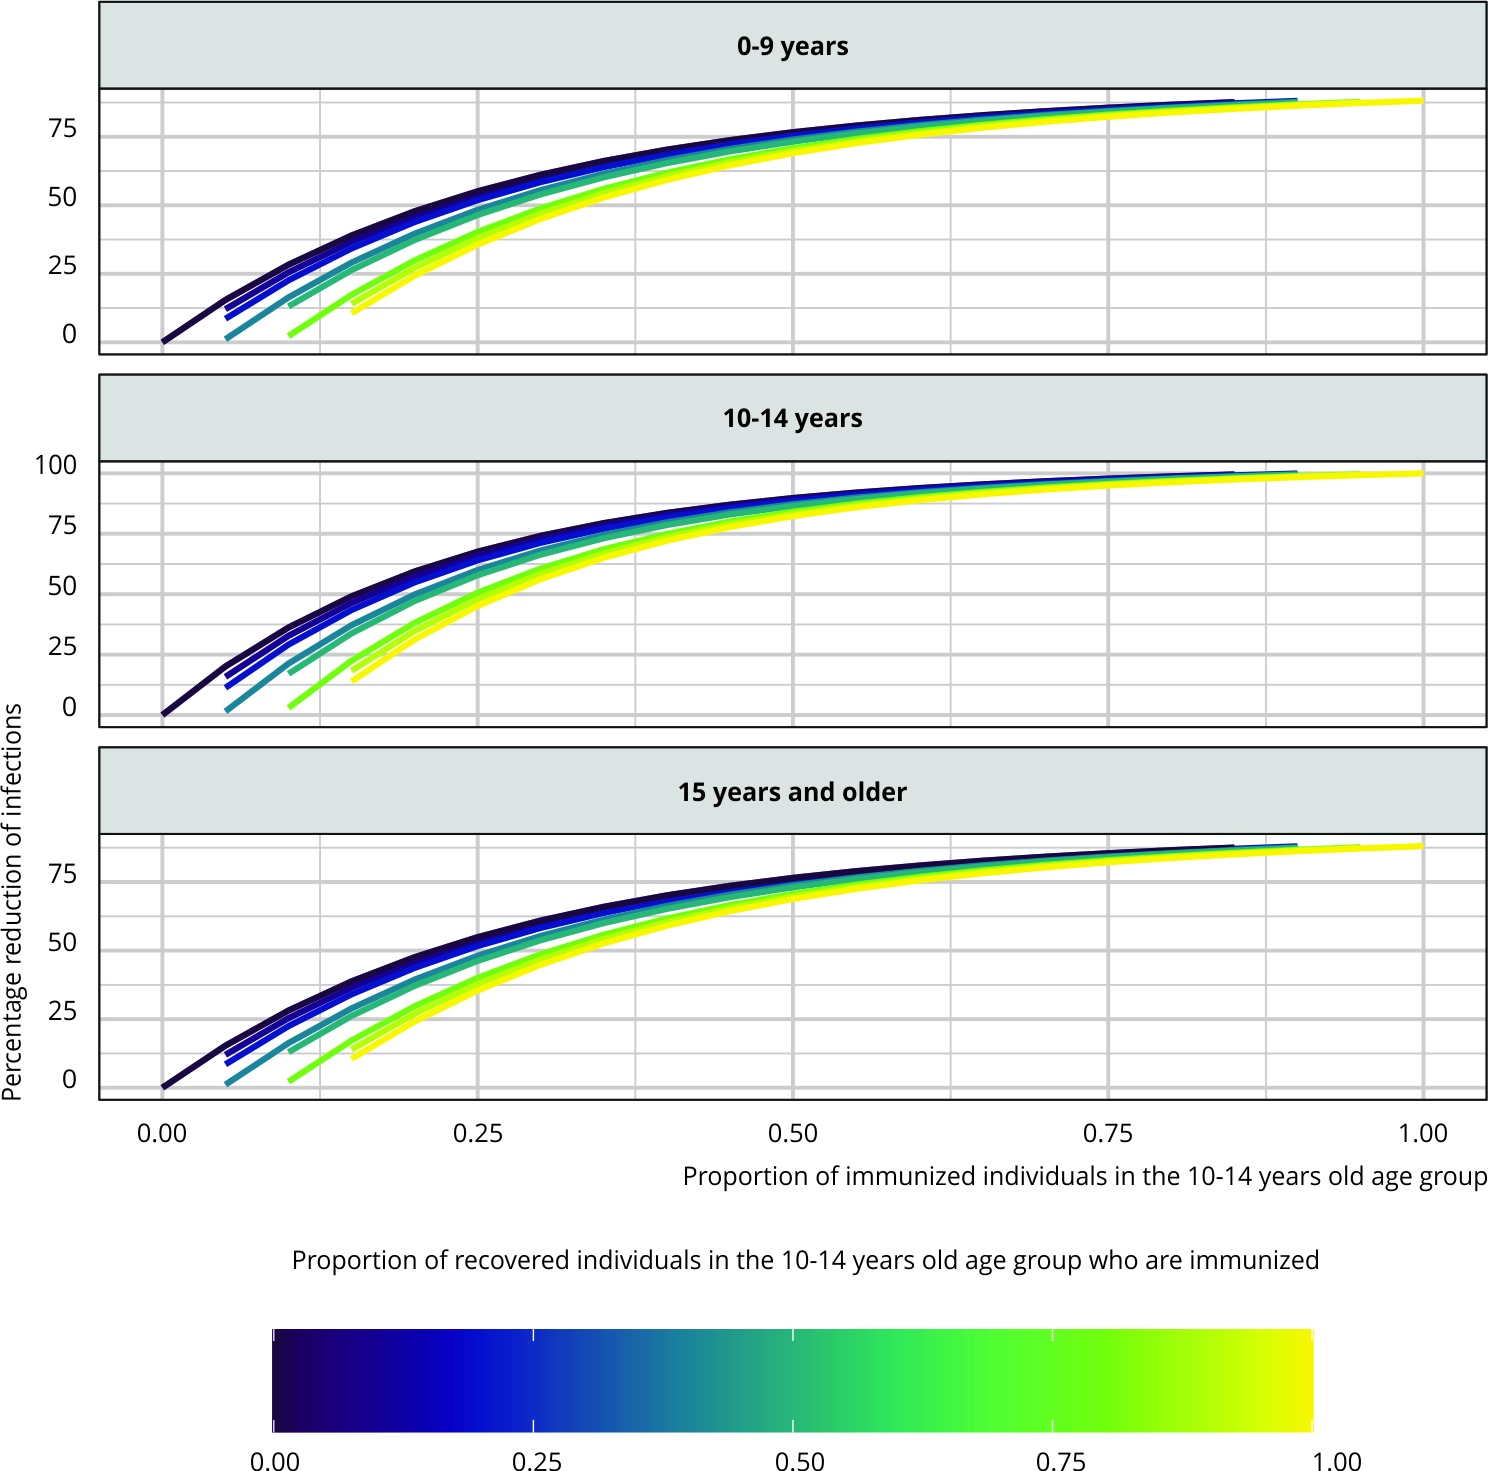 Note: parameters are the same as in
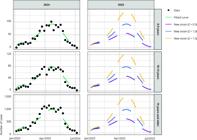
 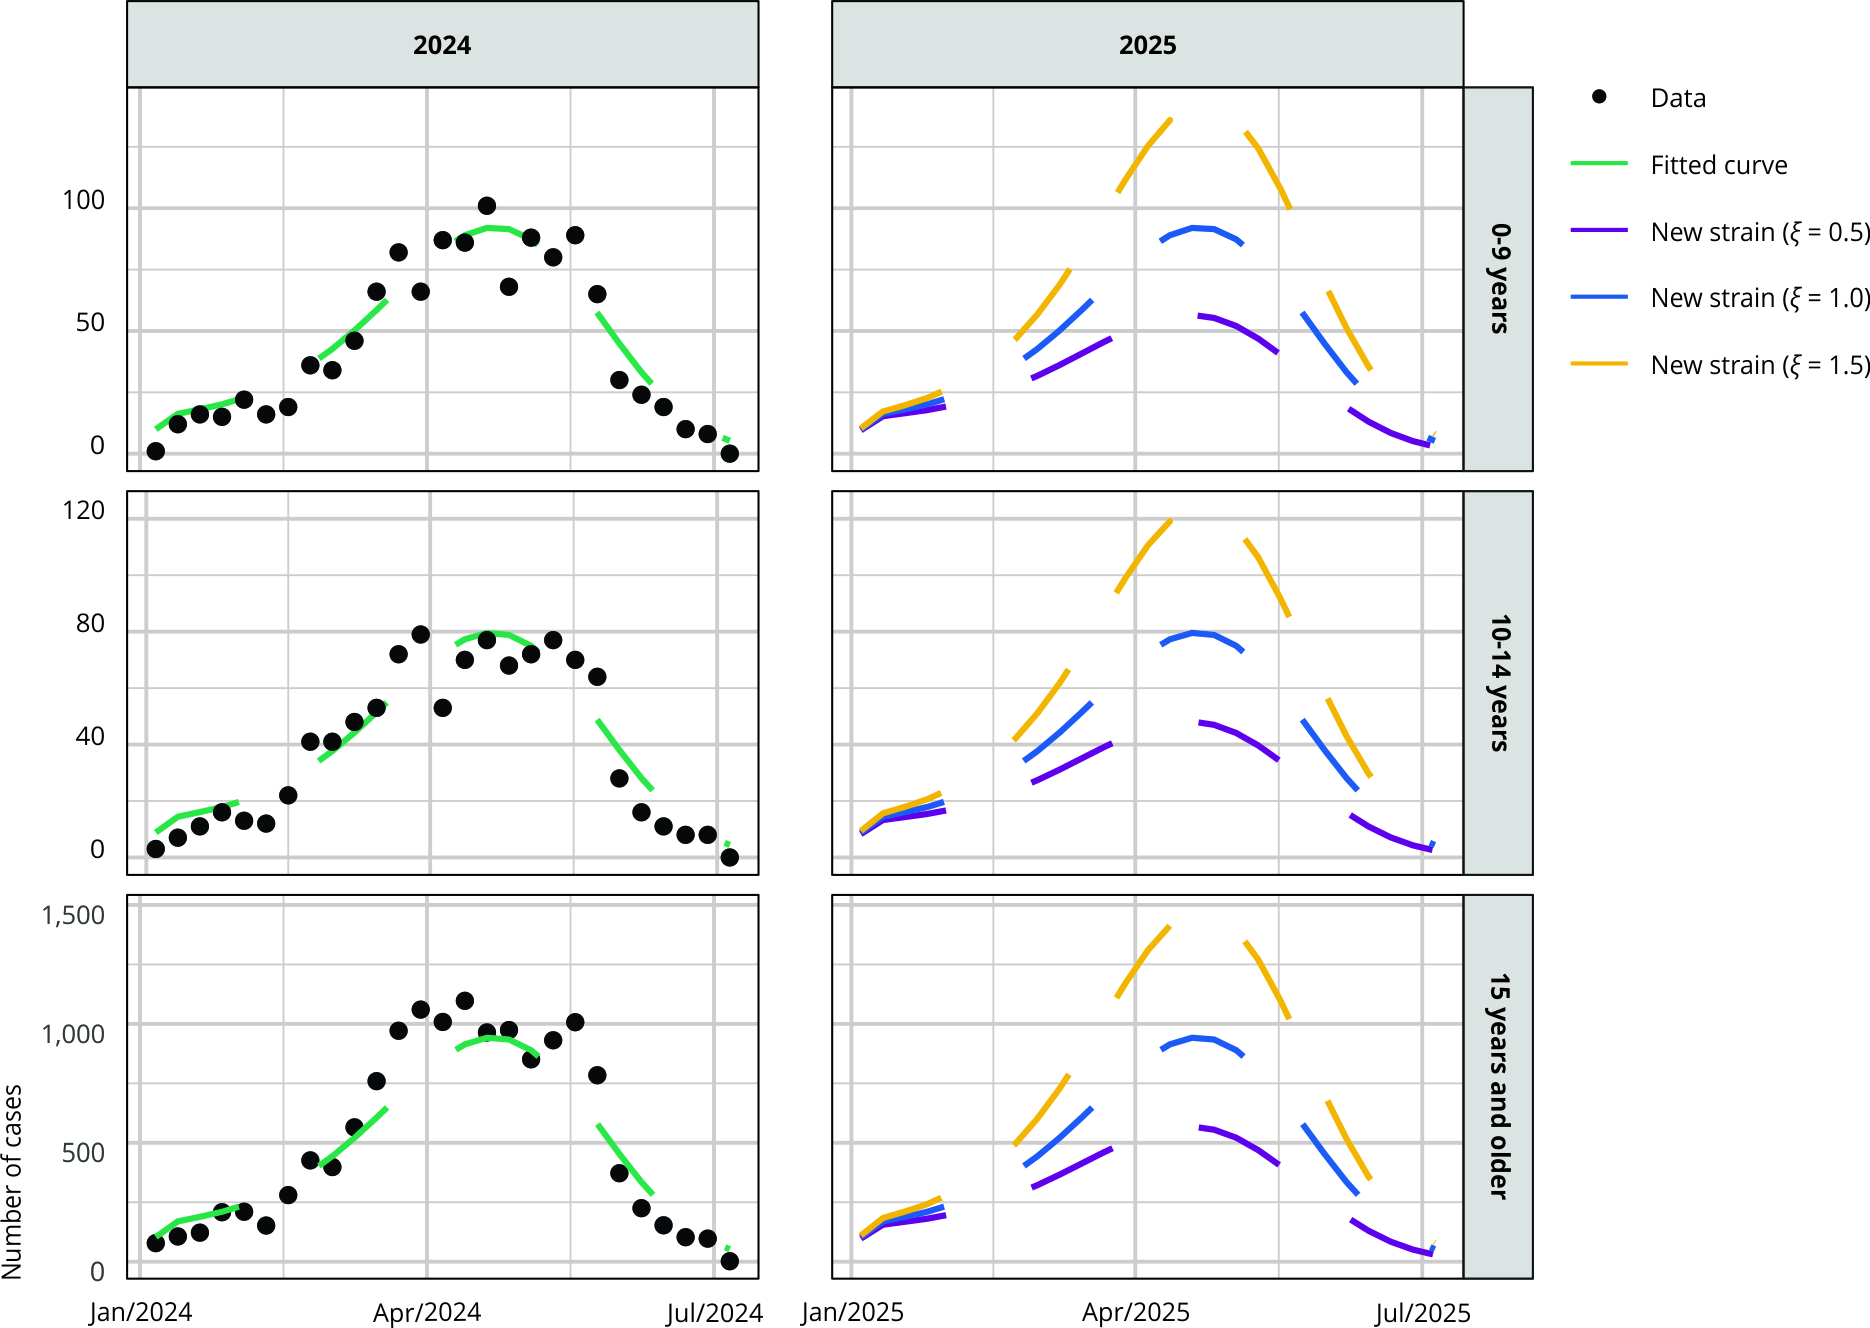 Note: parameters are ba = [11.5, 19.4, 17.1] week-1, for each age group; bh = 0.054; bv = 0.0102; d = 0.48, µm = 1/3 week-1, γ = 1.0 week-1, η = 1.4 week-1 and ϵ = 1/26 week-1. The initial conditions for infected compartments are 𝐼 2,𝑎 0 = [24, 43, 35] individuals in each age group, respectively. Reported data from 2024 are also shown, and the panels correspond to the three age groups.
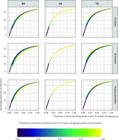
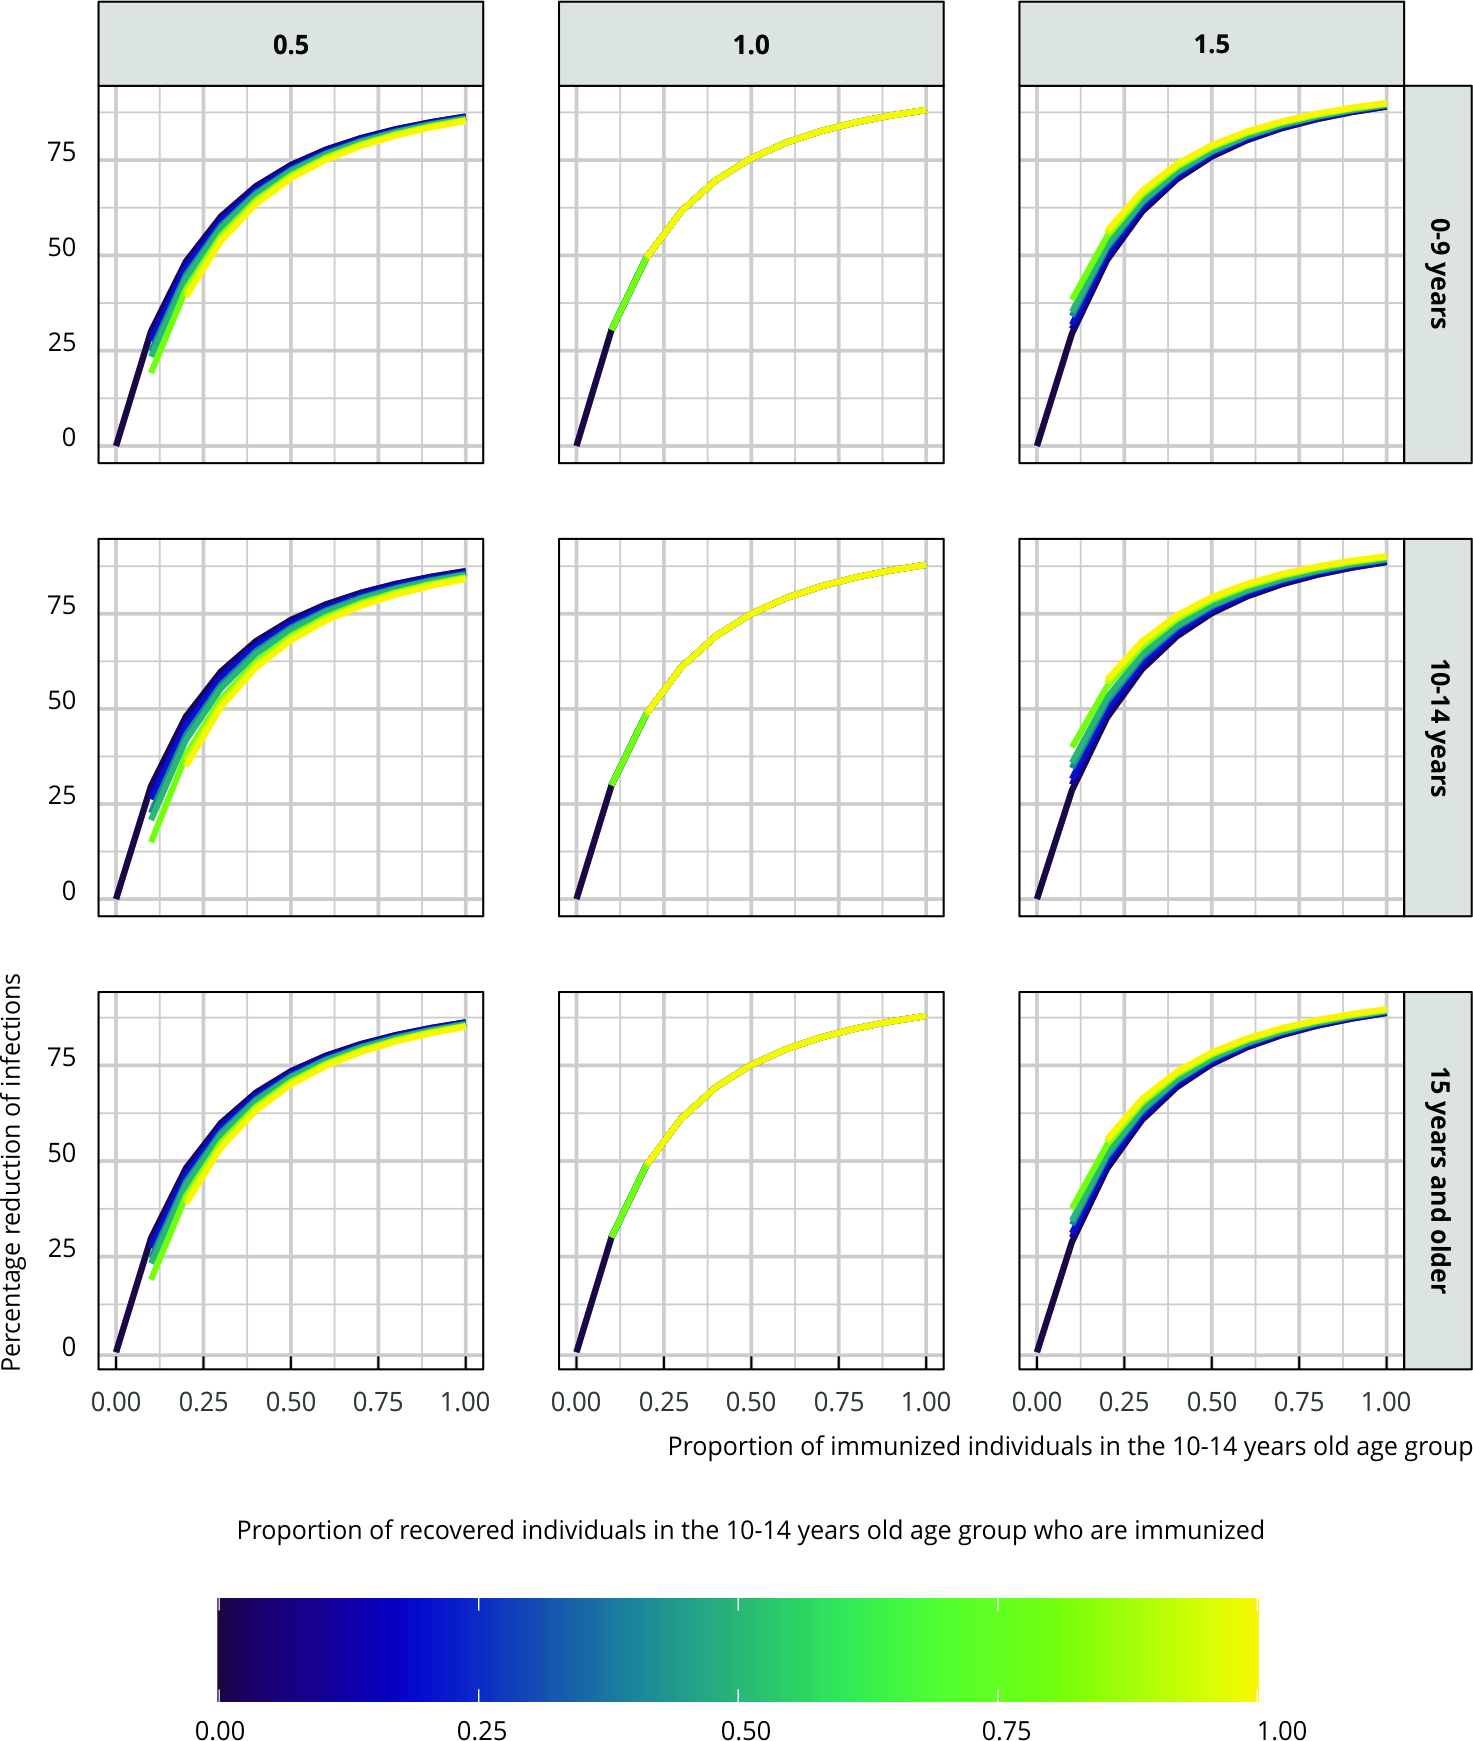 Note: parameters are the same as in