
 Relationship between salt and blood pressure in indigenous and non-indigenous populations
Abstract
Objective: to compare the effect of salt consumption on blood pressure (BP) of an indigenous and of a non-indigenous population in Brazil.
Design: the studies were carried out in the years of 1999-2004 in an urban population of Vitória (n = 1,663), the capital of Espírito Santo State, and in an indigenous population settled in a reserve of Aracruz (n = 663). Salt consumption was evaluated by a 12-hour overnight urine collect.
Results: salt consumption (mean ± sd) was very high (12.8 ± 5.7 g/day vs 11.8 ± 5.9 g/day; P < 0.001), respectively, in indigenous and non-indigenous population. Systolic and diastolic BP was lower in the indigenous population (118/75 mmHg). In multivariate analysis the contribution of fat accumulation evaluated by body mass index (BMI) was the main component contributing to elevate blood pressure in indigenous. The slope of the systolic BP in the indigenous in the multivariate analysis, salt intake, age and BMI explained 27% of systolic BP and 21% of the diastolic BP in the indigenous group, while these variables explained 17% and 15% in the non-indigenous population.
Conclusion: blood pressure itself did not show a statistically significant change with salt intake alone, highlighting BMI as a key factor in to explain the BP variability in indigenous population.
Key words:
Salt; Urine; Blood pressure; Indigenous population; Urban
Resumo
Objetivo: comparar os efeitos do consumo de sal na pressão arterial (PA) de uma população indígena e não indígena no Brasil.
Metodologia: os estudos foram realizados entre os anos de 1999-2004 em uma população urbana de Vitória (n = 1.663), capital do estado do Espírito Santo, e população indígena assentada na reserva indígena de Aracruz (n = 663). O consumo de sal foi avaliado por meio de coleta de urina noturna de 12 horas.
Resultados: a média ± dp do consumo de sal foi muito alta (12,8 ± 5,7 g/dia vs. 11,8 ± 5,9 g/dia; P < 0,001), respectivamente, na população indígena e não indígena. A PA sistólica e diastólica foi menor na população indígena (118/75 mmHg). Na análise multivariada a contribuição do acúmulo de gordura avaliada pelo índice de massa corporal (IMC) foi o principal componente que contribuiu para a elevação da pressão arterial em indígenas. A inclinação da PA sistólica nos indígenas na análise multivariada, consumo de sal, idade e IMC explicaram 27% da PA sistólica e 21% da PA diastólica no grupo indígena, enquanto essas variáveis explicaram 17% e 15% no grupo não indígena.
Conclusão: a pressão arterial em si não apresentou alteração estatisticamente significativa apenas com a ingestão de sal, destacando o IMC como fator chave para explicar a variabilidade da PA na população indígena.
Palavras-chave:
Sal; Urina; Pressão arterial; População indígena; População urbana
Resumen
Objetivo: comparar los efectos del consumo de sal sobre la presión arterial (PA) en una población indígena y no indígena en Brasil.
Metodología: Los estudios se realizaron entre 1999 y 2004 en una población urbana de Vitória (n = 1.663), capital del estado de Espírito Santo, y en una población indígena asentada en la Reserva Indígena de Aracruz (n = 663). El consumo de sal se evaluó mediante la recolección de orina nocturna de 12 horas.
Resultados: la media ± DE del consumo de sal fue muy alta (12,8 ± 5,7 g/día frente a 11,8 ± 5,9 g/día; P < 0,001), respectivamente, en las poblaciones indígena y no indígena. La PA sistólica y diastólica fueron más bajas en la población indígena (118/75 mmHg). En el análisis multivariado, la contribución de la acumulación de grasa, evaluada mediante el índice de masa corporal (IMC), fue el principal factor que contribuyó a la elevación de la presión arterial en la población indígena. La pendiente de la presión arterial sistólica en la población indígena en el análisis multivariado, la ingesta de sal, la edad y el IMC explicaron el 27% de la presión arterial sistólica y el 21% de la presión arterial diastólica en el grupo indígena, mientras que estas variables explicaron el 17% y el 15% en el grupo no indígena.
Conclusión: la presión arterial en sí no mostró un cambio estadísticamente significativo con la ingesta de sal únicamente, lo que destaca al IMC como un factor clave para explicar la variabilidad de la presión arterial en la población indígena.
Palabras clave:
Sal; Orina; Presión arterial; Población indígena; Población urbana
Introduction
The indigenous populations living in their original way of life, did not add salt the cooking process. Therefore, daily salt intake was very low in these populations (usually < 0.5 g/day of sodium)1. This fact was showed in the INTERSALT Study, which was the largest study conducted by the end of the last century aiming to investigate the relationship between salt consumption and blood pressure in different populations1,2.
From the 52 populations of the five continents included in the analysis, four still lived in their primitive conditions without use of addition salt, and in these four populations, the age-dependent blood pressure increase was very low so that the prevalence of hypertension, if any, was very low2. The nutrition transition of these primitive populations has been very fast in Brazil as well as in other countries3, with the introduction of diet habits, such as salt addition, use of processed and ultra-processed foods and alcohol abuse, etc., thus facilitating the development of several chronic non-communicable diseases (NCDs), such as high blood pressure, obesity, and diabetes which give an important contribution for the morbidity and mortality.
Cardiovascular diseases are the leading cause of mortality around the world and arterial hypertension (AH) is the most important risk factor for cardiovascular deaths4. The development of high blood pressure depends of a large number of non-modifiable (genetic traits, sex and age) and modifiable factors including lifestyle-related risk factors such as smoking, excessive consumption of alcoholic beverages, and high sodium intake5.
Salt consumption is high all over the world, including the indigenous populations that adopted nutrition habits similar to those occurring in the general population6. The INTERSALT study showed also that in the populations with high sodium intake (> 5 g/day) there is a linear relationship between the mean salt intake of each population, the mean values of BP and the prevalence of hypertension2.
The World Health Organization (WHO) suggests a daily intake of sodium of 2 g, equivalent to 5 g of table salt1. The great majorities of the studies carried out in indigenous and non-indigenous populations have shown a mean salt intake well above the actual WHO recommendation, especially in Brazil where salty foods are quite appreciated. In a representative sample of the adult Brazilian population included in a National Health Survey (2013), the estimated salt consumption was around 9.34 g/day and less than 5% showed a consumption less than 5 g/day7. In this study, salt consumption was estimated based on the sodium/creatinine rate in a spot urine sample.
Study carried out with a representative sample of the population of Vitória, a 12.6 g/day consumption was measured8, while in an indigenous group established in the reserve of Aracruz, the mean consumption reached 13.7 ± 7.1 g/day (2003).6 In both these studies salt consumption was calculated based on a 12-hour overnight urine collect used same analysis method to check salt consumption. The Native Brazilian populations did not use salt in the cooking process and the prevalence of AH was almost absent9.
Over the years, the westernization of the eating habits of these populations may contribute to a progressive increase of BP levels and AH development. BP is complex variable because it depends on factors and studies relating the contribution of these factors to BP levels in populations with different ancestry are very scarce. Our aim in this study was to compare of influence of salt intake and obesity of BP of two population, one living in an indigenous reserve that has adopted a western diet for the last decades and an urban population living in the city of Vitoria.
Blood pressure and anthropometric variables were measured with the same techniques and by the same research group. Importantly, salt consumption was evaluated by the same method previously validated8 based on a 12-hour overnight urine collect. The study showed that BP of the indigenous seems to be less sensitive to a high salt diet as compared to non-indigenous. Conversely, in the first group, BP levels are more sensitive to fat accumulation.
Material and methods
Populations and samples
Data were collected in two cross-sectional studies. The first, in a representative sample of the urban population (25-64 years old) of Vitória, the capital of Espírito Santo State and the second in adults (> 20 years old) of an indigenous population living in a reserve in Aracruz, north coast of the same state. In Vitória, the data were collected in a representative sample of households (N = 1,663; 1999-2001), selected by a random sample of domiciles8.
In the indigenous reserve all subjects (>20 years) were invited and from the eligible population (N = 834), 663 (79.5%) attended to the project for data collection (2003-2004)6. Both studies were designed to investigate the prevalence and severity of cardiovascular risk factors and were approved by the national and institutional ethics committees UFES (Decision 3123/02) and by the Human Research Ethics Committee (CONEP) (Decision 4559) and all participants signed a written informed consent. In the indigenous population this procedure was carried out with the help of local health personal.
All data were collected following international rules in according with the Declaration of Helsinki. Research protocols were similar in both studies and participants were invited to attend to the University Hospital (urban population of Vitória) or to the Health Unit of the indigenous reserve in a pre-scheduled day. Socio-demographic characteristics (sex, age, schooling, self-reported race/ethnicity) and habits (smoking and alcohol intake) were collected by questionnaires during the visit. Blood sample was collected in fasting condition. All other data were obtained by specific exams during the same visit. All participants were asked to avoid strenuous physical exercise and to not drink alcohol in the 24 h previous to exams.
Anthropometry
Body weight (kg), and height (cm) were collected while the participants were fasting, barefoot and in light clothes, by using an electronic scale (precision of 0.1 kg) and a wall mounted stadiometer (precision of 0.5 cm). Weight classification was based on body mass index (BMI), calculated as the ratio between weight (Kg) to the squared height (m). Subjects were classified as eutrophic (BMI < 25kg/m2), overweight (BMI ≥ 25.0 - 29.9 kg/m2) or obese (BMI ≥ 30kg/m2 10.
Blood pressure
Resting systolic and diastolic BP (SBP, DBP) was measured in the left arm in sitting position after a rest period of 5 min. Three readings with 5-10 min intervals were obtained in each subject by using an oscillometric automatic device (Onrom 705CP, Japan). Clinic BP was determined as the mean of the last two measurements. Subjects were classified as hypertensive if blood pressure was ≥140/90 mmHg or in use of anti-hipertensive drugs, including diuretics11.
Salt consumption
Participants in both studies received previous instructions for an overnight 12-h urine collection in the evening of the clinic visit. Individuals were asked to void as nearly as possible of 7:00 pm in the night before exams. From this moment they were orientated to collect all urine in a plastic bottle (2 liters volume) and to proceed the last collect around 7:00 am next day. The exact time of the last urine void and last collect in the bottle should be annotated in a form in order to calculate the exact interval of urine collect. In the indigenous community the urine collect was guided by trained health professionals attending local health facilities.
When arriving at the local of exams (University Hospital in Vitória or the local health facility in the indigenous reserve) the bottle was delivered to a research assistant to determine the period of urine collect and to measure urine volume in a graduated cylinder with 10 mL precision. A sample (5 mL) was separated and sent to a central laboratory to sodium and potassium dosage. Urinary flow (mL/min) was measured by dividing total urinary volume by the period of urinary collect. Urine collect was considered valid if the volume was ≥ 250 mL and with no report of urine lost12. The daily sodium intake was estimated from the 12-h urinary sodium excretion according to a validation study of our group showing that nearly 47% of the 24-h sodium excretion is found in the 12-h overnight urine sample13. Salt consumption (g/day) was calculated considering that all urinary sodium comes from NaCl ingestion.
Statistical analysis
Continuous variables are given as means and standard deviations and categorical variables as absolute frequencies and percentages. The goodness-to-fit to a Gaussian distribution was verified by the Kolmogorov-Smirnov test. Differences between groups were assessed using the students t test for independent samples. The chi-square test was applied for categorical variables. The association between BP and urinary sodium excretion (Ur-Na) was performed using Pearson’s coefficient, and a multivariate linear regression model was used to test the dependence of BP on the estimated salt intake, and after adding to the model, in this order, age, and BMI. All statistical analyses were performed using SPSS 22.0 Statistical Package (SPSS, Chicago, IL). Statistical significance was set at P < 0.05.
Results
From the indigenous population (N = 663) we removed for this analysis 33 who did not collected 12-h urine, 17 with 12-h urine < 250 mL, 18 with implausible salt consumption (≥ 30g/day), and 15 without data of blood pressure, serum creatinine, or body weight. Others 54 were removed because they were in use of anti-hypertensive drugs, remaining 526 participants in the analysis (see supplementary material, available at: https://doi.org/10.48331/SCIELODATA.JCPZL0). From the 1,663 non-indigenous participants recruited in the Vitória, we removed from the analysis 10 without urine collect, 45 with 12-h urine volume < 250 mL, 50 with implausible salt consumption (≥ 30g/day) and others 25 without data of blood pressure, creatinine or body weight. Others 254 were removed because they were in use of anti-hipertensive drugs, remaining 1,279 participants in the analysis (see supplementary material, available at: https://doi.org/10.48331/SCIELODATA.JCPZL0). Below presents the results of the indigenous and non-indigenous population. The socio-demographic characteristics of the two samples are shown in Table 1.
The sex distribution was similar in both groups and the indigenous group showed lower schooling levels and excessive fat accumulation (overweight and obesity was less prevalent: (44.7% vs 51.9; p < 0.05). Regular smoking was similar in the two groups. Hypertension, however, was less frequent in the indigenous population (12.7% vs 30.8%; p < 0.01).
Table 2 shows anthropometric, clinical and biochemical characteristics of the groups. The indigenous group was around seven years younger (35.5 vs 43.4 years; p < 0.001) than the urban one. BMI was slightly lower in indigenous (25.0 vs 25.7 kg/m2; p = 0.009), while blood pressure (118/75 vs 124/82 mmHg; p < 0.001), cholesterol (164.6 vs 211.7 mg/dL; p < 0.001), triglycerides (106.7 vs 129. 7 mg/dL; p < 0.001), glycemia (89.3 vs 102.0 mg/dL (p < 0.001), creatinine (0.7 vs 0.9 mg/dL; p < 0.001) and uric acid (4.2 vs 4.7 mg/dL; p < 0.001) also showed lower values in indigenous as compared to the non-indigenous (p < 0.001). High density lipoprotein (HDL-c) however, showed an opposite picture being higher in indigenous (49.2 vs 44.3 mg/dL; p < 0.001).
The general characteristics of the 12-h urine are shown in Table 3. The indigenous group produced a urine with smaller volume (around 14% less) but with higher sodium concentration (154 vs 128 mmol/L; p < 0.001). The urinary creatinine concentration was similar in both groups (99.1 vs 102.2 mg/dL; p = 0.321) so that the sodium to creatinine ratio was also higher in indigenous (0.20 vs 0.15 mmol/mg; p < 0.001). The sodium to potassium ratio was higher in indigenous group (6.7 vs 4.9 mmol/mmol) and much above the actual recommendations (~1) in the two groups. The calculated 12-h sodium excretion as well as the estimated salt consumption were both higher in the indigenous group as compared the non-indigenous one (12.8 ± 5.7 vs 11.8 ± 5.9 g/day; p < 0.01).
The relationship between systolic and diastolic BP as a function of salt consumption in the models is shown in Table 4. The linear correlation between salt intake and BP increment (mmHg/g) was lower and non-significant in the indigenous (r = 0.075) and higher an significant in non-indigenous (r = 0.14; P < 0.01). In multivariate analysis the contribution of fat accumulation evaluated by body mass index (BMI) was the main component contributing to elevate blood pressure in indigenous. The slope of the systolic BP in the indigenous in the multivariate analysis, salt intake, age and BMI explained 27% of systolic BP and 21% of the diastolic BP in the indigenous group (model 3), while these variables explained 17% and 15% in the non-indigenous population.
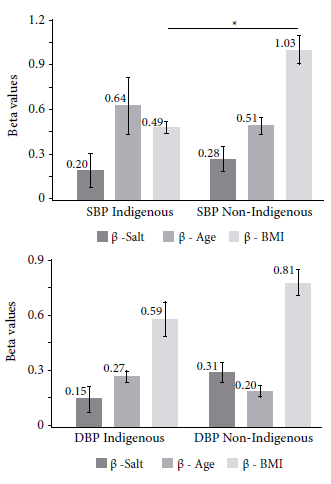
Figure 1 presents the slopes of the comparison curves between the indigenous and non-indigenous population for model 3. It was observed that the modulation in systolic blood pressure and specifically BMI were twice as high in systolic blood pressure in the indigenous people compared to the non-indigenous group indigenous (p = 0.01). The BMI beta values for indigenous people are as follows: (0.49 vs 1.03; P = 0.01). The same was observed for diastolic BP (0.59 vs 0.81; p = 0.1), although not statistically significant.
Adjusted beta values for pressure and salt in model 3. Indigenous and non-indigenous population, 1999-2004.
Discussion
In this study, we observed that salt consumption was quite high in almost all subjects were this variable was investigated, independent of the group, that is, either the non-indigenous urban population of Vitória as in the indigenous population living in an indigenous reserved. It is important to emphasize that sodium intake was evaluated by a validated method involving a 12-h overnight urine collect. The other variables (BP, blood biochemical analysis, anthropometry, etc.) were collected by using the same procedures.
Also, regression was performed only in individuals not in use of anti-hypertensive drugs to avoid the influence of the treatment on BP. We observed a tendency towards a linear relationship between the estimated value of salt consumption and SBP when evaluated according to the crude model and after including in the analysis age (because the indigenous group was younger) and BMI was lower.
The significant values found were due to the influence of salt intake on blood pressure, largely modulated by BMI, on systolic blood pressure (p < 0.01). An accurate assessment of sodium intake is not easy when tested in large number subjects. The gold standard method is the 24-h urine collect13. However, there are serious inconveniences of this procedure when used in the general population because subjects are generally outside their homes along the day.
Therefore, our group developed several studies to validate the overnight 12-h urine collect to estimate salt consumption and our studies to validate the 12-h overnight urine collect as an alternative method to estimate salt intake14. In one of these studies14 the overnight 12-h urine Na comprised 47% of the 24-h urine, a value that was confirmed in a larger study in the general population of Vitória8. Several criteria were used to consider a timed urine collect as ‘valid’, causing a loss of about 10% participants in the two populations showed in this study, a value lower that it was usual when other methods to evaluate salt consumption, such as spot urine and 24h recall are used15,16.
To investigate the relationship between salt consumption and blood pressure we also removed from the analysis all subjects in use of antihipertensive drugs, including diuretics, because these drugs would be an important confounder to determinate the association between these two variables. More important, we used the same methods to collect and process the urine and blood pressure data. Therefore, data of these two populations can be compared without important bias interfering in the results.
We observed that in both populations the salt consumption is high and quite above the WHO recommendations of 5 g/day17. Similar results have been obtained in other studies in Brazil as well in populations of other countries. In a previous analysis of the data of this same study, Meyerfreund et al.6 (2009), related that the salt intake was similar in the three different groups living in the same reserve of Aracruz (Guarani, Tupinikin and non-indigenous: (11.7 ± 5.3 g/day; 13.7 ± 7.2 g/day and 14.2 ± 7.2 g/day; P > 0.05, respectively. Studies carried out through the National Health Survey (PNS-2013) using a spot urine sample found average salt values of 9.34 g/day, being higher in men (9.6 vs 9.5 g/day; p < 0.05)7. Furthermore, no statistical differences were found according to age groups and education level7.
Also in Vitória, the assessed salt consumption was 10.4g/day with 24-hour collection13. National reports according to data from the Household Budget Survey (POF 2008-2009) revealed high levels of daily salt intake equivalent to 12g/day17.The relationship between salt intake and blood pressure is well established in the literature18,19. However, to date this is the first study to compare the impact of sodium intake with blood pressure in two populations with a high and similar pattern of salt intake but with different ancestry. We discuss here some possible causes for the interference in nutritional status in the pressure of the indigenous and urban population, observed in these groups.
The first point to be considered for interference in nutritional status and effects of salt intake and blood pressure is insulin resistance in obese individuals. Individuals who have a high body mass index tend to have illnesses related to diseases such as cardiovascular complications associated with quality of life5. Therefore, there is a relationship between obesity and insulin resistance, which are linked by pathophysiological mechanisms which include low-grade chronic inflammation and association with free fatty acids interfering with insulin signaling20-22. Furthermore, mitochondrial dysfunction can also contribute to insulin resistance, through increased hepatic glucose production20-22. Increased salt consumption, in turn, tends to worsen these conditions, as it is linked to hypertension8. All of these effects lead to greater accumulation of visceral fat, worsening of systemic inflammation and insulin resistance in obese individuals5.
Another aspect to be considered is the effect of overweight/obesity on blood pressure. Recent population studies23,24 have demonstrated the relationship between high salt intake in adults, obesity and blood pressure. High body mass index has been strongly associated with increased salt intake and hypertension. Individuals with a high BMI tend to eat more salt23, which leads to greater sodium and water retention in the body. This sodium retention, in turn, increases blood volume, increasing blood pressure. Furthermore, individuals with a higher BMI have greater activation of the sympathetic nervous system, which activates the release of catecholamines, such as noradrenaline, increasing blood pressure values20-22.
This high sympathetic activity in individuals with high BMI causes vasoconstriction of the arteries, increasing peripheral vascular resistance which is associated with excessive salt intake, causing an effect on the arteries, making the smooth muscle more reactive to nervous stimuli, generating pressure reactivity20-22. Studies23,24 observe the combined effects of high BMI and high salt intake and cardiovascular events, such as stroke.
The response of high BMI to blood pressure is also related to the behavior of sodium receptors in the kidneys and genetic variations and sensitivity to salt25. Individuals with a high BMI tend to be more sensitive to salt, which means that even small amounts of sodium can substantially increase blood pressure26. Although this effect was not directly observed in our study. Therefore, weight management strategies and reduction in salt consumption are necessary to manage hypertension and associated risk factors.
Our study has some limitations. First, sodium intake was not determined with the gold standard 24-hour urinary collect. However, in a previous study14 the 12-h overnight urine collect was validated to replace the more difficult 24-h collect. The estimated salt intake when using these two urines collect methods is quite similar in studies of our group. Second, sodium intake may be slightly undervalued because we removed from the databank the hypertensive patients in use of antihypertensive drugs and previous studies have shown that hypertensive individuals show a higher salt intake8,23,25. Finally, data were recorded at different times (1999-2001 in Vitoria and 2003-2004 in the indigenous population). However, dietary habits remain essentially unchanged in this small period of time and other factors influencing BP were not taken into consideration in this analysis.
Conclusion
The results demonstrate a high salt consumption in both populations (urban and racially mixed and the indigenous), with values above the maximum allowable recommendation being found. No significant relationship was found between salt consumption and blood pressure when used alone, but statistical significance occurred after adding to the model age and BMI. Low influence of salt was observed in the indigenous. In this group, the predominant factor influencing either systolic and diastolic blood pressure is fat accumulation. We can suppose that the blood pressure of the indigenous people is more independent of salt intake because they are more efficient to eliminate sodium in the urine. The fact that we observed a higher sodium/creatinine ratio in the urine of indigenous reinforces this view.
Acknowledgments
We thank, first of all, all study participants who were willing to perform the 12-hour urine collection and voluntarily participate in the research. This study was funded by a scholarship from the Coordenação de Aperfeiçoamento de Pessoal de Nível Superior (CAPES) with the aid of a research grant from Universidade Federal do Espírito Santo (UFES).
References
- 1 World Health Organization (WHO). Salt Smart Americas: A Guide for Country Level Action. Geneva: WHO; 2013.
- 2 Intersalt Cooperative Research Group. Intersalt: an international study of electrolyte excretion and blood. BMJ 1988; 297:319.
- 3 Popkin BM. The Nutrition Transition in the Developing World. Dev Policy Rev 2003; 21(5-6):581-597.
- 4 Malta DC, Gonçalves RPF, Machado IE, Freitas MIF, Azeredo C, Szwarcwald CL. Prevalence of arterial hypertension according to different diagnostic criteria, National Health Survey. Rev Bras Epidemiol 2018; 21(Supl. 1):e180021.
- 5 Van Oort S, Beulens JWJ, van Ballegooijen AJ, Grobbee DE, Larsson SC. Association of cardiovascular risk factors and lifestyle behaviors with hypertension: a mendelian randomization study. Hypertension 2020; 76(6):1971-1979.
- 6 Meyerfreund D, Gonçalves CP, Cunha RS, Pereira AC, Krieger JE, Mill JG. Age-dependent increase in blood pressure in two different native American communities in Brazil. J Hypertension 2009; 27(9):1753-1760.
- 7 Mill JG, Malta DC, Machado IE, Pate A, Pereira CA, Jaime PC, Szwarcwald CL, Rosenfeld LG. Estimation of salt intake in the Brazilian population: Results from the 2013 national health survey. Rev Bras Epidemiol 2019; 22(Supl. 2):E190009.SUPL.2.
- 8 Molina MCB, Cunha RDS, Herkenhoff LF, Mill JG. Hypertension and salt intake in an urban population. Rev Saude Publica 2003; 37(6):743-750
- 9 Carvalho JJM, Baruzzi RG, Howard PF, Poulter N, Alpers MP, Franco LJ, Marcopito LF, Spooner VJ, Dyer AR, Elliott P, Stamler J, Stamler R. Blood pressure in four remote populations in the INTERSALT study. Hypertension 1989; 14(3):238-246.
- 10 World Heatth Organization (WHO). Obesity: preventing and managing the global epidemic. Geneva: WHO; 2000
- 11 Sociedade Brasileira de Cardiologia, Sociedade Brasileira de Hipertensão, Sociedade Brasileira de Nefrologia. VII Diretrizes Brasileiras de Hipertensão. Arq Bras Cardiol 2016; 107(Supl. 3):1-104.
- 12 Ljungman S, Granerus G. The evaluation of kidney function in hypertensive patients. In: Larah JH, Brenner BM, editors. Hypertension: pathophysiology, diagnosis, and management. New York: Raven Press; 1995.
- 13 Rodrigues SL, Souza Júnior PR, Pimentel EB, Baldo MP, Malta DC, Mill JG, Szwarcwald CL. Relationship between salt consumption measured by 24-h urine collection and blood pressure in the adult population of Vitória (Brazil). Braz J Med Biol Res 2015; 48(8):728-735.
- 14 Silva ABT, Molina MCB, Rodrigues SL, Pimentel EB, Baldo MP, Mill JG. Correlação entre a depuração plasmática de creatinina utilizando urina coletada durante 24 horas e 12 horas. J Bras Nefrol 2010; 32(2):165-172.
- 15 Bhattarai S, Bista B, Yadav BK, Gynawali P, Poudyal A, Jha AK, Dhimal M. Estimation of mean population salt intakes using spot urine samples and associations with body mass index, hypertension, raised blood sugar and hypercholesterolemia: Findings from STEPS Survey 2019, Nepal. PLoS One 2022; 17(4):e0266662.
- 16 Pereira TSS, Benseñor IJM, Meléndez JGV, Faria CP, Cade, NV, Mill JG, Molina MDCB. Consumo de sódio e potássio estimado por dois métodos no Estudo Longitudinal de Saúde do Adulto (ELSA-Brasil). Sao Paulo Med J 2015; 133(6):510-516.
- 17 Instituto Brasileiro de Geografia e Estatística (IBGE). Pesquisa de Orçamentos Familiares 2008-2009 [Internet]. 2011 [acessado 2024 out 13]. Disponível em: https://www.ibge.gov.br/estatisticas/sociais/populacao/9050-pesquisa-de-orcamentos-familiares.html?edicao=9051&t=publicacoes"https://www.ibge.gov.br/estatisticas/sociais/populacao/9050-pesquisa-de-orcamentos-familiares.html?edicao=9
- 18 Mente A, O'Donnell MJ, Rangarajan S, McQueen MJ, Poirier P, Wielgosz A, Morrison H, Li W, Wang X, Di C, Mony P, Devanath A, Rosengren A, Oguz A, Zatonska K, Yusufali AH, Lopez-Jaramillo P, Avezum A, Ismail N, Lanas F, Puoane T, Diaz R, Kelishadi R, Iqbal R, Yusuf R, Chifamba J, Khatib R, Teo K, Yusuf S. Association of Urinary Sodium and Potassium Excretion with Blood Pressure. New England J Med 2014; 371(7):601-611.
- 19 Du X, Fang L, Xu J, Chen X, Bai Y, and Zhong J. Association between 24-h urinary sodium and potassium excretion and blood pressure among Chinese adults aged 18-69 years. Sci Rep 2021; 11(1):3474.
- 20 Steppan CM, Lazar MA. Resistin and obesity-associated insulin resistance. Trends Endocrinol Metab 13(1):18-23.
- 21 Chandraseakaran P, Weiskirchen R. The role of obesity in type 2 diabetes mellitus - an overview. Int J Mol Sci 2024; 25(3):1882.
- 22 Skrgat S, Harlander M, Janic M. Obesity and insulin resistance in asthma pathogenesis and clinical outcomes. Biomedicines 2024; 12(1):173.
- 23 Malta DC, Bernal RTI, Andrade SSCA, Silva MMA, Velasquez-Melendez G. Prevalência e fatores associados com hipertensão arterial autorreferida em adultos brasileiros. Rev Saude Publica 2017; 51(Supl .1):11s.
- 24 Malta DC, Andrade SSCA, Oliveira TP, Moura L, Prado RR, Souza MFM. Probability of premature death for chronic non-communicable diseases, Brazil and Regions, projections to 2025. Rev Bras Epidemiol 2019; 22:e190030.
- 25 Sun H, Zhou Y, Jiang S, Zhao D, Li H, Y Lu, Ma B, Zhou B. Association between low-sodium salt intervention and long-term blood pressure changes is modified by ENaC genetic variation: a gene-diet interaction analysis in a randomized controlled trial. Food Funct 2023; 14(21):9782-9791.
- 26 Curtis D. Genetic variants associated with hypertension risk: progress and implications. Pulse 2024; 12(1):19-26.

 Source: Authors.