 Show-jumping horses: field jumping test and speed test on high-speed treadmill
ABSTRACT:
This study evaluated athletic performance of jumping horses with jumping and incremental speed tests. Eighteen horses were submitted to a competition whose results were used to separate them into best, medium and lowest performance groups. The horses were submitted to two tests: an incremental jumping test with four steps and jumps over 1.10 m height vertical obstacle totaling 70 jumps, and to a speed incremental test with six steps and increasing speed of 2, 4, 5, 6, 7 and 8 m/s. Immediately after each test and on 10 minutes and 30 minutes of rest blood samples were collected to determine blood lactate, hematocrit, total blood plasmatic protein and blood glucose. Blood samples were collected prior and immediately after tests for hemogasometry. Another blood sample was collected prior and after tests for determination of CK, AST LDH and uric acid concentration. On speed incremental test, blood samples were collected to determine lactate concentration and asses VL2 and VL4, velocities for 2 and 4 mmol/l lactate concentration respectively. Results were submitted to ANOVA and compared by Tukey Test 5%. There was no difference between tests (P < 0.05) on AST and CK concentrations. The lactate and uric acid concentrations immediately after tests were higher in speed than in incremental jumping test. On the hemogasometry, observed difference between tests and between blood samples collect moments for pH, pCO2, sodium plasmatic concentration and potassium plasmatic concentration (P<0.05). The pH was lower after speed test than after jumping test (P < 0.05). The pCO2, sodium and potassium concentrations increased after speed incremental test than after jumping test (P < 0.05). The pO2 was not significantly different between tests P > 0.05). There was no difference among groups on VL2 (mean value 5,3 m/s) and VL4 (mean value 7,4 m/s) values (P > 0.05). The jumping and speed incremental tests are useful for asses exercise intensity for jumping horses, so it is possible to assess jumping horse’s performance through speed incremental test. The physiological, hematological and biochemical variables showed changes in their measurements compatible with the level of demand of the exercises performed in the tests, proving to be useful in evaluating the fitness of athletic horses.
Key words:
equine; lactate; performance
RESUMO:
Este estudo foi realizado para avaliar o desempenho atlético de cavalos de salto com testes incrementais de salto e velocidade. Dezoito cavalos foram submetidos a uma competição cujos resultados foram utilizados para separá-los em grupos de melhor, médio e pior desempenho. Os cavalos foram submetidos a dois tipos de testes: um teste incremental de saltos com quatro fases e saltos sobre obstáculos verticais de 1,10 m de altura totalizando 70 saltos e, um teste incremental de velocidade com seis fases e velocidade crescente de 2, 4, 5, 6, 7 e 8 m/s. Imediatamente após cada teste e, em 10 minutos e 30 minutos de após o teste foram coletadas amostras de sangue para determinação de lactato sanguíneo, hematócrito, proteína plasmática total e glicemia. Amostras de sangue foram coletadas antes e imediatamente após os testes para avaliação da hemogasometria. Outra amostra de sangue foi coletada antes e após os testes para determinação de CK, AST LDH e concentração de ácido úrico. No teste incremental de velocidade, amostras de sangue foram coletadas para determinar a concentração de lactato e estimar a VL2 e VL4, velocidades para concentração de lactato de 2 e 4 mmol/l, respectivamente. Os resultados foram submetidos à ANOVA e comparados pelo teste de Tukey 5%. Não houve diferença entre os testes (P < 0,05) nas concentrações de AST e CK. As concentrações de lactato e ácido úrico imediatamente após os testes foram maiores no teste de velocidade do que no teste de salto incremental. Na hemogasometria, observou-se diferença entre os testes e entre os momentos de coleta de amostras de sangue para pH, pCO2, concentração plasmática de sódio e concentração plasmática de potássio (P < 0,05). O pH foi menor após o teste de velocidade do que após o teste de salto (P < 0,05). As concentrações de pCO2, sódio e potássio aumentaram após o teste de velocidade do que após o teste de salto (P < 0,05). A pO2 não difere entre os testes (P > 0,05). Não houve diferença entre os grupos nos valores de VL2 (valor médio 5,3 m/s) e VL4 (valor médio 7,4 m/s) (P > 0,05). Os testes incrementais de salto e velocidade são úteis para avaliar a intensidade do exercício para cavalos de salto, portanto é possível avaliar o desempenho do cavalo de salto através do teste incremental de velocidade. As variáveis fisiológicas, hematológicas e bioquímicas utilizadas apresentaram alterações em suas mensurações compatíveis com o nível de exigência dos exercícios realizados nos testes, demonstrando ser de grande utilidade na avaliação do condicionamento físico de equinos.
Palavras-chave:
desempenho; equinos; lactato.
INTRODUCTION
The combination of speed, strength, explosiveness, endurance and jumping technique are indispensable characteristics for horses that compete at a jumping high level. Knowledge of the demands to which jumping horses are subjected during competition is critical to develop effective training program, as well as to monitor adaptation to applied training. The performance of jumping horses is much more difficult to assess than horses in speed or endurance sports (DE MARÉ et al., 2017; KIRSCH et al., 2022).
Exercise tests on equine athletes can be performed on treadmills or in the field, with advantages and disadvantages for both. Tests carried out in the field simulate speeds, gaits, surfaces and environments similar to those of competition of the various modalities, mainly preserving the biomechanics of the modalities (EVANS, 2007). The tests were carried out to evaluate sports training, involving several physiological variables related to the animal’s level of physical fitness, as well as allowing investigations of exercise-induced disorders in horses that have low performance or intolerance to exercise (ALLEN et al., 2016). The tests can provide the clinician with information about the respiratory, cardiovascular, metabolic, muscular and locomotor parameters of the horse during exertion, providing a global assessment of its physical capacity (VAN ERCK, 2022). Incremental exercise testing can provide an initial insight into a horse’s ability to perform, where each step of the test undergoes an increment in speed and the horse is evaluated at each of these steps (DE MARÉ et al., 2017).
The exercise performance capacity of athletic horses is currently assessed through a series of measurements of specific physiological parameters. The study of these physiological variables in controlled tests is an important tool for determining the performance potential of athlete horses (COUROUCÉ et al., 2000; DAUVILLIER, 2022). This study evaluated jumping horses in the incremental jumping and incremental speed tests with hematological variables, serum biochemistry and blood gas analysis.
MATERIALS AND METHODS
Animals and experimental design.
Eighteen Brazilian Sport Horses were evaluated, adults and athletes of jumping, 12 males and 6 females, with an average age of 12.5 years, average body weight of 520 kg, in full sports activity and participating in competitions in the Amateur category, with obstacles at the height of 1.20 m, according to the Brazilian equestrian jumping regulations (CBH, 2023). The experimental design was in randomized blocks with two treatments (tests) and three blocks. The treatments were physical exertion tests, with Test 1 - incremental jumping test; and Test 2 - incremental speed test. The blocks were separated according to classification in a previous jumping competition, as follows: Block 1: horses with the best performance; Block 2: horses with medium performance; and Block 3: horses with lowest performance. The horses were housed in individual stalls and fed with a diet consisting of coastcross hay (Cynodondactylon) and alfalfa (Medicago Sativa) and commercial concentrate in a roughage:concentrate ratio of 60:40, on a dry matter basis. Water and mineral salt were available, at will, during the experimental period. The concentrate was supplied to the horses five hours before the physical activity.
Pre-trial test
The horses were previously evaluated in a jumping competition. In this competition, the animals followed the protocol: warm-up in three minutes at the pace, three minutes at the trot, two minutes at the gallop, followed by the execution of six jumps for two minutes, two jumps in a vertical obstacle of 0.90 m, two jumps in a vertical obstacle of 1.10 m and two jumps in parallel of 1.20 m, in sequence, totaling 10 minutes. In the competition, the horses performed a course with 11 obstacles and 13 efforts. The course was 496 meters long, with a speed of 350 m/min (approximately 6 m/s). The penalty count was based on the number of fouls committed in accordance with the CBH jumping regulations (CBH, 2023), with first place being the horse with the lowest and last place the horse with the highest number of points lost. After qualifying in the competition, the horses were separated into three groups with six animals each: Group 1 composed of the best performing horses (Jump course time = 83.6 ± 4.5 seconds; Lost points = 2.5 ± 1.8); Group 2 composed of medium-performing horses (Jump course time = 83.0 ± 4.5 seconds; Lost points = 7.0 ± 1.5); and Group 3 composed of the lowest performing horses (Jump course time = 85.6 ± 2.1 seconds; Lost points = 10 ± 2.0) (RODRIGUES et al., 2025) .
Performance tests
The horse-rider sets were subjected to two types of tests, an incremental jumping test and an incremental speed test. The stress tests were carried out in two stages, in a rotational system. In the first stage, nine sets participated in the jumping test and the other nine sets participated in the speed test. The second stage took place seven days later when the groups that had participated in the jump test participated in the speed test and vice versa. The tests were conducted on sand tracks during the jumping season, in between official equestrian competitions.
_Incremental jumping test (IJT): It was conducted in four phases (steps) covering pre-defined distances, with sequential jumps over verticals at a height of 1.10 m, arranged on the diagonals of the arena, with an interval between them of 11 m of distance, totaling 10 verticals in a course of 210 meters. Each horse was ridden by its respective rider, minimizing the effects caused by the differences in the aids, according to the jumping competition. The horses followed the Pre-trial test protocol. Then, the horses performed the IJT following the protocol: First phase - the horses performed a circuit with 10 jumps in the verticals; Second phase - the horses performed a circuit with 15 jumps in the verticals; Third phase - the horses performed a circuit with 20 jumps in the verticals; Fourth phase - the horses performed a circuit with 25 jumps in the verticals. The interval between each phase was determined by the heart rate, that is, in the intervals between the phases, the release of the horses for the next phase of the test occurred when the heart rate was reduced to 90 beats per minute.
_Incremental speed test (IST): The test was conducted in eight phases, in which the horses performed an elliptical path in the various gaits. The horses followed the protocol of the Pre-trial test, but without jumping execution. The IST occurred according to the protocol: First phase - the horses completed a 120-meter course at a speed of 2.0 m/s; Second phase - the horses performed a 240-meter trot at a speed of 4.0 m/s; Third phase - the horses ran a 300-meter gallop course at a speed of 5.0m/s; Fourth phase - the horses ran a 360-meter gallop course at a speed of 6m/s; Fifth phase - the horses ran a 420-meter gallop course at a speed of 7 m/s; Sixth phase - the horses ran a 480-meter gallop course at a speed of 8 m/s. During the tests, the horses used heart rate monitors (Polar®) with GPS to analyze variations in heart rate and speed. In the jumping tests, VL2 and VL4 were estimated in a similar way to the incremental speed tests, considering the number of jumps required for the plasma lactate concentration to reach 2 mmol/L, expressed as SL2, and 4 mmol/L, expressed as SL4. The estimates of SL2 or SL4 were based on the equation Y=0.6+Lmax*(1-Exp(k*s)) where Y = SL2 or SL4; L = lactate concentration; k = constant and s = number of hops.
Blood analysis
To control horse’s health, blood samples were collected from the horses in the week prior to the pre-trial test. Blood samples from horses on the day before the competition were used to determine the values of the blood count and biochemical variables of the animals at rest. Blood samples were collected at the moments before the tests, after each phase of the jumping and speed tests, immediately after the last phase of each test, and at 10 minutes, 30 minutes, 3 hours, 6 hours, 24 hours, and 36 hours after the tests. Blood count, hematocrit, total plasma protein, lactate, glucose, uric acid, creatine kinase (CK), aspartate aminotransferase (AST), and lactate dehydrogenase (LDH) were evaluated. Blood gas analysis was performed with the animals at rest before the pre-trial test and after the tests. Blood samples were collected in vacuum tubes with EDTA (Vacutainer BD®) for hematological analyses. For the biochemical analyses, the following were performed: 1) blood collection in a vacuum tube without anticoagulant (Vacutainer BD®) for the analysis of CK, AST LDH, total protein; 2) blood collection in a vacuum tube with sodium fluoride (Vacutainer BD®) for lactate, glucose and uric acid analyses.
Statistical analysis
The results were analyzed by the Lilliefors test to verify normality, and by the Cochran and Bartlett test to verify the homogeneity of variance. The results of the variables obtained in the jumping test and in the speed test were analyzed in a split-plot scheme and compared by Tukey’s test, at 5% probability. The results of the variables when there were only effects of the tests were compared by the F-test, at 5% probability. The analyses were carried out with the SAEG program - System of Statistical and Genetic Analysis.
RESULTS
In the incremental jumping test, the horses in the best performance group had the lowest number of faults, five faults, while the horses in the medium and lowest performance groups had 45 and 38 faults, respectively. It was observed that the highest number of faults occurred in the fourth phase of the test in all groups, including the group of horses with the best performance. The best-performing horses committed only three faults in the last phase, while the medium-performing horses committed 23 faults and the lowest-performing horses committed 22 faults. Regarding the test execution time, the best performing horses performed the test in less time (58.8 seconds) than the medium (59.9 seconds) and lowest performance (63.1 seconds) horses, respectively. However, considering the total time to perform the jumping test, including the recovery time required for the horses to be released for the next phase, the horses with the best performance performed the test in a longer time (79.1 minutes) than the horses in the medium (78.1 minutes) and lowest (63.1 minutes) performance groups, demonstrating that the horses with the best performance needed more time for recovery between the phases of the test (Table 1). Horses with better sports performance are animals that have better jumping techniques or that show greater effort to perform athletic activity, which can contribute to a higher degree of excitement of these animals after activity.
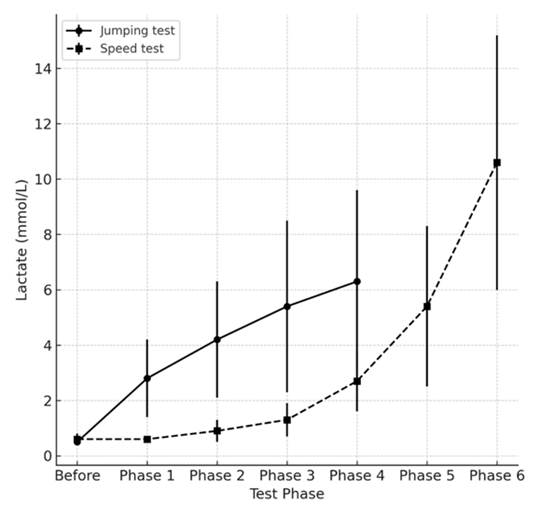
There was a difference in plasma concentrations of lactate, hematocrit, total plasma protein, and glucose between the phases of the jumping test (P < 0.05), but there was no difference in these same concentrations between the performance groups (P > 0.05) (Table 2). Plasma lactate concentrations increased with the increase in the number of jumps, reaching mean values of 6.3 ± 3.3 mmol/L in the fourth phase of the test, compared to values of 0.5 ± 0.1 mmol/L before the test was performed. Plasma hematocrit and total plasma protein concentrations also increased with increasing number of jumps. The hematocrit values went from 35.7 ± 4.0% before the test to 53.6 ± 3.2% in the last phase. Plasma protein went from 6.4 ± 0.6 g/dL before the test to 7.3 ± 0.7 g/dL in the fourth phase of the test. Soon after the beginning of the exercises, the serum glucose concentration decreased, from 105.8 ± 17.4 mg/dL before the test to 76.2 ± 14.8 mg/dL after the first phase of the test. However, as the jumping test progressed, the glucose concentration gradually increased, reaching values of 96.3 ± 20.3 mg/dL in the last phase of the test.
There was a difference in the values of plasma lactate concentration, hematocrit, total plasma protein, and glucose (P < 0.05) between the phases of the incremental speed test (Table 3). Plasma concentrations of lactate, hematocrit and plasma protein increased with increasing speed in each phase of the test. Lactate concentrations increased from 0.6 ± 0.2 mmol/L before the test to 10.6 ± 4.6 mmol/L in the last phase of the test. Hematocrit increased on average from 37 ± 4.6% before the test to 51 ± 3.1% in the last phase, while total plasma protein increased from 6.4 ± 0.4 g/dL before the test to 7.2 ± 0.4 g/dL in the sixth phase of the test. Soon after the beginning of the exercises, the serum glucose concentration, as in the jumping test, decreased, from 105.8 ± 17.4 mg/dL before the test to 84.9 ± 11.5 mg/dL after the first phase of the test. However, as the speed test progressed, the glucose concentration gradually increased, reaching values of 100.3 ± 10.5 mg/dL in the last phase of the test.
There was no difference between SL2 and SL4 values between the performance groups (P > 0.05) (Table 4). The horses in the best performance group showed SL2 and SL4 mean values of 8.3 ± 4.5 and 19.4 ± 7.4 jumps, respectively. The medium performance group had SL2 and SL4 mean values of 8.2 ± 6.0 and 13.0 ± 6.1 jumps and the lowest performing group had SL2 and SL4 mean values of 13.8 ± 10.2 and 34.3 ± 32.6 jumps, respectively. There was no significant difference between the mean values of Vl2 and Vl4 between the performance groups in the incremental speed test (P > 0.05) (Table 4). This is probably because the horses, despite being classified into different performance groups, had the same level of training.
No difference in heart rate was observed between the moments of the jumping test. Despite the accumulation of 70 jumps at the end of the jumping test, no change in the heart rate of the horses was observed during the test, regardless of the performance group, which presented mean heart rates of 144, 150, 150 and 160 in phases 1, 2, 3 and 4, respectively. There was a difference in heart rate (P < 0.05) between the phases of the incremental speed test (Table 5), with a marked increase in the fifth and sixth phases of the test, from 78 ± 17.46 bpm in phase 1 to 164 ± 21.94 and 179 ± 23.57 bpm in phases 5 and 6, respectively, related to the increase in gallop speed.
The plasma lactate concentration was different between the test types, being higher immediately after the incremental speed test (10.6 ± 4.6 mmol/l) compared to the incremental jumping test (6.3 ± 3.3 mmol/l), as well as at all time points after the tests (P < 0.05). There was also a difference between the test moments (P < 0.05), with the lactate concentration being higher immediately after the tests when compared to the moments 10 and 30 minutes after the tests (Table 6).
The hematocrit, total plasma protein, and blood glucose values were different after the tests (P < 0.05), with hematocrit and total protein concentrations higher immediately after the tests, while glucose was lower (Table 7).
The plasma concentration of uric acid decreased after the tests (Table 8), and the mean of this reduction was greater in the incremental jumping test, with values of 1.24 ± 0.86 mg/dl (P < 0.05). Uric acid showed a greater reduction at 30 minutes after the tests, with values of 0.68 ± 0.20 mg/dl, compared to baseline values of 2.41 ± 0.05 mg/dl.
There was no difference (P > 0.05) in plasma CK and AST concentrations before and after the jumping and incremental speed tests (Table 9). There was a difference (P < 0.05) in plasma LDH concentration before and after the jumping and incremental speed tests (P < 0.05). LDH values remained elevated up to 36 hours after the tests, with values of 652.4 ± 273.60 U/L, compared to baseline values of 478.1 ± 136.43 U/L (Table 10).
Mean values of creatine kinase (CK) and aspartate aminotransferase (AST) enzyme concentration before and after the jumping and incremental speed tests.
The mean blood gas values obtained immediately after the jumping and speed tests revealed differences between the tests and between the moments before and after the tests in relation to pH, pCO2 and plasma concentrations of Na, K and Ca (P < 0.05) (Table 11). The pO2 did not present a significant difference in relation to the time and type of test performed (Table 12). The pH decreased after the incremental speed test (7.3 ± 0.05) in relation to the jumping test (7.4 ± 0.04) and at the moment before the tests (7.4 ± 0.02). The pCO2 was higher after the incremental speed test (58.4 ± 6.87 mmHg/l) in relation to the jumping test (50.3 ± 3.05 mmHg/l) and at the moment before the tests (48.3 ± 3.02 mmHg/l). The Na concentration and K concentration were higher immediately after the incremental speed test (141.3 ± 1.78 and 5.4 ± 0.32 mEq/l, respectively) in relation to the incremental jumping test (140.0 ± 1.24 and 5.1 ± 0.20 mEq/l, respectively) and at the time before the tests (136.7 ± 1.78 and 4.0 ± 0.40 mEq/l, respectively). However, the plasma calcium concentration was lower (P < 0.05) immediately after both tests (1.6 ± 0.06 mmol/l), and did not differ between them.
DISCUSSION
The highest number of faults was observed in the last phase of the jumping test, regardless of the group and classification to which the horse belonged. Previous studies have reported that the inability to maintain jump height during exercise execution can be considered as a sign of fatigue onset (BURGER et al., 2024). However, none of the horses in the present study showed clinical or laboratory signs of post-exercise fatigue at any time after tests or post-competition.
Blood lactate accumulates according to the increase and continuity of physical exercise in jumping horses, demonstrating dependence on anaerobic metabolism (AGUILERA-TEJERO et al., 2000; BAZZANO et al., 2016; KIRSCH et al., 2022). The plasma lactate concentration increased as the number of jumps or speed increased, demonstrating that this variable increased depending on the intensity of the effort (SOARES et al., 2016; KIRSCH et al., 2022), regardless of whether the effort is limited to speed or jumping over obstacles, demonstrating the ability of the jumping test to produce satisfactory results for performance evaluation. In the incremental jumping test, it should be considered that the horse performs a test closer to the reality of the athletic modality of show jumping.
In most high-intensity sports where energy expenditure is maximal (aerobic and anaerobic pathways), lactate release (and likely its production) continues after exercise cessation, peaking at 10-15 minutes post-exercise. However, the lactate recovery curve varies depending on the type of horse (fiber composition), exercise intensity, and recovery modality (OLDRUITENBORGH-OOSTERBAAN et al., 2006). In jumping horses undergoing active recovery, peak lactate levels were observed immediately after exercise, with recovery occurring within 10 minutes post-exercise.
Immediately after exercise, as expected, lactate concentration was at its maximum concentration, gradually decreasing, as observed in the results obtained at 10 and 30 minutes of rest. The incremental speed test resulted in a greater accumulation in blood lactate concentration in relation to the jumping test, presenting higher metabolic requirements. The dynamics of lactate in relation to speed have also been observed by other authors, suggesting that, regardless of race and type of exercise, the increase in blood lactate concentration is directly related to the increase in speed (GOTTLIEB-VEDI & LINDHOLM, 1997; SCHUBACK & ESSÉN-GUSTAVSSON, 1998; DAVIE & EVANS, 2000; PICCIONE et al., 2010; SABEV, 2011; BAZZANO et al., 2016; KIRSCH et al., 2022). Based on these results, it can be inferred that the jumping test is a useful method to evaluate the athletic performance of jumping horses, in which we observe the changes in the animal’s metabolism associated with show jumping, mimicking the effort and behavior of the athletic modality of horse jumping.
The mean value of lactate concentration observed in jumping competitions, at a speed of 8 m/s, was compatible with the value observed in the present study (Figure 1). It is observed that the physical exercise of horses during a jumping course is not able to raise lactate concentration, however, depending on the level of effort required in a test, this point of dependence between the aerobic and anaerobic pathways can be reached and can be used to assess the physical fitness of horses, as previously discussed (LÉGUILLETTE et al., 2020; KIRSCH et al., 2022).

There was no difference in the estimates of the number of jumps (JL2 and JL4) in the best, medium or lowest performing horses. However, although there was no difference between the performance groups, the values found for JL2 and JL4 demonstrate that the jump test was able to determine a metabolic demand for the anaerobic pathway that could be observed in the test results, exceeding the JL2 and JL4 thresholds of 2 mmol/L and 4 mmol/L, respectively. Thus, the equation presented in the present work to determine the values of the JL2 and JL4 variables allows it to be used from now on to better measure the behavior of the lactate variable in the evaluation of equine athletes in the jumping modality. Although the speed test demonstrated greater demand for anaerobic metabolism, as previously discussed, the fact that the animals presented similar training characteristics and were in full sports activity, participating in competitions and training without complications in the last months prior to the study, allows us to infer that the training factor was more significant in lactacidemia, regardless of the equestrian athletic modality that the animal plays (BITSCHNAU et al., 2010; DE MARÉ et al., 2022).
The heart rate was not altered with the exercises of the jumping test, showing only significant changes in the speed test. There was also no correlation between heart rate and jumping in competition, demonstrating that there was no increase in this variable with the number of jumps, but with the timing of the jump and with the speed during the warm-up (BAZZANO et al., 2016; KIRSCH et al., 2022). For other authors, there was a significant increase in heart rate in the jumping test, but the main factors that may have contributed to this significant increase in heart rate are possibly related not only to the number of jumps accumulated at the end of the test, but also to the distance between obstacles during the test, which could have been related to the number of jumps accumulated at the end of the test. Depending on this distance, required greater effort from the horse to perform the jumps (SOARES et al., 2016).
Observed in several studies on variations in blood concentrations after exercise, there is a significant increase in hematocrit (KRUMRYCH, 2010) and plasma protein (HARGREAVES et al., 1999; KUPCZYŃSKI et al., 2018). This increase can be physiologically explained by the occurrence of splenic contraction, which releases a greater amount of red blood cells into the bloodstream for greater oxygen supply, necessary for the continuity of exercise. When comparing the jumping test with the speed test, the present study did not identify a significant difference in the results found for hematocrit. Other studies revealed a difference in the results, but compared the speed test with the jumping competition, demonstrating that the speed test, as well as the jumping test, has a greater demand on this variable (LÉGUILLETTE et al., 2020).
Serum glucose concentration at the beginning of the tests decreased and gradually increased over the following phases, as observed in other studies (FERRAZ et al., 2008; FAZIO et al., 2014; SANTOS et al., 2015). Animals that exercise at a higher speed and time show more significant increases in blood glucose concentration than horses subjected to exercise of lower speed and duration (BARREY & VALETTE, 1993). This is an important fact, since the exercise of show jumping requires less speed and exercise time than other equestrian modalities, such as running and complete equestrianism. Despite this, there was no significant difference in glucose concentrations when comparing the constant speed jumping test with the speed increment test, probably because the glycogen reserves in all horses were sufficient to increase glucose production, providing the necessary energy supply for the continuity of both tests (FAZIO et al., 2014). Unlike other studies, there was no increase in uric acid concentration in the present study (KĘDZIERSKI, 2014). Despite the greater number of jumps to which the animals were submitted, the intensity of the effort was lower compared to other studies (SCHUBACK & ESSÉN-GUSTAVSSON, 1998; SOARES et al., 2011).
The effects of physical exertion in exercise on enzyme activity depend not only on the level of athletic ability of the animals, but also on the duration and intensity of the exercise performed. Although other studies have revealed an increase in the concentrations of CK and AST enzymes after exercise (SOARES et al., 2011; FAZIO et al., 2014; SANTOS et al., 2015; GUNDASHEVA, 2016; ASSENZA et al., 2016; FAZIO et al., 2023) no changes in the concentrations of these enzymes were observed in the present study. LDH concentrations increased as a result of the demand for physical exertion (SOARES et al., 2011; SANTOS et al., 2015), results opposite to those observed by other authors (FAZIO et al., 2014; FAZIO et al., 2023). The measurement of the values of these enzymes was performed immediately after the execution of exercises in most of the referenced studies, while in the present study the measurement was performed after three hours of rest. Physical conditioning can influence enzyme elevation (FAZIO et al., 2014) and its concentrations decrease progressively as the animal adapts to training (RUDOLPH et al., 1993). Furthermore, the point that these horses did not change in CK/AST supports that there was no muscle damage. So, despite the great number of faults of some horses, that could support the absence of visible fatigue.
The reduction in pH observed in the present study may be associated with an increase in blood lactate concentration and contribute to the demonstration of the development of metabolic acidosis that occurs in horses subjected to strenuous exercise (AGUILERA-TEJERO et al., 2000). There was a more pronounced reduction after the speed test, demonstrating greater metabolic demand, when compared to the same moment in the jumping test. When comparing the jumping test with the incremental speed test, we observed that the latter presented significantly lower values for pH (SOARES et al., 2016; LÉGUILLETTE et al., 2020). Although, the intensity of the effort was sufficient to cause changes in lactacidemia and in JL2 and JL4, the metabolism of the horses was able to prevent acid-base imbalance during the jumping test, which did not occur in the speed test, in which the same variables showed greater anaerobic demand.
Regarding pCO2, the present study observed a significant increase in the values of this variable after the speed test compared to the same time of the jumping test, opposite results observed in the literature (SOARES et al., 2016; LÉGUILLETTE et al., 2020). The differences observed may be related to a shorter interval between obstacles in the jumping test, which forced the animals to perform jumps without a gallop interval and, therefore, with greater metabolic demand. In addition, the greater number of phases in the speed test may have led to greater demand and delay in metabolic compensation. Even so, the present study was able to produce hypercapnia, demonstrating once again the usefulness of the jumping test with distances and heights close to the reality of the athletic activity performed by horses. Observing the lactacidemia of horses in the present study, an increase in lactate concentration can be observed after exercise. It is to be expected that the increase in lactate will be accompanied by the increase in H+ ions that would represent metabolic acidosis after high-intensity exercise. The fact that we did not observe a reduction in the pH of the present study at the end of the jumping test, in addition to the increase in pCO2, which remained elevated immediately after the jumping test, and the speed test, when respiratory compensation with a reduction in pCO2 would be expected, which demonstrates a tendency towards metabolic alkalosis when these data are associated with increases in Na and K concentrations (AGUILERA-TEJERO et al., 2000), may arise from the moment of collection of blood samples, and there is not enough time for compensatory metabolism to act. Different values were found in other equestrian modalities (WALLER & LINDINGER, 2005) with a reduction in pCO2.
The changes in electrolyte balance found, such as an increase in Na and K concentrations (FAZIO et al., 2014; SANTOS et al., 2015; SOARES et al., 2016) and reduction in Ca concentration may be related to increased Na concentration due to loss of plasma fluid through sweat, while K increases due to exchanges between intra- and extracellular fluid (AGUILERA-TEJERO et al., 2000). The difference in the results obtained by other authors may be related to the fact that animals with different quantity and quality of training from those used in other sports were used in the present study. Another factor to be considered is that the intensity and quantity of the exercises performed in the tests of the present study can be considered more intense and greater, to the point that no compensations were observed at the times evaluated, compared to the other studies. It is possible that with the end of the tests and rest, these animals went through the moment of metabolic compensation later and this was not observed, because none of the animals participating in the tests of the present study presented any clinical, physiological or metabolic alteration.
CONCLUSION
The physiological, hematological and biochemical variables used showed alterations in their measurements compatible with the level of demand of the exercises performed in the tests, proving to be very useful in the evaluation of the physical fitness of horses. Heart rate in the jumping test has not been shown to be effective in determining performance.
The use of jumping test and incremental speed test allowed us to conclude that they are useful to determine physical fitness. The comparison between the steps allowed the standardization of the tests with repeatability, objectivity and validity, presenting significant differences in the values of the main markers of the physiological dynamics of exercise. Certain hematological variables and test results enable discrimination between high- and low-performance animals in jumping trials. However, exercise tests primarily aim to reveal physical differences, while also partially assessing technical skills in the case of jumping tests.
Competitive outcomes result from a complex interplay of physical, technical, and psychological factors, along with external variables such as rider performance, weather conditions, bit selection, shoeing, and other modifying elements that influence results. This complexity challenges the precision of performance assessments through standardized testing. Nevertheless, when interpreted with due consideration and caution, these findings may prove highly valuable for training regimens and competition management in show jumping horses.
ACKNOWLEDGMENTS
This research was supported by Fundação de Amparo à Pesquisa do Estado do Rio de Janeiro (FAPERJ) grant number E-26/ 201.245/2014. This work was carried out with the support of the Coordenação de Aperfeiçoamento de Pessoal de Nível Superior - Brazil (CAPES) - Finance Code 001.
REFERENCES
-
AGUILERA-TEJERO, E. et al. Quantitative analysis of acid-base balance in show jumpers before and after exercise. Research in Veterinary Science, v.68, n.2, p.103-108, 2000. Available from: <Available from: https://dx.doi.org/10.1053/rvsc.1999.0341 >. Accessed: Sept. 10, 2022. doi: 10.1053/rvsc.1999.0341.
» https://doi.org/10.1053/rvsc.1999.0341.» https://dx.doi.org/10.1053/rvsc.1999.0341 -
ALLEN, K. J. et al. Exercise testing in the equine athlete. Equine Veterinary Education, v.28, n.2, p.89-98, 2016. Available from: <Available from: https://dx.doi.org/10.1111/eve.12410 >. Accessed: Sept. 10, 2022 doi: 10.1111/eve.12410.
» https://doi.org/10.1111/eve.12410.» https://dx.doi.org/10.1111/eve.12410 -
ASSENZA, A. et al. Serum muscle-derived enzymes response during show jumping competition in horse. Veterinary World, v.9, n.3, p.251-255, 2016. Available from: <Available from: https://www.veterinaryworld.org/Vol.9/March-2016/5.html >. Accessed: Sept. 10, 2022. doi: 10.14202/vetworld.2016.251-255.
» https://doi.org/10.14202/vetworld.2016.251-255.» https://www.veterinaryworld.org/Vol.9/March-2016/5.html -
BARREY, E.; VALETTE, J. P. Exercise-related parameters of horses competing in show jumping events ranging from a regional to an international level. Annales de Zootechnie, v.42, n.1, p.89-98, 1993. Available from: <Available from: https://dx.doi.org/10.1051/animres:19930110 >. Accessed: Sept. 19, 2025. doi: 10.1051/ANIMRES:19930110.
» https://doi.org/10.1051/ANIMRES:19930110.» https://dx.doi.org/10.1051/animres:19930110 -
BAZZANO, M. et al. Application of a combined global positioning and heart rate monitoring system in jumper horses during an official competition - a preliminary study. Acta Veterinaria Hungarica, v.64, n.2, p.189-200, 2016. Available from: <Available from: https://dx.doi.org/10.1556/004.2016.019 >. Accessed: Sept. 10, 2022. doi: 10.1556/004.2016.019.
» https://doi.org/10.1556/004.2016.019.» https://dx.doi.org/10.1556/004.2016.019 -
BITSCHNAU, C. et al. Performance parameters and post exercise heart rate recovery in Warmblood sports horses of different performance levels. Equine Veterinary Journal, v.42, Supl.38, p.17-22, 2010. Available from: <Available from: https://dx.doi.org/10.1111/j.2042-3306.2010.00260.x >. Accessed: Sept. 15, 2022. doi: 10.1111/j.2042-3306.2010.00260.x.
» https://doi.org/10.1111/j.2042-3306.2010.00260.x.» https://dx.doi.org/10.1111/j.2042-3306.2010.00260.x -
BURGER, D. et al. High-level competition exercise and related fatigue are associated with stride and jumping characteristics in eventing horses. Equine Veterinary Journal, v.56, n.3, p.631-641, 2024. Available from: <Available from: https://dx.doi.org/10.1111/evj.13999 >. Accessed: Jun. 20, 2024. doi: 10.1111/evj.13999.
» https://doi.org/10.1111/evj.13999.» https://dx.doi.org/10.1111/evj.13999 -
CBH- Confederação Brasileira de Hipismo. Regulamento de saltos. 2023. Available from: <Available from: https://www.cbh.org.br >. Accessed: Jun. 20, 2023.
» https://www.cbh.org.br -
COUROUCÉ, A. et al. Comparison of some responses to exercise on the track and the treadmill in French trotters: determination of the optimal treadmill incline. Veterinary Journal, v.159, n.1, p.57-63, 2000. Available from: <Available from: https://dx.doi.org/10.1053/tvjl.1999.0381 >. Accessed: Sept. 15, 2022. doi: 10.1053/tvjl.1999.0381.
» https://doi.org/10.1053/tvjl.1999.0381.» https://dx.doi.org/10.1053/tvjl.1999.0381 -
DAUVILLIER, J. Utilisation du test d’effort dans l’évaluation de la contre-performance. In: ConférenceAnnuelle du Association des Vétérinaires Équins Français, 2022. Reims, France. Proceeding…AVEF:Reims, 2022. France, p.85-87. Available from: <Available from: https://www.ivis.org/library/avef/avef-conf%C3%A9rence-annuelle-reims-2022/utilisation-du-test-d%E2%80%99effort-dans-l%E2%80%99%C3%A9valuation-de-la-contre-performance >. Accessed: Sept. 19, 2025.
» https://www.ivis.org/library/avef/avef-conf%C3%A9rence-annuelle-reims-2022/utilisation-du-test-d%E2%80%99effort-dans-l%E2%80%99%C3%A9valuation-de-la-contre-performance -
DAVIE, A. L.; EVANS, D. J. Blood lactate responses to submaximal field exercise tests in thoroughbred horses. Veterinary Journal, v.159, n.3, p.252-258, 2000. Available from: <Available from: https://dx.doi.org/10.1053/tvjl.1999.0420 >. Accessed: Sept. 15, 2022. doi: 10.1053/tvjl.1999.0420.
» https://doi.org/10.1053/tvjl.1999.0420.» https://dx.doi.org/10.1053/tvjl.1999.0420 -
DE MARÉ, L. et al. Profiling the aerobic window of horses in response to training by means of a modified Lactate minimum speed test: flatten the curve. Frontiers of Physiology, v.13, p.792052, 2022. Available from: <Available from: https://dx.doi.org/10.3389/fphys.2022.792052 >. Accessed: Sept. 20, 2022. doi: 10.3389/fphys.2022.792052.
» https://doi.org/10.3389/fphys.2022.792052.» https://dx.doi.org/10.3389/fphys.2022.792052 -
DE MARÉ, L. et al. Standardized exercise tests in horses: current situation and future perspectives. Vlaams Diergeneesk Tijdschrift, v.86, n.2, p.63-72, 2017. Available from: <Available from: https://dx.doi.org/10.21825/vdt.v86i2.16290 >. Accessed: Sept. 20, 2022. doi: 10.21825/vdt.v86i2.16290.
» https://doi.org/10.21825/vdt.v86i2.16290.» https://dx.doi.org/10.21825/vdt.v86i2.16290 -
EVANS, D. L. Physiology of equine performance and associated tests of function. Equine Veterinary Journal, v.39, n.4, p.373-383, 2007. Available from: <Available from: https://dx.doi.org/10.2746/042516407x206418 > Accessed: Sept. 20, 2022. doi: 10.2746/042516407X206418.
» https://doi.org/10.2746/042516407X206418.» https://dx.doi.org/10.2746/042516407x206418 -
FAZIO, F. et al. Blood biochemical changes in show jumpers during a simulated show jumping test. Veterinarski Arhiv, v.84, n.2, p.143-152, 2014. Available from: <Available from: https://api.semanticscholar.org/CorpusID:82515486 >. Accessed: Sept. 19, 2025.
» https://api.semanticscholar.org/CorpusID:82515486 -
FAZIO, F. et al. Cardiac biomarker responses to acute exercise in show jumping horses. Journal of Equine Veterinary Science, v.128, p.104882, 2023. Available from: <Available from: https://dx.doi.org/10.1016/j.jevs.2023.104882 >. Accessed: Jun. 10, 2024. doi: 10.1016/j.jevs.2023.104882.
» https://doi.org/10.1016/j.jevs.2023.104882.» https://dx.doi.org/10.1016/j.jevs.2023.104882 -
FERRAZ, G. C. et al. Blood lactate threshold reflects glucose responses in horses submitted to incremental exercise test. Arquivo Brasileiro de Medicina Veterinária e Zootecnia, v.60, n.1, p.256-259, 2008. Available from: <Available from: https://www.scielo.br/j/abmvz/a/zD6Hw3JMZb9JdBgHwznT7Bx/?format=pdf⟨=en >. Accessed: Sept. 19, 2025. doi: 10.1590/S0102-09352008000100035.
» https://doi.org/10.1590/S0102-09352008000100035.» https://www.scielo.br/j/abmvz/a/zD6Hw3JMZb9JdBgHwznT7Bx/?format=pdf⟨=en -
GOTTLIEB-VEDI, M.; LINDHOLM, A. Comparison of standardbred trotters exercising on a treadmill and a race track with identical draught resistances. Veterinary Record, v.140, n.20, p.525-528, 1997. Available from: <Available from: https://dx.doi.org/10.1136/vr.140.20.525 >. Accessed: Sept. 15, 2022. doi: 10.1136/vr.140.20.525.
» https://doi.org/10.1136/vr.140.20.525.» https://dx.doi.org/10.1136/vr.140.20.525 -
GUNDASHEVA, D. Biochemical response to physical exercise in show-jumping horses. Comparative Exercise Physiology, v.12, n.1, p.11-16, 2016. Available from: <Available from: https://dx.doi.org/10.3920/cep150033 >. Accessed: Sept. 15, 2022. doi: 10.3920/CEP150033.
» https://doi.org/10.3920/CEP150033.» https://dx.doi.org/10.3920/cep150033 -
HARGREAVES, B. J. et al. Ambient temperature and relative humidity influenced packed cell volume, total plasma protein and other variables in horses during an incremental submaximal field exercise test. Equine Veterinary Journal, v.31, n.4, p.314-318, 1999. Available from: <Available from: https://dx.doi.org/10.1111/j.2042-3306.1999.tb03823.x >. Accessed: Sept. 10, 2022. doi: 10.1111/j.2042-3306.1999.tb03823.x.
» https://doi.org/10.1111/j.2042-3306.1999.tb03823.x.» https://dx.doi.org/10.1111/j.2042-3306.1999.tb03823.x -
KĘDZIERSKI, W. Changes in plasma leptin concentration during different types of exercises performed by horses. Animal, v.8, n.9, p.1456-1461, 2014. Available from: <Available from: https://dx.doi.org/10.1017/S1751731114001220 >. Accessed: Sept. 15, 2022. doi: 10.1017/S1751731114001220.
» https://doi.org/10.1017/S1751731114001220.» https://dx.doi.org/10.1017/S1751731114001220 -
KIRSCH, K. et al. Monitoring performance in show jumping horses: validity of non-specific and discipline-specific field exercise tests for a practicable assessment of aerobic performance. Frontiers of Physiology, v.12, p.818381, 2022. Available from: <Available from: https://dx.doi.org/10.3389/fphys.2021.818381 >. Accessed: Jun. 20, 2024. doi: 10.3389/fphys.2021.818381.
» https://doi.org/10.3389/fphys.2021.818381.» https://dx.doi.org/10.3389/fphys.2021.818381 -
KRUMRYCH, W. Blood antioxidant defence in horses during physical exercises. Bulletin of the Veterinary Institute in Pulawy, v.54, p.617-624. 2010. Available from: <Available from: https://www.cabdirect.org/cabdirect/abstract/20113028200 >. Accessed: Sept. 19, 2025.
» https://www.cabdirect.org/cabdirect/abstract/20113028200 -
KUPCZYŃSKI, R. et al. The influence of different workload trainings on some blood parameters in show jumping horses. Veterinarski Arhiv, v.88, n.3, p.279-293, 2018. Available from: <Available from: https://vetarhiv.vef.unizg.hr/papers/2018-88-3-1.pdf?ci=rhehogidfkkinkjroqltldik >. Accessed: Sept. 19, 2025. 10.24099/vet.arhiv.170513.
» https://doi.org/10.24099/vet.arhiv.170513» https://vetarhiv.vef.unizg.hr/papers/2018-88-3-1.pdf?ci=rhehogidfkkinkjroqltldik -
LÉGUILLETTE, R. et al. Comparison of physiological demands in Warmblood show jumping horses over a standardized 1.10 m jumping course versus a standardized exercise test on a track. BMC Veterinary Research, v.16, p.182, 2020. Available from: <Available from: https://dx.doi.org/10.1186/s12917-020-02400-9 >. Accessed: Sept. 10, 2022. doi: 10.1186/s12917-020-02400-9.
» https://doi.org/10.1186/s12917-020-02400-9.» https://dx.doi.org/10.1186/s12917-020-02400-9 -
OLDRUITENBORGH-OOSTERBAAN, M. M. S. et al. The workload of riding-school horses during jumping. Equine Veterinary Journal, v.38, n.S36, p.93-97, 2006. Available from: <Available from: https://doi.org/10.1111/j.2042-3306.2006.tb05520.x >. Accessed Sept. 15, 2022. doi: 10.1111/j.2042-3306.2006.tb05520.x.
» https://doi.org/10.1111/j.2042-3306.2006.tb05520.x.» https://doi.org/10.1111/j.2042-3306.2006.tb05520.x -
PICCIONE, G. et al. Blood lactate levels during exercise in athletic horses. Comparative Clinical Pathology, v.19, p.535-539, 2010. Available from: <Available from: https://dx.doi.org/10.1007/s00580-010-0965-x >. Accessed: Sept. 20, 2022. doi: 10.1007/s00580-010-0965-x.
» https://doi.org/10.1007/s00580-010-0965-x.» https://dx.doi.org/10.1007/s00580-010-0965-x - RODRIGUES, T. N. G. et al. Evaluation of show-jumping horses: hematology, biochemistry and kinematics of horses in show-jumping competition. Ciência Rural,v. 56, n.3 2026.
- RUDOLPH, W. et al. Variación de lasisoenzimas de hidrogenasa láctica posterior a um ejercicioen equinos fina sangre de carreracon diferentes períodos entrenamiento. Archivos de MedicinaVeterinaria, v.25, n.1, p.57-65, 1993.
-
SABEV, S. Effect of the jumping activity in the course of training exercise on the level of serum cortisol, blood lactate and heart rate in horses. Trakia Journal of Sciences, v.9, n.1, p.78-82, 2011. Available from: <Available from: http://tru.uni-sz.bg/tsj/ >. Accessed: Sept. 19, 2025.
» http://tru.uni-sz.bg/tsj/ -
SANTOS, V. P. et al. Hemato-biochemical response to exercise with ergometric treadmill, mount training and competition in jumping horses. Archives of Veterinary Science, v.20, Supl.1, p.1-8, 2015. Available from: <Available from: https://dx.doi.org/10.5380/avs.v20i2.36617 >. Accessed: Sept. 15, 2022. doi: 10.5380/avs.v20i2.36617.
» https://doi.org/10.5380/avs.v20i2.36617.» https://dx.doi.org/10.5380/avs.v20i2.36617 -
SCHUBACK, K.; ESSÉN-GUSTAVSSON, B. Muscle anaerobic response to a maximal treadmill exercise test in Standardbred trotters. Equine Veterinary Journal, v.30, n.6, p.504-510, 1998. Available from: <Available from: https://dx.doi.org/10.1111/j.2042-3306.1998.tb04526.x >. Accessed: Sept. 15, 2022. doi: 10.1111/j.2042-3306.1998.tb04526.x.
» https://doi.org/10.1111/j.2042-3306.1998.tb04526.x.» https://dx.doi.org/10.1111/j.2042-3306.1998.tb04526.x -
SOARES, J. C. M. et al. Biochemical and antioxidant changes in plasma, serum, and erythrocytes of horses before and after a jumping competition. Journal of Equine Veterinary Science, v.31, n.7, p.357-360, 2011. Available from: <Available from: https://dx.doi.org/10.1016/j.jevs.2011.03.017 >. Accessed: Sept. 20, 2022. doi: 10.1016/j.jevs.2011.03.017.
» https://doi.org/10.1016/j.jevs.2011.03.017.» https://dx.doi.org/10.1016/j.jevs.2011.03.017 -
SOARES, O. A. B. et al. Comparison between specific and nonspecific tests for evaluating the physical fitness of show jumping horses. Comparative Exercise Physiology , v.12, n.3, p.131-140, 2016. Available from: <Available from: https://dx.doi.org/10.3920/CEP160018 >. Accessed: Sept. 10, 2022. doi: 10.3920/CEP160018.
» https://doi.org/10.3920/CEP160018.» https://dx.doi.org/10.3920/CEP160018 -
VAN ERCK, E. How to utilize diagnostics for fitness. In: British Equine Veterinary Association Congress, 60, Liverpool, UK. Procedings… BEVA Handbook, Liverpool, United Kingdom. 2022. Available from: <Available from: https://www.ivis.org/library/beva/beva-annual-congress-liverpool-2022/how-to-utilise-diagnostics-for-fitness >. Accessed: Mar. 20, 2023.
» https://www.ivis.org/library/beva/beva-annual-congress-liverpool-2022/how-to-utilise-diagnostics-for-fitness -
WALLER, A.; LINDINGER, M. I. Physicochemical analysis of acid-base status during recovery from high-intensity exercise in standardbred racehorses. Equine Comp. Exercise Physiol, v.2, n.2, p.119-127, 2005. Available from: <Available from: http://dx.doi.org/10.1079/ECP200549 >. Accessed: Sept. 20, 2022. doi: 10.1079/ECP200549.
» https://doi.org/10.1079/ECP200549.» http://dx.doi.org/10.1079/ECP200549
-
CR-2025-0006.R1
-
AUTHORS’ CONTRIBUTIONS
TNGR and FQA conceived the research. TNGR, MTR, PIT and FQA performed the methodology. TNGR, VPS and FQA performed the data analysis. TNGR wrote the original manuscript. APB, JAG, PIT and FQAwrote and reviewed the final manuscript. F.Q.Aapproved funding for research. All authors have read and agreed to the published version of the manuscript.
-
BIOETHICS AND BIOSECURITY COMMITTEE APPROVAL
The animal study protocol was approved by the Ethics Committee of the Universidade Federal Rural do Rio de Janeiro (UFRRJ) (protocol code UFRRJ/COMEP: no 263/2012).
-
DATA AVAILABILITY STATEMENT
Research data may be requested from the corresponding author.
-
DECLARATION OF USE OF ARTIFICIAL INTELLIGENCE
The authors declare that no artificial intelligence resources were used in the writing or development of this manuscript.
Edited by
-
ASSOCIATE EDITOR:
Rudi Weiblen (0000-0002-1737-9817)
-
SCIENTIFIC EDITOR
Gustavo Miranda Zanotto (0000-0001-8498-5246)
Research data may be requested from the corresponding author.