 Birth weight in Alpine kids using body measurements: a comparison of artificial neural network and multiple linear regression models
ABSTRACT:
The present study was conducted to estimate the body weights of Alpine kids using somebody measurements with artificial neural network (ANN) and multiple linear regression (MLR) analysis. For this purpose, the birth weight of 97 kids in total and body measurements such as withers height, rump height, chest depth, chest girth and body length were taken. The model performance criteria used to compare the neural networks and regression analysis results for the goodness of fit are coefficient of determination (R2) and mean square error (MSE). In analyses using artificial neural networks, Levenberg-Marquardt (LM), Bayesian Regularization (BR), and Scaled Conjugate Gradient (SCG) algorithms were applied. The findings showed that the LM algorithm produced the best results and achieved the highest R² and lowest MSE values among the ANN training algorithms. The ANN model (R² = 0.9173; MSE = 0.0006) outperformed the MLR model (R² = 0.791; MSE = 0.101) in predicting the birth weight of Alpine kids.
Key words:
goat production; Türkiye; machine learning; predictive modelling
RESUMO:
O presente estudo foi conduzido para estimar o peso corporal de cabritos alpinos, tomando algumas medidas corporais por meio de rede neural artificial (RNA) e análise de regressão linear múltipla (RLM). Para tanto, foram coletados o peso total ao nascer de 97 cabritos, além de medidas corporais como altura da cernelha, altura da garupa, profundidade do peito, perímetro torácico e comprimento do corpo. Os critérios de desempenho do modelo usados para comparar redes neurais e os resultados de ajuste da análise de regressão são os coeficiente de determinação (R2) e o Erro Quadrático Médio (EEM). Nas análises usando redes neurais artificiais, foram aplicados os algoritmos Levenberg-Marquardt (LM), Regularização Bayesiana (RB) e Gradiente Conjugado Escalonado (GCE). Os resultados mostraram que o algoritmo LM produziu os melhores resultados, alcançando os maiores valores de R² e os menores valores de EEM entre os algoritmos de treinamento de RNA. O modelo RNA (R² = 0.9173; EEM = 0.0006) superou o modelo RLM (R² = 0.791; EEM = 0.101) na previsão do peso ao nascer de cabritos da raça Alpine.
Palavras-chave:
produção caprina; Turquia; aprendizado de máquina; modelagem preditiva
INTRODUCTION
Goats (Capra hircus) are one of the oldest animal species, domesticated more than 10,000 years ago in the Zagros Mountains and Eastern Anatolia, playing an important cultural and economic role by providing humans with meat, milk and leather (KICHAMU et al., 2024). As small ruminants, goats are widely raised in many parts of the world, particularly in rural and mountainous regions, due to their durable constitution, low maintenance requirements, high adaptability to harsh environmental conditions, and ability to graze easily in rugged, rocky areas (NAIR et al., 2021). Goats are also highly valued for their productivity, adaptability, and resistance to diseases (DASKIRAN et al., 2018; KOLUMAN et al., 2024). According to the Food and Agriculture Organization (FAO) data, the global goat population is 1,002 billion, with the largest populations being in Asia (57.7%) and Africa (35.7%) (ANTUNOVIĆ et al., 2025). Türkiye is one of the leading countries in the world in terms of goat population and production (DASKIRAN et al., 2018), and an increase in the goat population in Türkiye has been observed in recent years (SERT & DURMUS, 2024; SERT & DURMUS, 2025). Goat farming in Türkiye is carried out by small-scale farmers living in rural areas and is a significant animal production activity for both meat and milk (TOPLU & ALTINEL, 2008). The Alpine goat, a high-yielding breed used in this farming activity, holds significant economic value for breeders, particularly due to its high milk yield and fertility.
Increasing the productivity of these animals and ensuring the genetic development of herds depend on accurately evaluating performance data obtained from birth (ASSAN, 2013). Weights and growth rates from birth to weaning are the primary determinants of production efficiency in livestock farming (ASSAN, 2020). In goats, birth weight varies widely due to both environmental and genetic factors, including birth season, sire age, dam age, offspring sex, year of birth, and birth type (CHALBI et al., 2022; RAMOROKA et al., 2024). It also affects basic production parameters such as birth weight, survival rate, growth rate, and milk or meat yield in goats during later periods (JAT & DATT, 2025). Therefore, birth weight is considered an important criterion for early selection and herd management in small ruminant farming (SAHIN, 2022). High mortality rates, especially among kids with low birth weight (ANDRÉS et al., 2020), make the measurement, prediction, and control of this trait critical from an economic perspective.
There are two main approaches to determine animal weight: direct measurement using weighing devices and indirect estimation using measurements taken from specific body parts (WANG et al., 2021; CAMACHO-PÉREZ et al., 2022). Direct weight measurement requires handling the animals and placing them on weighing devices. However, it has been reported that animals experience stress and increased cortisol levels during routine husbandry procedures such as milking, shearing, weighing, loading, and hoof care (YARDIMCI et al., 2013). A study with lambs indicated that stress affects their health and production performance (NAVARRO et al., 2020). Therefore, as direct interventions on animals increase, their welfare and development are negatively affected. Various methodologies, such as mathematical regression models using morphological measurements, are used for indirect weight estimation (CAMACHO-PÉREZ et al., 2022). Using such methodologies and existing data to extrapolate additional data will reduce the stress to which animals are exposed due to intervention.
Within animal production systems, estimating economically important performance metrics such as body weight, egg production, milk yield, and hair production plays a crucial role in developing future on-farm and off-farm decision support systems. Classical statistical methods and artificial intelligence-based modelling techniques are widely used today for the control, analysis, and prediction of animal production data (IKIKAT TUMER et al., 2020; SINGH et al., 2020; ELLIS, 2021; GRITSENKO et al., 2023; ERDOGAN ATAC et al., 2023; ATOUI et al., 2024; MELAK et al., 2024; MAKGOPA et al., 2024; YANG et al., 2025; GONCALVES et al., 2025). There are many studies in the literature that employ artificial neural networks and multiple linear regression, to make predictions in animal science. THIRUVENKADAN (2005), ALADE et al. (2008), RAJA et al. (2012), YILMAZ et al. (2013), AKKOL et al. (2017), KHORSHIDI‐JALALI et al. (2019), GHOTBALDINI et al. (2019), ABD-ALLAH et al. (2019), ADHIANTO et al. (2020), DAKHLAN et al. (2020), IBRAHIM et al. (2021), KADER ESEN & ELMACI (2021), TYASI & CELIK (2023) estimated some body measurements in small ruminants by artificial neural network or multiple linear regression.
The multiple linear regression (MLR) model is a traditional modelling technique used to estimate the relationship between dependent and independent variables (LU et al., 2025). In recent years, artificial neural networks (ANNs) have frequently been used as an alternative to regression analysis. Various studies have shown that ANN models provide successful results in predicting traits such as milk yield, body weight gain, and birth weight (TAHMOORESPUR & AHMADI, 2012; WANG et al., 2021; RIBEIRO et al., 2021; ANGELES-HERNANDEZ et al., 2022). ANNs are an effective artificial intelligence technique that mimics the learning mechanism of the human brain and models nonlinear relationships. An artificial neuron receives information as input, processes it using mathematical formulas, and produces an output that determines the neuron’s behavior (LEMONIS et al., 2022). ANNs are widely used for complex systems that are difficult to predict, especially when data are insufficient (ELMABROUK et al., 2014; SALEHUDDIN et al., 2022).
In this study, the comparative performance of ANN and MLR models was evaluated for the estimation of birth weight from various body measurements of Alpine goats. The findings are expected to contribute to early selection studies and production planning in goat breeding.
MATERIALS AND METHODS
Location and animal care
The present study was conducted on 97 kids obtained from the Alpine goats raised at Cukurova University, Faculty of Agriculture, Dairy Goat and Sheep Breeding Research and Application Unit, Adana, Türkiye. Animals are reared under semi-intensive conditions in a semi-open system. The province of Adana carried in the study is in the Mediterranean Region at 37º north parallel, 35º east longitude, and 40 m above sea level. This region is hot and dry in summer and warm and rainy in winter. The average humidity is around 66%, and the north-south wind prevails. During pregnancy, roughage (alfalfa hay, corn silage) and concentrated feed were given to the Alpine goats.
Data set
Growth in goats is determined by taking certain body measurements, primarily body weight. For this purpose, measurements are taken to predict future growth, particularly musculoskeletal development. These early measurements are used effectively in allocating kids for breeding. Therefore, body weight (BW) and body measurements such as withers height (WH), rump height (RH), chest depth (CD), chest girth (CG), and body length (BL) from kids were taken at one day of age shortly after birth. In the current study, body measurements were taken for all offspring without considering factors such as gender, birth type, and age of the mother. When the gender and birth type of the born kids were taken into consideration, 53 were male and 44 were female; 8 were single, 52 were twins and 37 were triplets. A digital scale with a 5 g sensitivity was used to assess the kids’ birth weights, and a tape measure was used to measure their chest girths and other body measurements.
The measurements taken from the kids are described below. Wither height (cm) - vertical distance between the highest point of the withers and the base level; rump height (cm) - vertical distance between the highest point of the rump and the base level; chest depth (cm) - vertical distance between the highest point of the withers and the sternum; chest girth (cm) - the length of the 360° circumference taken by passing over sternum bone, behind the withers; body length (cm) - distance between the shoulder tip and the seat bump.
Statistical analyses
The variables in the data sets used in data mining have different scales and units (WU & WANG, 2022). Attributes having large or small values and ranges in the dataset will cause instability in the ANN training process (MAARIF et al., 2022). Therefore, data normalization, which is a technique in data preprocessing, should be done. The most used data normalization is minimum/maximum normalization, which uses the minimum and maximum values of each attribute (SINSOMBOONTHONG, 2022). The minimum/maximum normalization used in this study is given by equation 1.
(1)
In which X nor is normalized imput, X i is original value, X min is minimum value of data to be normalized, and X max is maksimum value of data to be normalized (CHO et al., 2022).
Artificial neural network (ANN)
In the analysis of Artificial Neural Networks (ANN), the Multi-Layer Perceptron (MLP), one of the most commonly used architectures, consists of an input layer, an output layer and one or more hidden layers of neurons (WIJAYANINGRUM et al., 2021). Feedforward neural networks (FNNs), one of the main categories of neural networks that connect neurons across layers (IMRAN & ALSUHAIBANI, 2019), connect the input to the hidden layer and the hidden layer to the output layer in a single direction (OBITE et al., 2020).
Each input from the input layer is given a certain weight. The weights indicated the importance of incoming information. The summation function is used to calculate the total input in a cell. The weighted sum, the most frequently used summation function, is calculated by multiplying and summing the inputs and the weights (CELIK & ALTUNAYDIN, 2018). The sum of the weighted inputs and the bias forms the input to the transfer function. A transfer function processes this sum and produces the output (AHMADI, 2015).
Transfer functions are used to initiate data transmission from the input or hidden layer and configure the calculated output (FENG & LU, 2019; MAKOMERE et al., 2023). The most used transfer functions are tansig and logsig function and make the ANNs a universal function approximator given a sufficient number of hidden neuron (PANDEY et al., 2016). The purelin, tansig and logsig transfer functions are given by equations (2-4) (YOGITHA & MATHIVANAN, 2018).
f(x)=x (2)
(3)
(4)
In which f(x) is the output value from the function (output), x is the input value to the function (input), e is Euler’s number (e ≈ 2.71828).
Training is the process of optimizing the connection weights (CHAKRABORTY & GOSWAMI, 2017). The training algorithms used in this study, namely the Levenberg-Marquardt (LM) algorithm, Bayesian Regularization (BR) algorithm and Scaled Conjugate Gradient (SCG) algorithm, are given by equations (5-7).
(5)
In which I is a identity matrix, e is the error vector, J is a Jacobian matrix, X k is the weight at epoch K, and u is a damping factor (MARKOVA, 2019; HUANG et al., 2021).
F(w) = αE w + βE D (6)
In which E D is the sum of squared network errors, E W is the sum of squared network weights and α and β are the function parameters (YUE et al., 2011; HUANG et al., 2021).
xk+1 = x k + n k d k (7)
In which x k is weight parameters, n k is the learning rate and d k is a descent search direction (BULUT et al., 2021).
Number of hidden layers, number of neurons in hidden layers, transfer functions (activation function), training algorithms are selected by the trial and error method (ALALOUL et al., 2018; PATIL et al., 2021). Because there is no definite method to determine these parameters.
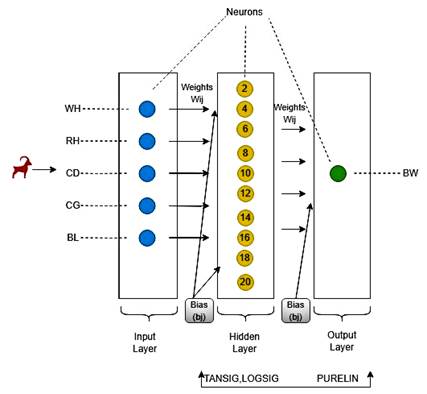
In this study, the ANN network selected is multi-layer perceptron (MLP) and neurons in all layers are connected by a feed forward neural networks (FNNs). Input variable is BW and output variables are WH, RH, CD, CG and BL. Since these values have different units, they are normalized with the min-max method. The data applied was 70% for training the network, 15% for validation and 15% for testing. Tansig and logsig function are used in the hidden layers whereas purelin function is used in the output layer. The number of neurons was selected in a range from 2 to 20. LM, BR and SCG 1000 epoch training algorithms were applied. Models are robust in BR and no need for a separate validation set (BURDEN & WINKLER, 2008). The ANN design, which demonstrates the relationship between the input and output layers, is given in figure 1.
Developed ANN model design. WH = withers height; RH = rump height; CD = chest depth; CG = chest girth; BL = body length; BW = body weight; ANN = artificial neural network.
Multiple linear regression (MLR)
The MLR is used to model the relationship between a dependent variable and more than one independent variable (ZARE ABYANEH, 2014). The general model of multiple linear regression is given by Eq. (8) (MONTGOMERY et al., 2001).
yi=β0+β1xi1+β2xi2+...+βkXik+ εi (8)
In which y i is i-th observation in the dependent variable, β 0 is the intercept, β j is the regression coefficient, X i is the independent variables, k is the number of the independent variable, and εi is the random error term.
Evaluation criteria for ANN and MLR prediction
The performance of the model was assessed by the coefficient of determination (R2) and mean square error (MSE). The calculation of R2 and MSE is performed using equations (9-10) (ZHANG et al., 2022).
(9)
(10)
In which n is number of observations, y i is observed value, is predicted value. The higher R2 values represent the greater fit between the observed and predicted values. The lower MSE represents a trained model with higher accuracy (HUANG et al., 2021). MATLAB 2021a version software was used for ANN and MLR modeling and analysis.
RESULTS AND DISCUSSION
Descriptive statistics of body weight and some body measurements taken from 97 heads of Alpine kids are shown in table 1. In this study, the average body weight at birth was 4.166 kg. DE MENEZES et al. (2007) reported the average body weight of Alpine kids at birth as 3.61 kg, and MAKSIMOVIĆ et al. (2015) reported birth weight as 2.73 kg. KUME & HAJNO (2010) also found birth weights of 3.11-3.15 kg. Compared to other studies in the literature, the significantly higher offspring body weights detected in our current study are most likely related to the characteristics of the mothers in our experimental groups. In particular, the advanced age of the breeding mothers used in our study and their average body weight (average 60 kg) form the basis of this difference.
The MLR analysis results are shown in table 2. The most reliable predictors of the equation are the variables CG and BL, with P < 0.001. Although, the other variables (WH, RH, CD) contribute to the model, they are not considered statistically significant on their own.
Through the MLR model, the direction of effect (positive or negative coefficient) and the magnitude (coefficient value) of each body measurement on the birth weight estimation are clearly visible. If the coefficient values in table 2 are substituted, the final equation for BW estimation is as follows:
BW = -6.557 + 0.092WH - 0.059RH - 0.048CD + 0.149CG + 0.146BL
The network structure selection was made based on the mean square error (MSE) (LORENC et al., 2021). The modelling results of three training algorithms (LM, BR and SCG algorithm) are given in table 3, table 4, and table 5.
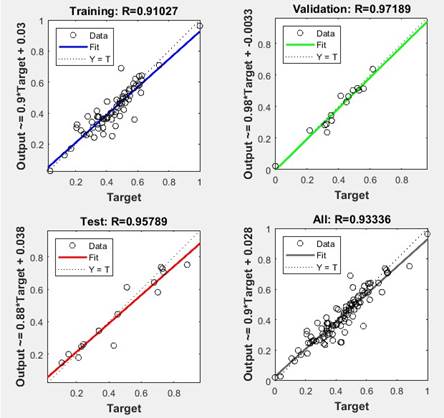
When the ANN model’s predictive performance is examined, as shown in figure 2, the R correlation coefficient is very high at 0.95789, even on the test data set, which is the most critical success metric. The R = 0.97189 value on the validation set demonstrates that the model is not overfitting and possesses high generalization capability. These high correlation values demonstrate that the ANN model produces highly reliable and accurate results for birth weight prediction in Alpine goats.
The regression fit graphical representation for LM. R = correlation coefficient; LM = levenberg-marquardt algorithm.
When the ability of BR, LM and SCG neural network training algorithms to estimate body weight was investigated, the LM algorithm provided the best result (Table 6). MARKOVA (2019) stated that among LM, BR and SCG algorithms, the LM algorithm performed better in its predictions. GUZEL (2018), XEZONAKIS et al. (2024), DENIZHAN (2024) reported that both LM and BR algorithms outperformed the SCG algorithm.
When the internal structure of the ANN model was examined, it was determined that among the body measurements used in birth weight estimation, CG had the greatest mathematical weight compared to all other inputs. The RH was determined as the second most influential input. This finding from the ANN model closely parallels the results of the MLR model. In the MLR analysis, CG had the highest positive coefficient and the highest statistical significance (P < 0.001), indicating that both models, based on two fundamentally different mathematical principles, confirmed chest girth as the most reliable biological determinant of birth weight in Alpine goats. Although, although it was statistically insignificant in the MLR (P > 0.05), the RH variable was identified as the second most significant variable in the ANN model. This result demonstrated the ability of the ANN to capture complex nonlinear relationships. This suggests that the effect of RH on birth weight is mediated through complex interactions and synergies with other morphological measurements, rather than a simple linear relationship.
While the MSE of the ANN model (0.0006) was lower than that of the MLR (0.101), the coefficient of determination (R2 = 0.9173) was higher than that of the MLR (0.791) in Alpine kids (Table 7). Therefore, it was concluded that the ANN model is a more reliable and accurate tool for estimating the body weight of Alpine kids. AKKOL et al. (2017) estimated body weight from chest width, rump height, withers height, back height, chest depth, chest girth and body length in Hair goats; KHORSHIDI‐JALALI et al. (2019) estimated from body length, withers height, chest girth in Raini Cashmere goats; RAJA et al. (2012) estimated from body circumference, body length and withers height in Attappady Black goats; TYASI & CELIK (2023) estimated from body length, heart girth, withers height, rump height, rump length, ear length and head width in Boer goats. It has been proven that the ANN model has better performance than the MLR model because it has higher R2 and the lowest MSE.
CONCLUSION
Artificial neural networks and multiple linear regression models were compared to identify the best model for predicting the birth weight of Alpine kids. The results indicated that artificial neural network model is more robust and can predict birth weight from certain body measurements of Alpine kids more accurately than multiple linear regression model. The findings also show that chest girth is the most reliable predictor of birth weight in kids. This morphological measurement can serve as a simple, practical, and reliable tool for estimating birth weight in the field with high accuracy and low cost. This provided farmers with a solid basis for making informed herd management and feeding decisions.
ACKNOWLEDGMENTS
I gratefully thank Dr. Murat DURMUS at Cukurova University for his contributions in this study.
REFERENCES
-
ABD-ALLAH, S. et al. Some body measurements as a management tool for Shami goats raised in subtropical areas in Egypt. Bulletin of the National Research Centre, v.43, p.1-6, 2019. Available from: <Available from: https://www.semanticscholar.org/paper/Some-body-measurements-as-a-management-tool-for-in-A.-Rahman/521d14ac94fa28a6e5fe1008919e02354473f407 >. Accessed: Mar. 09, 2026. doi: 10.1186/s42269-019-0042-9.
» https://doi.org/10.1186/s42269-019-0042-9.» https://www.semanticscholar.org/paper/Some-body-measurements-as-a-management-tool-for-in-A.-Rahman/521d14ac94fa28a6e5fe1008919e02354473f407 -
ADHIANTO, K. et al. Prediction of body weight through body measurements in Boerawa (Boer×Etawah crossbred) bucks at Tanggamus Regency of Indonesia. Bulgarian Journal of Agricultural Science, v.26, p.1273-1279, 2020. Available from: <Available from: https://www.agrojournal.org/26/06-22.pdf >. Accessed: Mar. 09, 2026.
» https://www.agrojournal.org/26/06-22.pdf -
AHMADI, M. A. Developing a robust surrogate model of chemical flooding based on the artificial neural network for enhanced oil recovery implications. Mathematical Problems in Engineering, p.1-9, 2015. Available from: <Available from: https://onlinelibrary.wiley.com/doi/10.1155/2015/706897 >. Accessed: Mar. 09, 2026. doi:10.1155/2015/706897.
» https://doi.org/10.1155/2015/706897» https://onlinelibrary.wiley.com/doi/10.1155/2015/706897 -
AKKOL, S. et al. Comparison of artificial neural network and multiple linear regression for prediction of live weight in hair goats. Yuzuncu Yıl University Journal of Agricultural Sciences, v.27, p.21-29, 2017. Available from: <Available from: https://dergipark.org.tr/en/pub/yyutbd/article/263968 >. Accessed: Mar. 09, 2026. doi: 10.29133/yyutbd.263968.
» https://doi.org/10.29133/yyutbd.263968.» https://dergipark.org.tr/en/pub/yyutbd/article/263968 -
ALADE, N. K. et al. Determination of appropriate model for the estimation of body weight in goats. Journal of Agricultural and Biological Science, v.3, p.52-57, 2008. ISSN 1990-6145. Available from: <Available from: https://www.arpnjournals.com/jabs/research_papers/rp_2008/jabs_0708_92.pdf >. Accessed: Mar. 09, 2026.
» https://www.arpnjournals.com/jabs/research_papers/rp_2008/jabs_0708_92.pdf -
ALALOUL, W. S. et al. An artificial neural networks (ANN) model for evaluating construction project performance based on coordination factors. Cogent Engineering, v.5, p.1507657, 2018. Available from: <Available from: https://www.tandfonline.com/doi/full/10.1080/23311916.2018.1507657 >. Accessed: Mar. 09, 2026. doi: 10.1080/23311916.2018.1507657.
» https://doi.org/10.1080/23311916.2018.1507657.» https://www.tandfonline.com/doi/full/10.1080/23311916.2018.1507657 -
ANDRÉS, S. et al. Effects of birth weight on animal performance, fattening traits and meat quality of lambs. Animals, v.10, 2364, 2020. Available from: <Available from: https://www.mdpi.com/2076-2615/10/12/2364 >. Accessed: Mar. 9, 2026. doi:10.3390/ani10122364.
» https://doi.org/10.3390/ani10122364» https://www.mdpi.com/2076-2615/10/12/2364 -
ANGELES-HERNANDEZ, J. C. et al. Estimation of milk yield based on udder measures of Pelibuey sheep using artificial neural networks. Scientific Reports, v.12, 9009, 2022. Available from: <Available from: https://www.nature.com/articles/s41598-022-12868-0 >. Accessed: Mar. 09, 2026. doi: 10.1038/s41598-022-12868-0.
» https://doi.org/10.1038/s41598-022-12868-0.» https://www.nature.com/articles/s41598-022-12868-0 -
ANTUNOVIĆ, Z. et al. Blood mineral profile of French Alpine goats during the first third of the lactation period. Archives Animal Breeding, v.68, p.201-209, 2025. Available from: <Available from: https://aab.copernicus.org/articles/68/201/2025/ >. Accessed: Mar. 09, 2026. doi: 10.5194/aab-68-201-2025.
» https://doi.org/10.5194/aab-68-201-2025.» https://aab.copernicus.org/articles/68/201/2025/ -
ASSAN, N. Various factors influencing birth weight in animal production. Scientific Journal of Review, v.2, 156-175, 2013. ISSN 2322-2433. Available from: <Available from: https://www.sjournals.com/index.php/sjr/article/view/655/635 >. Accessed: Mar. 09, 2026.
» https://www.sjournals.com/index.php/sjr/article/view/655/635 -
ASSAN, N. Determinants of birth weight and its size as an onset representative of growth potential in goat and sheep meat production. Agricultural Advances, v.9, 522-536, 2020. Available from: <Available from: https://sjournals.com/index.php/aa/article/view/645/1051 >. Accessed: Mar. 09, 2026. doi: 10.14196/aa.v9i5.645.
» https://doi.org/10.14196/aa.v9i5.645.» https://sjournals.com/index.php/aa/article/view/645/1051 -
ATOUI, A. et al. Prediction of birth weight using body measurements of local caprine population kids raised in a low-input breeding mode under arid environment. Tropical Animal Health and Production, v.56, n.15, 2024. Available from: <Available from: https://link.springer.com/article/10.1007/s11250-023-03865-0 >. Accessed: Mar. 09, 2026. doi:10.1007/s11250-023-03865-0.
» https://doi.org/10.1007/s11250-023-03865-0» https://link.springer.com/article/10.1007/s11250-023-03865-0 -
BULUT, M. et al. Comparison of three different learning methods of multilayer perceptron neural network for wind speed forecasting. Gazi University Journal of Science, v.34, p.439-454, 2021. Available from: <Available from: https://dergipark.org.tr/en/pub/gujs/article/764533 >. Accessed: Mar. 09, 2026. doi: 10.35378/gujs.764533.
» https://doi.org/10.35378/gujs.764533.» https://dergipark.org.tr/en/pub/gujs/article/764533 -
BURDEN, F.; WINKLER, D. Bayesian regularization of neural networks. In: LIVINGSTONE, D. J. (eds) Artificial Neural Networks. Methods in Molecular Biology, Humana Press, v.458, p.23-44, 2008. Available from: <Available from: https://link.springer.com/protocol/10.1007/978-1-60327-101-1_3 >. Accessed: Mar. 09, 2026. doi: 10.1007/978-1-60327-101-1_3.
» https://doi.org/10.1007/978-1-60327-101-1_3.» https://link.springer.com/protocol/10.1007/978-1-60327-101-1_3 -
CAMACHO-PÉREZ, E. et al. Towards the estimation of body weight in sheep using metaheuristic algorithms from biometric parameters in microsystems. Micromachines, v.13, 1325, 2022. Available from: <Available from: https://www.mdpi.com/2072-666X/13/8/1325 >. Accessed: Mar. 09, 2026. doi: 10.3390/mi13081325.
» https://doi.org/10.3390/mi13081325.» https://www.mdpi.com/2072-666X/13/8/1325 -
CELIK, O.; ALTUNAYDIN, S. S. A Research on Machine Learning Methods and Its Applications. Journal of Educational Technology and Online Learning, v.1, p.25-40, 2018. Available from: <Available from: https://dergipark.org.tr/en/pub/jetol/article/457046 >. Accessed: Mar. 09, 2026. doi: 10.31681\jetol.457046.
» https://doi.org/10.31681\jetol.457046.» https://dergipark.org.tr/en/pub/jetol/article/457046 -
CHAKRABORTY, A.; GOSWAMI, D. Prediction of slope stability using multiple linear regression (MLR) and artificial neural network (ANN). Arabian Journal of Geosciences, v.10, p.1-11, 2017. Available from: <Available from: https://link.springer.com/article/10.1007/s12517-017-3167-x >. Accessed: Mar. 09, 2026. doi: 10.1007/s12517-017-3167-x.
» https://doi.org/10.1007/s12517-017-3167-x.» https://link.springer.com/article/10.1007/s12517-017-3167-x -
CHALBI, S. et al. Effect of breed and non-genetic factors on body weight and average daily gains of goats in Tunisia. International Journal of Innovative Approaches in Agricultural Research, v.6, p.330-339, 2022. Available from: <Available from: https://ijiaar.penpublishing.net/makale/3524 >. Accessed: Mar. 09, 2026. doi: 10.29329/ijiaar.2022.506.4.
» https://doi.org/10.29329/ijiaar.2022.506.4.» https://ijiaar.penpublishing.net/makale/3524 -
CHO, Y. et al. A comparison of artificial neural network and classical regression models for earthquake-induced slope displacements. Soil Dynamics and Earthquake Engineering, v.152, 107024, 2022. Available from: <Available from: https://www.sciencedirect.com/science/article/abs/pii/S0267726121004462 >. Accessed: Mar. 09, 2026. doi: 10.1016/j.soildyn.2021.107024.
» https://doi.org/10.1016/j.soildyn.2021.107024.» https://www.sciencedirect.com/science/article/abs/pii/S0267726121004462 -
DAKHLAN, A. et al. Regression models and correlation analysis for predicting body weight of female Ettawa Grade goat using its body measurements. Advances in Animal and Veterinary Sciences, v.8, p.1142-1146, 2020. Available from: <Available from: https://researcherslinks.com/table_contents_detail/Advances-in-Animal-and-Veterinary-Sciences/33/1536/html >. Accessed: Mar. 09, 2026. doi: 0.17582/journal.aavs/2020/8.11.1142.1146.
» https://doi.org/0.17582/journal.aavs/2020/8.11.1142.1146.» https://researcherslinks.com/table_contents_detail/Advances-in-Animal-and-Veterinary-Sciences/33/1536/html -
DASKIRAN, I. et al. Goat production systems of Turkey: Nomadic to industrial. Small Ruminant Research, v.163, p.15-20, 2018. Available from: <Available from: https://www.sciencedirect.com/science/article/abs/pii/S0921448817302651 >. Accessed: Mar. 09, 2026. doi: 10.1016/j.smallrumres.2017.10.001.
» https://doi.org/10.1016/j.smallrumres.2017.10.001.» https://www.sciencedirect.com/science/article/abs/pii/S0921448817302651 -
DE MENEZES, L. J. J. et al. Performance and body measurements of purebred and crossbred goat kids at different ages. The Revista Brasileira de Zootecnia, v.36, p.635-642, 2007. Available from: <Available from: https://www.scielo.br/j/rbz/a/TyHfcTvBbvxCtPhkM4DX7SP/?format=pdf⟨=pt >. Accessed: Mar. 9, 2026. doi: 10.1590/S1516-35982007000300017.
» https://doi.org/10.1590/S1516-35982007000300017.» https://www.scielo.br/j/rbz/a/TyHfcTvBbvxCtPhkM4DX7SP/?format=pdf⟨=pt -
DENIZHAN, O. Comparison of different supervised learning algorithms for position analysis of the slider-crank mechanism. Alexandria Engineering Journal, v.92, p.39-49, 2024. Available from: <Available from: https://www.sciencedirect.com/science/article/pii/S1110016824001947 >. Accessed: Mar. 09, 2026. doi: 10.1016/j.aej.2024.02.055.
» https://doi.org/10.1016/j.aej.2024.02.055.» https://www.sciencedirect.com/science/article/pii/S1110016824001947 -
ELLIS, J. L. The role of mechanistic models in precision dairy nutrition and on-farm decision support. In: Proceedings of the Animal Nutrition Conference of Canada (ANCC), Virtual, p.10-14, 2021. Available from: <Available from: https://en.engormix.com/dairy-cattle/dairy-cattle-nutrition/the-role-mechanistic-models_a49556/ >. Accessed: Mar. 09, 2026.
» https://en.engormix.com/dairy-cattle/dairy-cattle-nutrition/the-role-mechanistic-models_a49556/ -
ELMABROUK, S. et al. Artificial neural network modeling for the prediction of oil production. Petroleum Science and Technology, v.32, p.1123-1130, 2014. Available from: <Available from: https://www.tandfonline.com/doi/full/10.1080/10916466.2011.605093 >. Accessed: Mar. 09, 2026. doi: 10.1080/10916466.2011.605093.
» https://doi.org/10.1080/10916466.2011.605093.» https://www.tandfonline.com/doi/full/10.1080/10916466.2011.605093 -
ERDOGAN ATAC, F. et al. Estimates of genetic parameters for direct and maternal effects on pre-weaning growth traits in Turkish Saanen kids. Animals, v.13, n.5, 940 p., 2023. Available from: <Available from: https://www.mdpi.com/2076-2615/13/5/940 >. Accessed: Mar. 09, 2026. doi: 10.3390/ani13050940.
» https://doi.org/10.3390/ani13050940.» https://www.mdpi.com/2076-2615/13/5/940 -
FENG, J.; LU, S. Performance analysis of various activation functions in artificial neural networks. Journal of Physics: Conf. Series 1237. 022030, 2019. Available from: <Available from: https://iopscience.iop.org/article/10.1088/1742-6596/1237/2/022030/pdf >. Accessed: Mar. 9, 2026. doi: 10.1088/1742-6596/1237/2/022030.
» https://doi.org/10.1088/1742-6596/1237/2/022030.» https://iopscience.iop.org/article/10.1088/1742-6596/1237/2/022030/pdf -
GHOTBALDINI, H. et al. Predicting breeding value of body weight at 6-month age using Artificial Neural Networks in Kermani sheep breed. Acta Scientiarum. Animal Sciences, v.41, e45282, p.2-9, 2019. Available from: <Available from: https://www.scielo.br/j/asas/a/rdNVvqz3hrFmpGMRnFQPWmP/?format=pdf⟨=en >. Accessed: Mar. 09, 2026. doi: 10.4025/actascianimsci.v41i1.45282.
» https://doi.org/10.4025/actascianimsci.v41i1.45282.» https://www.scielo.br/j/asas/a/rdNVvqz3hrFmpGMRnFQPWmP/?format=pdf⟨=en -
GONCALVES, M. A. et al. Prediction of weight and body condition score of dairy goats using random forest algorithm and digital imaging data. Animals, v.15, 1449, 2025. Available from: <Available from: https://www.mdpi.com/2076-2615/15/10/1449 >. Accessed: Mar. 10, 2026. doi: 10.3390/ani15101449.
» https://doi.org/10.3390/ani15101449.» https://www.mdpi.com/2076-2615/15/10/1449 -
GRITSENKO, S. et al. On-barn forecasting beef cattle production based on automated non-contact body measurement system. Animals, v.13, 611, 2023. Available from: <Available from: https://www.mdpi.com/2076-2615/13/4/611 >. Accessed: Mar. 10, 2026. doi: 10.3390/ani13040611.
» https://doi.org/10.3390/ani13040611.» https://www.mdpi.com/2076-2615/13/4/611 -
GUZEL, H. O. Prediction of freshwater harmful algal blooms in Western Lake Erie using artificial neural network modeling techniques. Master Thesis. North Dakota State University of Agriculture and Applied Science, 2018. Available from: <Available from: https://files01.core.ac.uk/download/211292236.pdf >. Accessed: Mar. 10, 2026.
» https://files01.core.ac.uk/download/211292236.pdf -
HUANG, X. et al. Machine learning aided design and prediction of environmentally friendly rubberised concrete. Sustainability, v.13, 1691, 2021. Available from: <Available from: https://www.mdpi.com/2071-1050/13/4/1691 >. Accessed: Mar. 10, 2026. doi: 10.3390/su13041691.
» https://doi.org/10.3390/su13041691.» https://www.mdpi.com/2071-1050/13/4/1691 -
IBRAHIM, A. et al. Regression model analysis for prediction of body weight from body measurements in female Batur sheep of Banjarnegara District, Indonesia. Biodiversitas Journal of Biological Diversity, v.22, p.2723-2730, 2021. Available from: <Available from: https://smujo.id/biodiv/article/view/8459/4941 >. Accessed: Mar. 10, 2026. doi: 10.13057/biodiv/d220721.
» https://doi.org/10.13057/biodiv/d220721.» https://smujo.id/biodiv/article/view/8459/4941 -
IKIKAT TUMER, E. et al. Evaluating technical efficiency of hair goat farms in Turkey: the case of Mersin Province. Tropical Animal Health and Production, v.52, 3707-3712, 2020. Available from: <Available from: https://link.springer.com/article/10.1007/s11250-020-02407-2 >. Accessed: Mar. 10, 2026. doi: 10.1007/s11250-020-02407-2.
» https://doi.org/10.1007/s11250-020-02407-2.» https://link.springer.com/article/10.1007/s11250-020-02407-2 -
IMRAN, M.; ALSUHAIBANI, S. A. A neuro-fuzzy inference model for diabetic retinopathy classification. In Intelligent Data Analysis for Biomedical Applications, c.7, p.147-172. Academic Press, 2019. Available from: <Available from: https://www.sciencedirect.com/science/chapter/edited-volume/abs/pii/B9780128155530000070 >. Accessed: Mar. 10, 2026. doi: 10.1016/B978-0-12-815553-0.00007-0.
» https://doi.org/10.1016/B978-0-12-815553-0.00007-0.» https://www.sciencedirect.com/science/chapter/edited-volume/abs/pii/B9780128155530000070 -
JAT, G. R.; DATT, M. A study on the effect of season, sex and birth type on birth weight of sirohi goat kids under semi-arid conditions. Journal of Experimental Agriculture International, v.47, p.299-304, 2025. Available from: <Available from: https://journaljeai.com/index.php/JEAI/article/view/3418 >. Accessed: Mar. 10, 2026. doi: 10.9734/jeai/2025/v47i53418.
» https://doi.org/10.9734/jeai/2025/v47i53418.» https://journaljeai.com/index.php/JEAI/article/view/3418 -
KADER ESEN, V.; ELMACI, C. The estimation of live weight from body measurements in different meat-type lambs. Journal of Agricultural Sciences, v.27, p.469-475, 2021. Available from: <Available from: https://dergipark.org.tr/en/pub/ankutbd/article/719037 >. Accessed: Mar. 10, 2026. doi: 10.15832/ankutbd.719037.
» https://doi.org/10.15832/ankutbd.719037.» https://dergipark.org.tr/en/pub/ankutbd/article/719037 -
KHORSHIDI-JALALI, M. et al. Comparison of artificial neural network and regression models for prediction of body weight in Raini Cashmere goat. Iranian Journal of Applied Animal Science, v.9, p.453-461, 2019. ISSN: 2251-631X. Available from: <Available from: https://scispace.com/pdf/comparison-of-artificial-neural-network-and-regression-famoz6vf4v.pdf >. Accessed: Mar. 10, 2026.
» https://scispace.com/pdf/comparison-of-artificial-neural-network-and-regression-famoz6vf4v.pdf -
KICHAMU, N. et al. A review on Indigenous goats of East Africa: A case for conservation and management. Biology, v.13, p.419, 2024. Available from: <Available from: https://www.mdpi.com/2079-7737/13/6/419 >. Accessed: Mar. 10, 2026. doi: 10.3390/biology13060419.
» https://doi.org/10.3390/biology13060419.» https://www.mdpi.com/2079-7737/13/6/419 -
KOLUMAN, N. et al. Improving reproduction and growth characteristics of indegenous goats in smallholding farming system. Ciência Rural, v.54, e20230028, 2024. Available from: <Available from: https://www.scielo.br/j/cr/a/98pqmmzFB89g74Q8xDzkpQs/?format=pdf⟨=en >. Accessed: Mar. 10, 2026. doi: 10.1590/0103-8478cr20230028.
» https://doi.org/10.1590/0103-8478cr20230028.» https://www.scielo.br/j/cr/a/98pqmmzFB89g74Q8xDzkpQs/?format=pdf⟨=en -
KUME, K.; HAJNO, L. Study of growth curve variations for kids 0-6 months old of Alpine goat breed in Albania. Archiva Zootechnica, v.13, p.54, 2010. Available from: <Available from: https://ibna.ro/arhiva/AZ%2013-2/AZ%2013-2_06%20Kristaq%20Kume.pdf >. Accessed: Mar. 10, 2026.
» https://ibna.ro/arhiva/AZ%2013-2/AZ%2013-2_06%20Kristaq%20Kume.pdf -
LEMONIS, M. E. et al. Ultimate axial load of rectangular concrete-filled steel tubes using multiple ANN activation functions. Steel and Composite Structures, v.42, p.459-475, 2022 Available from: <Available from: https://www.techno-press.org/content/?page=article&journal= scs&volume=42#=4&ordernum=3 >. Accessed: Mar. 10, 2026. doi: 10.12989/scs.2022.42.4.459.
» https://doi.org/10.12989/scs.2022.42.4.459.» https://www.techno-press.org/content/?page=article&journal= scs&volume=42#=4&ordernum=3 -
LORENC, A. et al. Solving product allocation problem (PAP) by using ANN and clustering. FME Transactions, v.49, p.206-213, 2021. Available from: <Available from: https://scispace.com/pdf/solving-product-allocation-problem-pap-by-using-ann-and-2e3cn7lkgi.pdf >. Accessed: Mar. 10, 2026. doi: 10.5937/fme2101206L.
» https://doi.org/10.5937/fme2101206L.» https://scispace.com/pdf/solving-product-allocation-problem-pap-by-using-ann-and-2e3cn7lkgi.pdf -
LU, X. et al. Application of multiple linear regression model and long short-term memory with compartmental model to forecast dengue cases in Selangor, Malaysia based on climate variables. Infectious Disease Modelling, v.10, 240-256, 2025. Available from: <Available from: https://www.sciencedirect.com/science/article/pii/S2468042724001222 >. Accessed: Mar. 10, 2026. doi: 10.1016/j.idm.2024.10.007.
» https://doi.org/10.1016/j.idm.2024.10.007.» https://www.sciencedirect.com/science/article/pii/S2468042724001222 -
MAARIF, M. R. et al. Artificial neural network training using structural learning with forgetting for parameter analysis of injection molding quality prediction. Information, v.13, 488, 2022. Available from: <Available from: https://www.mdpi.com/2078-2489/13/10/488 >. Accessed: Mar. 10, 2026. doi: 10.3390/info13100488.
» https://doi.org/10.3390/info13100488.» https://www.mdpi.com/2078-2489/13/10/488 -
MAKGOPA, L. F. et al. A systematic review of estimation of growth curve in goats. Tropical Animal Health and Production, v.56, n.14, 2024. Available from: <Available from: https://link.springer.com/article/10.1007/s11250-023-03857-0 >. Accessed: Mar. 10, 2026. doi: 10.1007/s11250-023-03857-0.
» https://doi.org/10.1007/s11250-023-03857-0.» https://link.springer.com/article/10.1007/s11250-023-03857-0 -
MAKOMERE, R. et al. The use of Artificial Neural Network (ANN) in dry flue gas desulphurization modelling: Levenberg‐Marquardt (LM) and Bayesian Regularization (BR) algorithm comparison. The Canadian Journal of Chemical Engineering, p.3273-3286, 2023. Available from: <Available from: https://onlinelibrary.wiley.com/doi/abs/10.1002/cjce.24715 >. Accessed: Mar. 10, 2026. doi: 10.1002/cjce.24715.
» https://doi.org/10.1002/cjce.24715.» https://onlinelibrary.wiley.com/doi/abs/10.1002/cjce.24715 -
MAKSIMOVIĆ, N. et al. Productive characteristics and body measurements of alpine goats raised under smallholder production systems in central Serbia. Biotechnology in Animal Husbandry, v.31, p.245-253, 2015. Available from: <Available from: https://r.istocar.bg.ac.rs/bitstream/handle/123456789/475/473.pdf?sequence=1&isAllowed=y >. Accessed: Mar. 10, 2026. doi: 10.2298/BAH1502245M.
» https://doi.org/10.2298/BAH1502245M.» https://r.istocar.bg.ac.rs/bitstream/handle/123456789/475/473.pdf?sequence=1&isAllowed=y -
MARKOVA, M. Foreign exchange rate forecasting by artificial neural networks. In: AIP Conference Proceedings, 2164, 060010, 2019. Available from: <Available from: https://pubs.aip.org/aip/acp/article-abstract/2164/1/060010/853997/Foreign-exchange-rate-forecasting-by-artificial?redirectedFrom=PDF >. Accessed: Mar. 10, 2026. doi: 10.1063/1.5130812.
» https://doi.org/10.1063/1.5130812.» https://pubs.aip.org/aip/acp/article-abstract/2164/1/060010/853997/Foreign-exchange-rate-forecasting-by-artificial?redirectedFrom=PDF -
MELAK, A. et al. The influence of artificial intelligence technology on the management of livestock farms. International Journal of Distributed Sensor Networks, v.2024, p.1-12, 2024. Available from: <Available from: https://onlinelibrary.wiley.com/doi/10.1155/2024/8929748 >. Accessed: Mar. 10, 2026. doi: 10.1155/2024/8929748.
» https://doi.org/10.1155/2024/8929748.» https://onlinelibrary.wiley.com/doi/10.1155/2024/8929748 -
MONTGOMERY, D. C. et al. Introduction to linear regression analysis, Fifth Edition, John Wiley & Sons, New York, p.68, 2001. Available from: <https://www.kwcsangli.in/uploads/3--Introduction_to_Linear_Regression_Analysis__5th_ed._Douglas_C._Montgomery__Elizabeth_A._Peck__and_G._.pdf>. Accessed: Mar. 10, 2026.
» https://www.kwcsangli.in/uploads/3--Introduction_to_Linear_Regression_Analysis__5th_ed._Douglas_C._Montgomery__Elizabeth_A._Peck__and_G._.pdf -
NAIR, M. R. et al. Goat as the ideal climate-resilient animal model in tropical environment: revisiting advantages over other livestock species. International Journal of Biometeorology, v.65, p.2229-2240, 2021. Available from: <Available from: https://link.springer.com/article/10.1007/s00484-021-02179-w >. Accessed: Mar. 10, 2026. doi: 10.1007/s00484-021-02179-w.
» https://doi.org/10.1007/s00484-021-02179-w.» https://link.springer.com/article/10.1007/s00484-021-02179-w -
NAVARRO, T. et al. Impact of stress on health and final weight in fattening lambs. Animals, v.10, 1274, 2020. Available from: <Available from: https://www.mdpi.com/2076-2615/10/8/1274 >. Accessed: Mar. 10, 2026. doi: 10.3390/ani10081274.
» https://doi.org/10.3390/ani10081274.» https://www.mdpi.com/2076-2615/10/8/1274 -
OBITE, C. P. et al. Multicollinearity effect in regression analysis: A feed forward artificial neural network approach. Asian Journal of Probability and Statistics, v.6, p.22-33, 2020. Available from: <Available from: https://journalajpas.com/index.php/AJPAS/article/view/120 >. Accessed: Mar. 10, 2026. doi: 10.9734/ajpas/2020/v6i130151.
» https://doi.org/10.9734/ajpas/2020/v6i130151.» https://journalajpas.com/index.php/AJPAS/article/view/120 -
PANDEY, D. S. et al. Artificial neural network based modelling approach for municipal solid waste gasification in a fluidized bed reactor. Waste management, v.58, p.202-213, 2016. Available from: <Available from: https://www.sciencedirect.com/science/article/abs/pii/S0956053X1630486X >. Accessed: Mar. 10, 2026. doi: 10.1016/j.wasman.2016.08.023.
» https://doi.org/10.1016/j.wasman.2016.08.023.» https://www.sciencedirect.com/science/article/abs/pii/S0956053X1630486X -
PATIL, S. V. et al. Prediction of recycled coarse aggregate concrete mechanical properties using multiple linear regression and artificial neural network. Journal of Engineering, Design and Technology, p.1690-1709, 2021. Available from: <Available from: https://www.emerald.com/jedt/article-abstract/21/6/1690/454420/Prediction-of-recycled-coarse-aggregate-concrete?redirectedFrom=fulltext >. Accessed: Mar. 10, 2026. doi: 10.1108/JEDT-07-2021-0373.
» https://doi.org/10.1108/JEDT-07-2021-0373.» https://www.emerald.com/jedt/article-abstract/21/6/1690/454420/Prediction-of-recycled-coarse-aggregate-concrete?redirectedFrom=fulltext -
RAJA, T. V. et al. Comparison of connectionist and multiple regression approaches for prediction of body weight of goats. Neural Computing and Applications, v. 21, p.119-124, 2012. Available from: <Available from: https://dl.acm.org/doi/10.1007/s00521-011-0637-z >. Accessed: Mar. 10, 2026. doi: 10.1007/s00521-011-0637-z.
» https://doi.org/10.1007/s00521-011-0637-z.» https://dl.acm.org/doi/10.1007/s00521-011-0637-z -
RAMOROKA, M. P. et al. Evaluation of non-genetic factors affecting birth weight of kalahari red goats in South Africa. South African Journal of Agricultural Extension, v.52, 1-16, 2024. Available from: <Available from: https://sajae.co.za/article/view/16077 >. Accessed: Mar. 10, 2026. doi: 10.17159/2413-3221/2024/v52n4a16077.
» https://doi.org/10.17159/2413-3221/2024/v52n4a16077.» https://sajae.co.za/article/view/16077 -
RIBEIRO, A. et al. Categorization of birth weight phenotypes for inclusion in genetic evaluations using a deep neural network. Journal of Animal Science, v.99, skab053, 2021. Available from: <Available from: https://pubmed.ncbi.nlm.nih.gov/33599698/ >. Accessed: Mar. 10, 2026. doi: 10.1093/jas/skab053.
» https://doi.org/10.1093/jas/skab053.» https://pubmed.ncbi.nlm.nih.gov/33599698/ -
SAHIN, O. Evaluation of some factors on birth and weaning weights in Awassi sheep by using GLM and CART analysis. Tropical Animal Health and Production, v.54, 400, 2022. Available from: <Available from: https://link.springer.com/article/10.1007/s11250-022-03405-2 >. Accessed: Mar. 10, 2026. doi: 10.1007/s11250-022-03405-2.
» https://doi.org/10.1007/s11250-022-03405-2.» https://link.springer.com/article/10.1007/s11250-022-03405-2 -
SALEHUDDIN, N. F. et al. A neural network-based model for predicting saybolt color of petroleum products. Sensors, v.22, 2796, 2-17, 2022. Available from: <Available from: https://www.mdpi.com/1424-8220/22/7/2796 >. Accessed: Mar. 10, 2026. doi: 10.3390/s22072796.
» https://doi.org/10.3390/s22072796.» https://www.mdpi.com/1424-8220/22/7/2796 -
SERT, F.; DURMUS, M. Improvement of fertility and growth characteristics of hair goats kids raised by public in Kahramanmaraş province. Turkish Journal of Agriculture-Food Science and Technology, v.13, p.391-397, 2025. Available from: <Available from: https://agrifoodscience.com/index.php/TURJAF/article/view/7207 >. Accessed: Mar. 10, 2026. doi: 10.24925/turjaf.v13i2.391-397.7207.
» https://doi.org/10.24925/turjaf.v13i2.391-397.7207.» https://agrifoodscience.com/index.php/TURJAF/article/view/7207 -
SERT, F.; DURMUS, M. Improvement of reproductive and growth characteristics of local hair goats raised in extensive system in Kahramanmaraş province. International Journal of Agriculture Environment and Food Sciences, v.8, p.868-875, 2024. Available from: <Available from: https://dergipark.org.tr/en/pub/jaefs/article/1567554 >. Accessed: Mar. 10, 2026. doi: 10.31015/jaefs.2024.4.16.
» https://doi.org/10.31015/jaefs.2024.4.16.» https://dergipark.org.tr/en/pub/jaefs/article/1567554 -
SINGH, S. G. et al. Predicting the body weight using appropriate regression model in Beetal goat kids. Theriogenology Insight, v.10, n.1, p.1-6, 2020. Available from: <Available from: https://ndpublisher.in/admin/issues/TIv10n1a.pdf >. Accessed: Mar. 10, 2026. doi: 10.30954/2277-3371.01.2020.1.
» https://doi.org/10.30954/2277-3371.01.2020.1.» https://ndpublisher.in/admin/issues/TIv10n1a.pdf -
SINSOMBOONTHONG, S. Performance comparison of new adjusted min-max with decimal scaling and statistical column normalization methods for artificial neural network classification. International Journal of Mathematics and Mathematical Sciences, p.1-9, 2022. Available from: <https://onlinelibrary.wiley.com/doi/10.1155/2022/3584406>. Accessed: Mar. 10, 2026. doi: 10.1155/2022/3584406.
» https://doi.org/10.1155/2022/3584406. -
TAHMOORESPUR, M.; AHMADI, H. A neural network model to describe weight gain of sheep from genes polymorphism, birth weight and birth type. Livestock Science, v.148, 221-226, 2012. Available from: <Available from: https://www.sciencedirect.com/science/article/abs/pii/S1871141312002181 >. Accessed: Mar. 10, 2026. doi: 10.1016/j.livsci.2012.06.008.
» https://doi.org/10.1016/j.livsci.2012.06.008.» https://www.sciencedirect.com/science/article/abs/pii/S1871141312002181 -
THIRUVENKADAN, A. K. Determination of best-fitted regression model for estimation of body weight in Kanni Adu kids under farmer’s management system. Livestock Research For Rural Development, v.17, p.1-11, 2005. Available from: <Available from: https://www.lrrd.cipav.org.co/lrrd17/7/thir17085.htm >. Accessed: Mar. 10, 2026.
» https://www.lrrd.cipav.org.co/lrrd17/7/thir17085.htm -
TOPLU, H. D. O.; ALTINEL, A. Some production traits of indigenous Hair goats bred under extensive conditions in Turkey. 1st communication: reproduction, milk yield and hair production traits of does. Arch. Tierzucht, Dummerstorf, v.51, p.498-506, 2008. Available from: <Available from: https://aab.copernicus.org/articles/51/498/2008/aab-51-498-2008.pdf >. Accessed: Mar. 10, 2026. doi: 10.5194/aab-51-498-2008.
» https://doi.org/10.5194/aab-51-498-2008.» https://aab.copernicus.org/articles/51/498/2008/aab-51-498-2008.pdf -
TYASI, T. L.; CELIK, S. Estimation of body weight from morphological measurements in Boer goats with the application of artificial neural networks and some regression models. Genetika, v.55, p.929-950, 2023. Available from: <Available from: https://doiserbia.nb.rs/Article.aspx?id=0534-00122303929T >. Accessed: Mar. 10, 2026. doi: 10.2298/GENSR2303929T.
» https://doi.org/10.2298/GENSR2303929T.» https://doiserbia.nb.rs/Article.aspx?id=0534-00122303929T -
WANG, Z. et al. Asas-nanp symposium: applications of machine learning for livestock body weight prediction from digital images. Journal of Animal Science, v.99, skab022, 2021. Available from: <Available from: https://academic.oup.com/jas/article/99/2/skab022/6149204 >. Accessed: Mar. 10, 2026. doi: 10.1093/jas/skab022.
» https://doi.org/10.1093/jas/skab022.» https://academic.oup.com/jas/article/99/2/skab022/6149204 -
WIJAYANINGRUM, V. N. et al. Optimal multi-layer perceptron parameters for early stage diabetes risk prediction. IOP Conference Series: Materials Science and Engineering, 1073, 012070, 2021. Available from: <Available from: https://iopscience.iop.org/article/10.1088/1757-899X/1073/1/012070 >. Accessed: Mar. 10, 2026. doi: 10.1088/1757-899X/1073/1/012070.
» https://doi.org/10.1088/1757-899X/1073/1/012070.» https://iopscience.iop.org/article/10.1088/1757-899X/1073/1/012070 -
WU, J.; WANG, Z. A hybrid model for water quality prediction based on an artificial neural network, wavelet transform, and long short-term memory. Water, v.14, p.610, 2022. Available from: <Available from: https://www.mdpi.com/2073-4441/14/4/610 >. Accessed: Mar. 10, 2026. doi: 10.3390/w14040610.
» https://doi.org/10.3390/w14040610.» https://www.mdpi.com/2073-4441/14/4/610 -
XEZONAKIS, V. et al. Modelling and output power estimation of a combined gas plant and a combined cycle plant using an artificial neural network approach. Journal of Engineering, 5540010, 2024. Available from: <Available from: https://onlinelibrary.wiley.com/doi/10.1155/2024/5540010 >. Accessed: Mar. 10, 2026. doi: 10.1155/2024/5540010.
» https://doi.org/10.1155/2024/5540010.» https://onlinelibrary.wiley.com/doi/10.1155/2024/5540010 -
YANG, X. et al. Machine learning-based prediction of feed conversion ratio: a feasibility study of using short-term fcr data for long-term feed conversion ratio (fcr) prediction. Animals, v.15, 1773, 2025. Available from: <Available from: https://www.mdpi.com/2076-2615/15/12/1773 >. Accessed: Mar. 10, 2026. doi: 10.3390/ani15121773.
» https://doi.org/10.3390/ani15121773.» https://www.mdpi.com/2076-2615/15/12/1773 -
YARDIMCI, M. et al. Stress responses to comparative handling procedures in sheep. Animal, v.7, p.143-150, 2013. Available from: <Available from: https://www.sciencedirect.com/science/article/pii/S1751731112001449?via%3Dihub >. Accessed: Mar. 10, 2026. doi: 10.1017/S1751731112001449.
» https://doi.org/10.1017/S1751731112001449.» https://www.sciencedirect.com/science/article/pii/S1751731112001449?via%3Dihub -
YILMAZ, O. et al. Estimation of mature live weight using some body measurements in Karya sheep. Tropical Animal Health and Production, v.45, p.397-403, 2013. Available from: <Available from: https://link.springer.com/article/10.1007/s11250-012-0229-7 >. Accessed: Mar. 10, 2026. doi: 10.1007/s11250-012-0229-7.
» https://doi.org/10.1007/s11250-012-0229-7.» https://link.springer.com/article/10.1007/s11250-012-0229-7 -
YOGITHA, R.; MATHIVANAN, G. Performance analysis of transfer functions in an artificial neural network. In: International Conference on Communication and Signal Processing (ICCSP), p.0393-0397, Chennai, India, 2018. Available from: <Available from: https://ieeexplore.ieee.org/document/8524387 >. Accessed: Mar. 10, 2026. doi:10.1109/ICCSP.2018.8524387.
» https://doi.org/10.1109/ICCSP.2018.8524387» https://ieeexplore.ieee.org/document/8524387 -
YUE, Z. et al. Bayesian regularisation BP Neural Network model for predicting oil-gas drilling cost. In: Proceedings of the 2011 International Conference on Business Management and Electronic Information, p.483-487, Guangzhou, China, 2011. Available from: <Available from: https://ieeexplore.ieee.org/document/5917952 >. Accessed: Mar. 10, 2026. doi: 10.1109/ICBMEI.2011.5917952.
» https://doi.org/10.1109/ICBMEI.2011.5917952.» https://ieeexplore.ieee.org/document/5917952 -
ZARE ABYANEH, H. Evaluation of multivariate linear regression and artificial neural networks in prediction of water quality parameters. Journal of Environmental Health Science and Engineering, v.12, p.1-8, 2014. Available from: <Available from: https://link.springer.com/article/10.1186/2052-336X-12-40 >. Accessed: Mar. 10, 2026. doi: 10.1186/2052-336X-12-40.
» https://doi.org/10.1186/2052-336X-12-40.» https://link.springer.com/article/10.1186/2052-336X-12-40 -
ZHANG, K. et al. Artificial neural network modeling for steam ejector design. Applied Thermal Engineering, v.204, 117939, 2022. Available from: <Available from: https://www.sciencedirect.com/science/article/abs/pii/S1359431121013600 >. Accessed: Mar. 10, 2026. doi: 10.1016/j.applthermaleng.2021.117939.
» https://doi.org/10.1016/j.applthermaleng.2021.117939.» https://www.sciencedirect.com/science/article/abs/pii/S1359431121013600
-
CR-2025-0308.R1
-
BIOETHICS AND BIOSECURITY COMMITTEE APPROVAL
Cukurova University Animal Ethics Committee approved all experimental procedures for the present study (Protocol No. 2022/8).
-
DATA AVAILABILITY STATEMENT
The raw data is available directly with the author.
-
DECLARATION OF USE OF ARTIFICIAL INTELLIGENCE
No artificial intelligence was used to prepare this article.
Edited by
-
ASSOCIATE EDITOR:
Rudi Weiblen (0000-0002-1737-9817)
-
SCIENTIFIC EDITOR:
Rudiger Daniel Ollhoff (0000-0002-7972-9472)
The raw data is available directly with the author.