 Quality of wood and bark of Eucalyptus clones cultivated for medium density fiberboard production
ABSTRACT
Background: Although bark is often considered undesirable in industrial applications, it is an integral part of the tree and is always present. The objective of this study was to evaluate the quality of wood and bark of Eucalyptus clones cultivated for medium density fiberboard production.
Results: Bark proportion ranged from 8.22% to 10.25%, and heartwood from 26.98% to 36.16%. The basic density of wood ranged from 455 to 502 kg·m⁻³, wood with bark from 447 to 483 kg·m⁻³, and bark from 342 to 368 kg·m⁻³. Bark showed higher extractive (8.59% to 13.21%) and holocellulose (67.70% to 71.43%) contents and lower lignin content (18.20% to 19.99%) compared to wood. pH values ranged from 4.40 to 4.75, being higher in bark. Ash content was significantly higher in bark (1.64% to 2.21%) than in wood (0.18% to 0.29%). The inclusion of bark in wood did not significantly affect density, pH, or chemical composition, indicating its technical feasibility for MDF panel production.
Conclusion: The inclusion of bark in the wood of Eucalyptus clones did not cause significant changes in basic density, chemical composition, pH, or ash content, confirming its technical feasibility for MDF panel production. The most affected properties due to the presence of bark were extractive and ash contents.
Keywords:
lignocellulosic materials; engineered wood panels; residue utilization; biomass quality
INTRODUCTION
Bark covers the entire outer surface of trees and plays essential roles in transporting organic sap, storing nutrients, and protecting wood from environmental hazards (Giannotas et al., 2021). In the wood processing industry, bark is considered less valuable, and trees with lower bark proportions are preferred, making bark content a key variable in tree breeding due to its influence on usable wood yield.
Bark's low basic density and high extractive content negatively affect industrial operations by increasing fines during chipping, occupying excessive space in digesters, and, as reported by Tripathi et al. (2020), reducing pulp yield while raising chemical consumption. High extractive content also hinders resin curing in wood-based panels (Minini et al., 2017). Furthermore, ash, dirt, and sand in bark pose additional challenges for the pulp and paper industry.
In 2022, Brazil’s industrial sector consumed 182.0 million m³ of Eucalyptus wood, with bark accounting for approximately 6-18% of this volume (IBÁ, 2023). Although often removed as waste, bark can be repurposed as fuel, a source of fibers and chemical compounds, soil amendments, tannin extraction for adhesives or as feedstock for biorefineries (Dou et al., 2023; Pandey and Pant, 2023; Demo et al., 2024; Niu et al., 2024; Puri et al., 2024).
The base and top of trees typically have higher bark proportions and thicker layers (Ramalho et al., 2019; Rocha et al., 2024). Wood from commercial Eucalyptus species has higher basic density (400-600 kg·m⁻³) than bark (240-400 kg·m⁻³), due to greater porosity in inactive bark and lower fiber content in active layers (Foelkel, 2005). Although bark density also varies along the stem, it remains less studied.
To improve bark utilization, detailed chemical analysis is crucial (Sartori et al., 2022). pH, though rarely analyzed, significantly affects product quality in industries using bark, such as wood panels and charcoal. Bark also has high ash content (Supriyadi et al., 2025), which is associated with pH and affects adhesive curing in reconstituted panels.
Bark should be valued for two main reasons: its abundance as a by-product and its structural and chemical diversity, enabling its use in ethanol production, decorative applications, energy generation, and biorefineries (Neiva et al., 2018). MDF panels have already been produced using wood-bark mixtures, if logs are cleaned beforehand. Even with bark, high-quality panels can be manufactured (Gößwald et al., 2021), enhancing raw material efficiency and industrial productivity. However, understanding bark's effects on processing and product quality is essential.
Recent technological and production advances in the wood-based panel industry, driven by the need for sustainability and raw material optimization, have increased interest in bark use. Rising material costs have made bark inclusion a promising alternative for MDF production, with potential economic, industrial, and societal benefits (Soratto et al., 2013).
Understanding bark’s role in wood quality is critical for maximizing resource use in engineered wood products like MDF. While some studies have addressed bark composition and bark-wood blends for pulping or energy, few have evaluated their effects on critical properties for MDF production, such as basic density, chemical composition, pH, and ash content. This study is novel in offering a detailed assessment of these properties in wood, bark, and their mixtures across commercial Eucalyptus clones, sampled along the stem. This comprehensive approach supports optimized bark utilization in industry and contributes new data for the sustainable, cost-effective use of forest biomass.
Although bark is often considered undesirable in industrial applications, it is an integral and unavoidable component of the tree. However, the extent to which wood-bark mixtures differ from wood alone in properties relevant to MDF manufacture remains insufficiently characterized. Based on the hypothesis that incorporating typical proportions of bark does not cause significant changes in chemical and physical properties that affect MDF manufacture and quality, the objective of this study was to evaluate the quality of wood and bark of Eucalyptus clones cultivated for medium-density fiberboard production.
MATERIAL AND METHODS
Study area and sampling
Bark, wood, and wood-bark mixture samples from four Eucalyptus clones (Table 1) were analyzed. These included two hybrids of E. urophylla x E. grandis (C1 and C2), one E. grandis clone (C3), and one E. urophylla clone (C4), all harvested at six years of age from commercial plantations in São Paulo, Brazil, belonging to a company producing MDF panels.
Between 2016 and 2022, the municipalities of Lençóis Paulista (C1) and Agudos (C2, C3, and C4) recorded average temperatures of 21.5 °C and 22.2 °C, and annual precipitation of 1485 mm and 1411 mm, respectively. According to the Köppen climate classification, both regions fall under the Cfa category. Planting was carried out at a spacing of 3.00 x 1.90 meters for clones C1, C2, and C3, and 3.00 x 2.00 meters for clone C4. All stands were managed under similar silvicultural practices.
Five trees per clone were sampled, all within the average diameter established by the partner company’s most recent forest inventory, excluding the first two border rows in the plots. A minimum stem diameter of 5 cm was used to define the tree’s commercial tree height. Although this average diameter is small, it is typical for Eucalyptus species cultivated for the Brazilian forest-based industries.
From each tree, 3.5 cm-thick disks were collected from five stem positions along the commercial height: 0% (base), 25%, 50%, 75%, and 100%. Additionally, a disk was collected at diameter at breast height (DBH), located 1.30 m above ground level (Figure 1). Bark was carefully separated from the disks using a metal knife for analysis, where they would be used individually.
The evaluated variables were analyzed in three sample types: bark only (B), wood with bark (WB), and wood only (W).
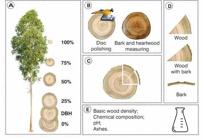
A) Sampling of disks at the base-top position; B) Analysis of the proportion of bark and heartwood in the collected discs; C) Removal of bark, wood with bark and wood samples from the collected discs; D) Samples evaluated in the study; E) Technological analyses conducted on the three types of analyzed samples.
Determination of bark and heartwood proportions, and sample preparation
Disks from all sampled positions were used to determine bark and heartwood proportions. Each disk was sanded using grit sizes 50, 80, and 120 grit sandpaper to enhance visibility of internal regions, with the aid of an aluminum orbital sander (Raimann, model RTS1). Color variation among bark, sapwood, and heartwood was used for assessment, and water was sprayed to improve contrast, particularly to highlight the heartwood region. Perpendicular lines were drawn through the pith, encompassing the entire disk diameter, to estimate the area of each section (Rocha et al., 2024). For this analysis, each disk was considered as an ideal circle. The total circular area of the disk was calculated, as well as the area without bark and the area of heartwood only. Heartwood proportion was calculated by dividing the heartwood area by the total disk area (including bark) and expressing the result as a percentage. The bark ratio was the difference between the total disk area with and without bark.
Two 45° wedges were removed from each disk at six different heights to assess basic density, main chemical components, pH, and ash content. One wedge contained both wood and bark, while the other had only wood, with the bark from this second wedge removed for separate analysis (Figure 1). Wedges were selected to avoid areas with knots, cracks, or tension wood. Although the proportion of bark and wood in each disk was known, subsequent analyses were performed on the mixed wood-bark samples to better reflect their natural condition and assess component interactions, as well as to ensure sufficient material for all tests.
Physical and chemical analyses
Basic density was determined following an adaptation of ASTM D2395-17 (ASTM, 2017). Samples were saturated in water until reaching constant weight (less than 0.1% difference between weighings conducted 24 hours apart). Once the samples were saturated, their volume was then measured on a balance, following Archimedes’ Principle. Afterward, the samples were oven-dried until they reached a constant mass.
For chemical analyses (extractives, lignin, pH, and ash), the samples were ground in a knife mill and then sieved until reaching a particle size between 40 and 60 mesh, as per the TAPPI T 264 cm-97 (1997) standard. The classified sawdust was taken to the Soxhlet to determine the total extractive content. Solubility was performed in toluene and alcohol (2:1 ratio) for 5 hours, then in alcohol for 4 hours, and finally in hot water for 1 hour, according to TAPPI T204 cm-07 (2007) standard.
Lignin content was determined using the Klason method, following Gomide and Demuner (1986). This method involves hydrolysis of wood samples with concentrated sulfuric acid (72%) under controlled temperature, followed by acid dilution and a second hydrolysis with heating. The insoluble lignin residue was then filtered, washed with distilled water, oven-dried to constant weight, and weighed. The lignin content was expressed as the percentage of residue in relation to the initial dry mass. Holocellulose content was estimated by subtracting the combined extractive and lignin contents from the total mass.
To determine pH, 5 g of sawdust was added to 150 mL of distilled water and refluxed for 60 minutes using a Soxhlet apparatus. After cooling to room temperature (25 °C), 50 mL of the extract was used for pH measurement with a digital pH meter calibrated with pH 4 and 7 buffer solutions, adapted from ASTM E70-07 (2015).
Ash content was determined by incinerating samples in porcelain crucibles in a muffle furnace at 600 °C ±10 °C. The ash residue was weighed, and the ash content was calculated as the ratio of the ash mass to the oven-dried sample mass, according to ASTM D1762-84 (ASTM, 2021).
Data analysis
The data were analyzed using RStudio software, version 4.0.2 (R Core Team, 2020). A completely randomized design (CRD) was adopted, with the three sample types (bark, wood with bark, and wood only) considered as the sources of variation and individual trees treated as replicates. Normality of the data was assessed using the Shapiro-Wilk test, and homogeneity of variances was evaluated using Levene’s test.
One-way analysis of variance (ANOVA) was applied, followed by Tukey’s honestly significant difference (HSD) test to identify significant differences among means. All statistical tests were performed at a 5% significance level. The range of variation in each property was calculated as the absolute difference between the maximum and minimum values observed in each comparison.
RESULTS
Differences in bark proportion among clones were minimal, ranging from 8.22% (C1) to 10.25% (C3), resulting in only slight variations across sampling positions relative to the overall stem average, except at the 100% height position, which consistently showed the greatest deviation across all clones (Figure 2).

Variation along the stem of bark and heartwood proportion of Eucalyptus clones. Average values followed by standard deviation in parentheses.
Bark content was consistently higher at both the base and top of the stem, displaying a similar vertical distribution pattern among all clones. In general, the bark proportion decreased from the base to 50% of the commercial height, followed by an increase toward the top (100%).
Heartwood proportion varied from 26.98% (C4) to 36.16% (C3), indicating a 10% difference among clones and highlighting the substantial presence of sapwood. All clones exhibited heartwood up to 75% of the commercial height, although in smaller quantities in upper stem sections. The 50% height position had heartwood proportions closest to the overall stem average for all clones.
Regarding vertical heartwood distribution, clones C1 and C2 exhibited higher heartwood content at the base, with a slight decline up to 25%, followed by a more pronounced decrease toward the top. In contrast, C3 and C4 showed an increase from the base to diameter at breast height (DBH), after which C4 declined toward the top, while C3 increased up to 25%, followed by a gradual reduction up to 100%.
Clone C1 exhibited the largest DBH, while C4 had the smallest (Table 1), which may have contributed to the lower heartwood proportion observed in C4. Clones with thicker bark, as reported in Table 1, also exhibited greater average bark proportions in the stem. The increased bark content at the top of the stem does not necessarily indicate thicker bark, as it may also reflect the natural reduction in stem diameter at higher positions.
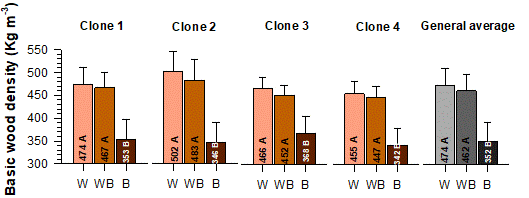
All clones, as well as the overall average, showed no statistically significant difference in basic density between wood (W) and wood with bark (WB). However, the basic density of bark (B) was consistently lower and significantly different from the other sample types, as confirmed by the statistical analysis (Figure 3).
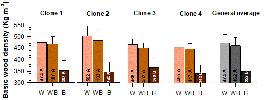
Basic wood density of the samples by clone and the overall average of the Eucalyptus clones.
W: basic density of the wood (Kg m-3); WB: basic density of the wood with bark (Kg m-3); B: basic density of the bark (Kg m-3). Error bars correspond to the standard deviation. Means followed by the same uppercase letter per clone do not have significant differences according to Tukey's test (p ≥ 0.05).
The four clones exhibited distinct basic densities for wood (W), ranging from 455 kg·m⁻³ in C4 to 502 kg·m⁻³ in C2, and for wood with bark (WB), from 447 kg·m⁻³ (C4) to 483 kg·m⁻³ (C2). This indicates that the inclusion of bark resulted in a narrower variation range compared to W alone. Clones C1 and C2 presented higher WB densities relative to the others, and a positive correlation was observed between W and WB densities, clones with higher wood density also tended to have higher WB density.
For bark (B), basic density ranged from 342 kg·m⁻³ (C4) to 368 kg·m⁻³ (C3), a 26 kg·m⁻³ difference among clones. The inclusion of bark in the samples tended to reduce density variation across clones. Interestingly, clone C2, identified as having the highest W density, showed a marked drop when bark was added, becoming one of the clones with the lowest WB density.
Although some of these differences were not statistically significant, the observed variations in basic density (kg·m⁻³) may impact industrial processes where consistent raw material quality is critical (Table 2). The inclusion of bark had little influence on the densities of clones C1 and C3 but resulted in a notable increase of 51 kg·m⁻³ in clone C4. The density gap between bark and the other materials was substantial, ranging from 121 kg·m⁻³ (C3) to 181 kg·m⁻³ (C2) compared to W, and from 100 kg·m⁻³ (C3) to 156 kg·m⁻³ (C2) compared to WB. As expected, the difference between W and B was greater than between WB and B.
The vertical variation in basic density from base to top was similar for W and WB, except in clone C2, which displayed distinct behavior in certain positions and in saturation time. Due to its higher permeability, only B samples reached saturation in a shorter period.
On average, clones showed a decline in basic density from the base to diameter at breast height (DBH), followed by an increase up to 75% of commercial height, and then a decrease toward the top (100%). The highest densities occurred at 75%, 50%, and 100% of the stem for W, WB, and B, respectively. The 25% position was closest to the overall average for WB and B, while for W, the 100% height position was the most representative of the clone average.
Regarding bark density, the overall average showed a consistent upward trend from base to top. Across all positions, W density remained higher than WB density (Figure 4).
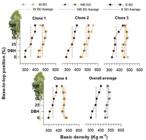
Variation in the basic wood density of Eucalyptus clones along the stem and overall average.
BD W: basic wood density (Kg m-3); BD WB: basic density of wood with bark (Kg m-3); BD B: basic density of the bark (Kg m-3). .
The basic density of bark (B) was consistently higher in the apical regions (75% and 100%) of the stem. This pattern was also observed for wood (W) and wood with bark (WB), resulting in denser material in the upper half of the stem (50% to 100%). The lowest densities were recorded in the basal regions (base and DBH) for all three sample types, except for clones C1 and C4, which showed lower W density at the 100% height position. In general, the difference in basic density between W and B was smaller in the upper regions of the stem for all clones, except C2.
Regarding chemical analyses, there were no statistically significant differences in extractives, lignin, and holocellulose content between W and WB samples, based on the overall average across clones. In contrast, the B sample differed significantly in all analyzed chemical components when compared to W and WB.
On average, the bark (B) samples exhibited higher extractive and holocellulose contents and lower lignin levels than both W and WB samples (Figure 5). These findings reinforce the distinct chemical nature of bark, which may influence processing and product quality in industrial applications such as fiberboard manufacturing.

Chemical composition of the samples by clone and the overall average of the Eucalyptus clones. W: wood samples; WB: wood with bark samples; B: bark samples. Means of each variable followed by the same uppercase letter, per clone, do not differ significantly according to Tukey's test (p ≥ 0.05).
When analyzed individually, each clone showed no significant difference in extractive content between the wood (W) and wood with bark (WB) samples. However, the bark (B) samples consistently differed from W and WB, except for clone C4, where B and WB presented similar extractive levels. Extractive content in W ranged from 4.43% (C4) to 4.75% (C1), a small variation of 0.32% among clones. In WB, the extractive content ranged from 4.89% (C2) to 5.75% (C4), with a 0.86% difference. In contrast, the B samples showed a wider range, from 8.59% (C4) to 13.21% (C2), a 4.62% difference, highlighting greater variability. Across all clones, B consistently exhibited the highest extractive content, while W had the lowest.
For lignin content, a similar pattern was observed. No significant differences were found between W and WB within each clone, whereas B always showed significantly lower lignin content. In W, lignin ranged from 26.61% (C2) to 28.43% (C4), a 1.82% difference. WB values ranged from 26.43% (C2) to 29.82% (C1), increasing the inter-clone variation to 3.39%. B samples ranged from 18.20% (C1) to 19.99% (C4), a difference of 1.79%.
Holocellulose content showed more pronounced inter-clone variation. Most clones had the highest holocellulose content in the B sample, except for C2. No consistent trend was observed for the sample with the lowest holocellulose content; however, an inverse relationship between extractives and holocellulose was noted, higher extractive levels corresponded to lower holocellulose. For W, values ranged from 66.86% (C1) to 68.81% (C2), a 1.95% difference. WB values ranged from 65.24% (C1) to 68.68% (C2), with a 3.44% difference. In B, the holocellulose content ranged from 67.70% (C2) to 71.43% (C4), a 3.63% variation. Clones with higher contents of extractives, lignin, or holocellulose in W did not necessarily exhibit the same trend in WB or B.
As observed for basic density, chemical component differences were not only statistically significant but also varied in percentage terms (Table 3). On average, the addition of bark to W (creating the WB sample) altered the chemical properties by less than 7%. The most substantial changes occurred when comparing B to the other two sample types, particularly in extractive and lignin contents.
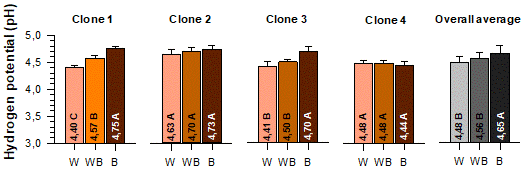
Regarding pH, no significant difference was observed between W and WB, based on the overall clone average. However, B samples consistently differed from the others. In both the overall and individual clone comparisons, W samples exhibited the lowest pH values, while B samples had the highest, except in clone C4, where W and WB showed the lowest pH values. Across all clones, WB pH values consistently fell between those of W and B (Figure 6).

Hydrogen potential (pH) of samples by clone and the overall mean of Eucalyptus clones. W: pH of wood; WB: pH of wood with bark; B: pH of bark. Error bars correspond to the standard deviation. Means followed by the same uppercase letter per clone do not have significant differences by Tukey's test (p ≥ 0.05).
Among the four clones, only C1 showed a statistically significant difference in pH across all three sample types. Clones C2 and C4 exhibited identical average pH values among the samples, while C3 mirrored the general behavior observed in the overall clone average.
The pH of W samples ranged from 4.40 (C1) to 4.63 (C2), a variation of 0.23 units among clones. For WB samples, pH ranged from 4.48 (C4) to 4.70 (C2), a 0.22-unit difference. The B samples showed the widest range, from 4.44 (C4) to 4.75 (C1), with a 0.31-unit difference among clones.
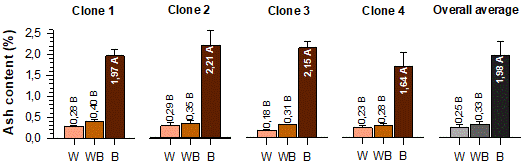
Regarding ash content, neither the overall average nor individual clones showed statistically significant differences between W and WB samples. However, B samples consistently presented significantly higher ash content in all clones. In absolute values, W samples always exhibited the lowest ash content, while WB samples showed intermediate values, closer to those of W (Figure 7).
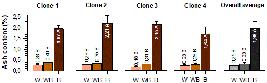
Ash content of samples by clone and the overall mean of Eucalyptus clones. W: ash content of wood (%); WB: ash content of wood with bark (%); B: ash content of bark (%). Error bars correspond to the standard deviation. Means followed by the same uppercase letter per clone do not have significant differences by Tukey's test (p ≥ 0.05).
The ash content in W ranged from 0.18% (C3) to 0.29% (C2), a difference of 0.10%. In WB, values ranged from 0.28% (C4) to 0.40% (C1), a difference of 0.12%. For B, ash content varied from 1.64% (C4) to 2.21% (C2), with a substantial 0.57% difference among clones. These results confirm that bark contributes significantly to increasing ash content in composite wood-bark materials.
The overall average pH difference between W and B samples was 0.52 units. When bark was added to wood (WB), the pH difference relative to W alone was smaller, at 0.48 units. For ash content, the difference between W and WB samples was 0.30%. In contrast, the difference between W and B was notably larger for ash content, highlighting a significant disparity in this property when measured in wood alone versus bark (Table 4).
DISCUSSION
The consistent absence of significant differences between wood (W) and wood with bark (WB) in most of the variables evaluated reinforces the reproducibility of the results and the stability of the experimental design. The use of multiple comparisons allowed the identification of subtle but significant trends, such as the lower density and higher extractive content in bark (B), providing quantitative support for the technological interpretations discussed below.
The average bark proportion in the evaluated clones, ranging from 8% to 10% of stem volume, is consistent with values reported for Eucalyptus species of similar age (Rocha et al., 2024; Santos et al., 2024). While often regarded as undesirable in industrial processing, bark is relevant to the wood supply chain and may be used for energy generation or left on-site, depending on the harvesting system. In MDF panel production, the use of wood with bark (WB) eliminates the debarking step and improves raw material efficiency. The clones assessed were cultivated specifically for MDF manufacturing, a sector challenged by raw material scarcity and elevated costs. Under the conditions tested, bark inclusion did not compromise panel quality. However, the threshold of bark content compatible with performance requirements remains uncertain and is influenced by factors such as panel density, surface characteristics, pH, mechanical properties, and fiber bonding.
Despite potential operational challenges, such as increased fines, bark clumping during chipping and classification, and chip screen clogging (Foelkel, 2005), the inclusion of bark may be justified by improvements in raw material efficiency, process streamlining, and cost reduction, particularly when product quality remains unaffected.
Supporting this, Soratto et al. (2013) observed that incorporating bark in Eucalyptus particleboards did not significantly impact physical or mechanical properties, except for increased water absorption and thickness swelling. These findings highlight the potential for bark to be effectively utilized in panel manufacturing without compromising product performance.
A similar vertical pattern in bark proportion along the stem, close to the overall average, was reported by Ramalho et al. (2019) and Rocha et al. (2024). While positional differences in bark content are not extreme, they can range from 8% to 12% in sections with lower bark presence and up to 20% to 25% in regions with higher proportions, especially in younger Eucalyptus trees (Foelkel, 2005). The greatest deviations from the average were observed in the apical regions, where the relative bark proportion is higher due to the natural tapering of the stem.
In this study, bark distribution exhibited a consistent pattern across all clones, with higher proportions at the stem base, a decrease toward the middle, and a subsequent increase at the top. This trend aligns with findings from previous studies on young Eucalyptus trees (Ramalho et al., 2019; Rocha et al., 2024).
The elevated bark content at the base is associated with the accumulation of dead phloem between successive periderm layers, an anatomical adaptation enhancing protection against environmental stress. In contrast, the apical region's higher bark proportion is linked to reduced stem diameter, absence of heartwood, and the physiological demand for efficient upward transport of organic sap. The mid-trunk region, by comparison, shows a more balanced bark-to-wood ratio, reflecting a functional equilibrium between transport capacity and the quantity of active living bark (Foelkel, 2005).
Heartwood proportion decreased from the base to the top of the stem, reflecting the progressive dominance of newly formed wood layers toward the upper regions. This pattern results in a higher concentration of juvenile wood at the top, whereas heartwood, associated with tree maturity, predominates in the older, basal portions of the stem.
In the present study, the heartwood content ranged from 26.98% to 36.16%, in agreement with the values reported for the same clones grown in different regions (Almeida et al., 2022; Câmara et al., 2023). The 50% height position yielded heartwood proportions closest to the whole-tree average, a trend also observed in Eucalyptus urophylla at age seven (Rocha et al., 2024). For the genetic materials evaluated at six years, heartwood formation extended up to 75% of commercial height, corroborating findings by Câmara et al.(2023) and Rocha et al. (2024).
Heartwood proportion also tends to be higher in clones with greater volumetric productivity and larger diameters at breast height, as seen in clones C1 and C3. This is because as tree diameter increases, the area composed of heartwood expands proportionally.
The moderate bark proportion (8-10%) observed indicates a balance between residue utilization and the technological stability of the material. Within this range, bark inclusion does not compromise performance and reduces industrial steps such as debarking. Bark contents below 20% maintain physical and mechanical properties within acceptable standards, provided that pressing conditions and adhesive curing are properly adjusted (Morandini et al., 2025). Therefore, the partial utilization of bark represents a sustainable and economically advantageous alternative for the wood panel industry.
In Eucalyptus wood, the heartwood region typically exhibits higher extractive content and a greater occurrence of vessel obstructions (e.g., tyloses) (Câmara et al., 2023; Santos et al., 2021), which can impair pressing and fiber separation during MDF manufacturing. Conversely, sapwood presents higher basic density (Santos et al., 2021), directly affecting the panel’s compression ratio.
Although a positive correlation between bark thickness and bark proportion was observed, this relationship is not always consistent. For example, Ramalho et al. (2019) reported that increased spacing in E. urophylla x E. grandis at age five resulted in thicker bark but a lower bark proportion. Bark thickness tends to decrease from the base to the top of the tree, whereas bark proportion is often higher at both extremities, since it is calculated relative to stem diameter.
Wood basic density (W) was consistently higher than bark density (B), corroborating findings by Jesus et al. (2019) in an E. grandis x E. urophylla clone at eight years, and Almeida et al. (2022) across multiple Eucalyptus clones of similar age. This disparity is primarily due to bark’s higher porosity and lower fiber content, especially within the inner living layers responsible for extractive storage and sap conduction. These tissues lack the thick secondary cell walls characteristic of xylem, which provides mechanical support to the tree (Foelkel, 2005). Moreover, inner bark comprises substantial primary tissues and sieve elements, typical of juvenile trees.
The higher basic density observed in wood (W) compared to wood with bark (WB) is attributed to the presence of bark (B), which tends to reduce overall density. In the evaluated clones, bark constituted up to 10% of the stem volume, resulting in an approximate 2.5% decrease in basic density when bark was included. Data on bark density remain limited, with previous studies reporting values between 290 and 340 kg·m⁻³ (Rocha et al., 2018; Jesus et al., 2019; Almeida et al., 2022). The WB density values found in this study fell within the typical range for Eucalyptus wood (400-600 kg·m⁻³) (Foelkel, 2005). Thus, although bark exhibits lower basic density than wood, its proportion in the stem was insufficient to significantly reduce the overall basic density of the WB material.
The similarity between the basic densities of wood (W) and wood with bark (WB) reinforces that the moderate addition of bark does not significantly affect panel compaction or its mechanical behavior. This maintains industrial feasibility by preventing increases in mass and energy consumption during processing. The granulometric control of bark particles can optimize absorption and internal bonding properties (Gößwald et al., 2024), indicating that the balanced use of WB is technically promising for MDF production.
The incorporation of bark (B) into wood (W) for industrial use can improve operational efficiency by reducing time, costs, and labor, provided it does not impair product quality. In MDF panel production, where the ideal basic density of wood ranges from 300 to 500 kg·m⁻³ (Maloney, 1989), the WB densities observed in this study were within the acceptable range and similar to W. Likewise, Soratto et al. (2013) found no significant differences in panel density with up to 24% bark inclusion.
The proportional relationship between the basic density of W and WB is explained by the greater volumetric presence of W in the composite wedge samples. Thus, clones with denser W also resulted in denser WB. However, this trend did not extend to B alone, clones with higher W density did not necessarily produce bark with higher density. This observation is attributed to the distinct anatomical structures of wood and bark tissues.
The base-to-top variation in basic density of wood with bark (WB) mirrored that of wood alone (W), a pattern typical in Eucalyptus species characterized by higher values at the base, a decline at breast height (DBH), and variable trends toward the apex (Rocha et al., 2024). However, in some clones, the basal position did not exhibit the highest W density. Bark (B) displayed a distinct trend, with few studies addressing its basic density variation along the stem.
In this study, both clone-specific and overall data indicated a consistent increase in bark density from base to apex. Elevated basic density values were observed in the upper half of the stem (50-100%) for W, WB, and B, reflecting the structural demands of these regions to support the canopy and withstand mechanical stress from wind, leading to localized densification of tissues.
Although B exhibited a distinct chemical profile compared to W, with significant differences in extractive, lignin, and holocellulose contents, its limited proportion in the stem (8-10%) was insufficient to significantly alter the chemical composition of WB. These results further support the industrial feasibility of using bark together with wood, eliminating the debarking stage in certain processing contexts.
Bark (B) exhibits high levels of extractives and holocellulose, as previously reported for Eucalyptus species and E. globulus (Miranda et al., 2012). These compounds are primarily associated with bark’s defensive role against biotic stress. This chemical composition is accompanied by reduced lignin content, which also differs structurally from wood lignin due to its lower methoxyl group concentration (Foelkel, 2005).
Clones exhibiting higher levels of extractives, lignin, or holocellulose in wood (W) did not necessarily display similar trends in wood with bark (WB) or bark (B), underscoring variability among stem components. The absence of significant chemical differences between W and WB, alongside the minimal influence of bark inclusion, supports the industrial use of WB from these clones in engineered wood panel production.
The chemical stability observed in WB suggests that the bark fraction was insufficient to significantly alter the lignin, extractives, and holocellulose contents. This consistency is essential to maintain adhesion and panel stability, as excessive chemical variations can interfere with resin curing. Minor chemical changes, when properly controlled, do not impair industrial performance and can be compensated for by pre-extraction treatments (Shirosaki et al., 2022; Morandini et al., 2025).
The optimal concentration of wood chemical constituents for MDF manufacturing remains undefined. Increased lignin content may improve particle bonding, whereas higher extractives enhance dimensional stability but potentially impair adhesive effectiveness. Holocellulose, being hygroscopic, influences moisture uptake and consequently panel durability.
The overall pH values of W and WB were similar among clones, reinforcing that the bark content (8-10%) was insufficient to significantly alter the chemical balance of the sample. All three sample types exhibited acidic pH values, which are typical for Eucalyptus species (Iwakiri, 2021).
Wood pH is expected to be higher than bark pH due to active cambial divisions between wood and inner bark (Minini et al., 2017). However, in this study, most clones exhibited more acidic wood compared to bark, a pattern also observed by Minini et al. (2017) and possibly influenced by genetic origin and tree age. The higher extractive content in bark may contribute to its elevated pH. Consequently, inclusion of bark in wood with bark (WB) slightly increased the composite material’s pH, consistent with previous reports.
The pH values obtained align with ranges typically reported for Eucalyptus species. Protázio et al. (2023) reported similar wood pH values for the same species at six years, while Minini et al. (2017) recorded pH ranges of 4.46-4.86 for WB and 4.27-4.96 for bark, closely matching the averages found herein.
All sample types presented pH values within the expected range for wood from 3.0 to 6.0 (Souza et al., 2017) and the optimal range for MDF production, from 3.0 to 5.5 (Kelly, 1977). No significant pH differences were observed between wood (W) and wood with bark (WB), indicating that both materials are suitable for panel manufacturing. This compatibility may contribute to reduced processing time, cost, and labor. Extremely low pH can lead to premature resin curing, while higher pH values require increased catalyst levels to ensure proper bonding (Iwakiri, 2021).
The proportion of bark (B) in the evaluated clones was insufficient to significantly alter the ash content of wood (W), as no statistically significant differences were observed between W and wood with bark (WB). However, bark alone exhibited higher ash content (Sartori et al., 2022), attributed to elevated levels of extractives and inorganic compounds involved in plant defense mechanisms.
For all three sample types analyzed in this study, ash content followed the general trend reported for commercial Eucalyptus, not exceeding 1% for W (Minini et al., 2017; Santos et al., 2024). These discrepancies are attributed to differences in age, genetic material, provenance, fertilization, and soil conditions, as ash content tends to increase with tree age.
The small difference in ash content between W and WB, combined with the absence of statistical significance, adds further support for using WB in industrial applications. For instance, in the production of high-quality charcoal, ash content should not exceed 1.50% (São Paulo, 2015). In the case of reconstituted wood panel production, an ash content of up to 0.50% is considered acceptable, as high levels of inorganic compounds can influence panel pH, thereby affecting glue line cohesion and the mechanical performance of the final product (Iwakiri, 2021).
The ash contents observed in the clones studied in this work fall within the acceptable ranges for these industrial uses, reinforcing the viability of utilizing WB as a raw material in both charcoal and panel production processes.
The slight increase in pH and the small rise in ash content do not compromise resin curing or glue line cohesion. Moreover, minerals present in the ash may act as beneficial catalysts in polymerization reactions (Cunha et al., 2024). Thus, the inclusion of bark in moderate proportions proves to be technically safe and advantageous for industrial processes involving reconstituted wood panels.
Statistical analyses using ANOVA and Tukey's test revealed consistent and well-structured patterns among the variables evaluated, reinforcing the reliability of the data set. The absence of significant differences between wood (W) and wood with bark (WB) for most properties indicates a high degree of homogeneity between treatments. These results also highlight that the variance within groups (residual variance) was low, increasing confidence in the observed mean values and the robustness of the comparisons.
The coefficients of variation obtained indicated good experimental precision. Furthermore, the clear separation of bark (B) from other sample types in the Tukey test corroborates the biological and technological distinction of bark tissue, while the overlap between W and WB reinforces that the inclusion of bark does not significantly affect the main technological parameters.
CONCLUSION
The combination of wood and bark in Eucalyptus clones caused no significant changes in basic density, chemical composition, pH, or ash content. These results support the use of wood with bark (WB) for MDF production, provided processing efficiency and panel quality are maintained. This approach avoids debarking, reducing operational costs and improving raw-material utilization. Bark alone showed higher ash and extractive contents, limiting its use in pulping but favoring applications in energy generation, soil coverage, and biorefinery processes. WB followed the same base-to-top density pattern as wood, ensuring predictability in industrial operations.
ACKNOWLEDGEMENTS
The authors would like to thank the Coordination for the Improvement of Higher Education Personnel (CAPES) and the Espírito Santo Research Support Foundation (FAPES) for granting scholarships and the company Dexco for the partnership and provision of study material.
Data availability
The datasets supporting the conclusions are included in the article.
REFERENCES
- ALMEIDA, M. N. F.; PICOLI, E. A. T.; MOULIN, J. C.; et al. Propriedades da madeira como potenciais biomarcadores de tolerância a distúrbios fisiológicos: comparação de genótipos de eucalipto divergentes. Scientia Forestalis, v. 50, p. e3864, 2022.
- AMERICAN SOCIETY FOR TESTING AND MATERIALS. ASTM D1762-84: Standard test method for chemical analysis of wood charcoal. Philadelphia, 2021.
- AMERICAN SOCIETY FOR TESTING AND MATERIALS. ASTM E70-07: Standard test method for pH of aqueous solutions with the glass electrode. West Conshohocken, 2015.
- AMERICAN SOCIETY FOR TESTING AND MATERIALS. ASTM D2395-17: Standard Test Methods for Density and Specific Gravity (Relative Density) of Wood and Wood-Based Materials. Philadelphia, 2017.
- CÂMARA, A. P.; VIDAURRE, G. B.; OLIVEIRA, J. C. L.; et al. Rainfall exclusion changes the sapwood of eucalyptus wood in humid and dry sites. European Journal of Forest Research, v. 142, n. 3, p. 627-640, 2023.
- CUNHA, A. B.; MELLO, D. C.; FERREIRA, J. L.; et al. Industrial boiler ash as an alternative for reducing formaldehyde emissions in medium-density fiberboards. Wood Material Science & Engineering, p. 1-10, 2024.
- DEMO, A. H.; BOGALE, G. A. Enhancing crop yield and conserving soil moisture through mulching practices in dryland agriculture. Frontiers in Agronomy, v. 6, p. 1361697, 2024.
- DOU, J.; WANG, J.; HIETALA, S.; et al. Structural features of lignin-hemicellulose-pectin (LHP) orchestrate a tailored enzyme cocktail for potential applications in bark biorefineries. Green Chemistry, v. 25, n. 14, p. 5661-5678, 2023.
- FOELKEL, C. Eucalyptus tree bark: morphological, physiological, forestry, ecological and industrial aspects, aiming at the production of cellulose and paper. Eucalyptus Online Book & Newsletter, 2005. 109 p. ([BDTD USP][1])
- GIANNOTAS, G.; KAMPERIDOU, V.; BARBOUTIS, I. Tree bark utilization in insulating bio-aggregates: a review. Biofuels, Bioproducts and Biorefining, v. 15, p. 1989-1999, 2021.
- GOMIDE, J. L.; DEMUNER, B. J. Determination of lignin content in woody material: modified Klason method. The Paper, v. 47, n. 8, p. 36-38, 1986.
- GÖßWALD, J.; BARBU, M. C.; PETUTSCHNIGG, A.; et al. Binderless thermal insulation panels made of spruce bark fibres. Polymers, v. 13, n. 11, p. 1799, 2021.
- GÖßWALD, J.; BARBU, M. C.; TUDOR, E. M.; et al. Leveraging spruce bark particle morphology for enhanced internal bonding in particleboard production. Polymers , v. 16, n. 21, 2024.
- IBÁ - Indústria Brasileira de Árvores. Annual Report 2023. São Paulo, 2023.
- IWAKIRI, S. Reconstituted wood panels. Paraná: FUPEF, 2021. 247 p.
- JESUS, D. S.; BORGES, R. N.; SILVA, J. S. Basic density and fiber dimensions of a Eucalyptus clone grown in different locations. Science & Technology Notebooks, v. 36, n. 3, e26484, 2019.
- KELLY, M. W. Critical literature review of relationships between processing parameters and physical properties of particleboard. Madison: Forest Products Laboratory, 1977, 65p.
- MALONEY, T. M. Modern particleboard & dry process fiberboard manufacturing. San Francisco: Miller Freeman, 1989. 672 p.
- MININI, D.; GONÇALVES, F. G.; SEGUNDINHO, P. G. A.; et al. Eucalyptus wood residue and tannic adhesive in particleboard panels. Wood Science, v. 8, n. 2, p. 101-113, 2017.
- MIRANDA, I.; GOMINHO, J.; PEREIRA, H. Incorporation of bark and tops in Eucalyptus globulus wood pulping. BioResources, v. 7, n. 3, p. 4350-4361, 2012.
- MORANDINI, M.; BARBU, M. C.; VÁNOVÁ, R.; et al. Valorization of extracted bark for particleboard production: a life-cycle impact assessment. Polymers , v. 17, n. 7, 2025.
- NEIVA, D. M.; ARAÚJO, S.; GOMINHO, J.; et al. Potential of Eucalyptus globulus* industrial bark as a biorefinery feedstock: chemical and fuel characterization. Industrial Crops & Products, v. 123, p. 262-270, 2018.
- NIU, X.; HE, Y.; MUSL, O.; et al. Bark extractives as sources of carbon-efficient functional precursors and materials. The Innovation Materials, v. 2, n. 2, p. 100074-1-100074-18, 2024.
- PANDEY, S.; PANT, P. Possibilities and challenges for harnessing tree bark extracts for wood adhesives and green chemicals and its prospects in Nepal. Forest Science and Technology, v. 19, n. 1, p. 68-77, 2023.
- PROTÁZIO, L. B.; ARAÚJO, S. L.; GIMENEZ, G. G.; et al. Relationship between pH and basic density of wood from Eucalyptus clones intended for the production of fiberboards. Technical Series IPEF, v. 26, n. 48, p. 18-23, 2023.
- PURI, L.; HU, Y.; NATERER, G. Critical review of the role of ash content and composition in biomass pyrolysis. Frontiers in Fuels, v. 2, p. 1378361, 2024.
- RAMALHO, F. M. G.; PIMENTA, M.; GOULART, C. P.; et al. Effect of stand density on longitudinal variation of wood and bark growth in fast-growing Eucalyptus plantations. iForest, v. 12, p. 527-532, 2019.
- ROCHA, M. F. V.; PEREIRA, B. L. C.; OLIVEIRA, A. C.; et al. Influence of plant spacing on the bark properties of a Eucalyptus clone. Revista Árvore, v. 42, n. 5, p. e420501, 2018.
- ROCHA, S. M. G.; BARROS JUNIOR, U. O.; OLIVEIRA, L. J.; et al. Association between the anatomical features and the natural drying of young wood from hybrid Corymbia torelliana and Corymbia citriodora clones. European Journal of Wood and Wood Products, v. 82, p. 1901-1912, 2024.
- SANTOS, V. B.; CONCEIÇÃO, G. J.; RODRIGUES, P. D.; et al. Impact of age and genotype on the quality of eucalyptus wood for dissolving pulp. Industrial Crops and Products, v. 218, p. 118930, 2024.
- SANTOS, L. M. H.; ALMEIDA, M. N. F. D.; SILVA, J. G. M. D.; et al. Variations in heartwood formation and wood density as a function of age and plant spacing in a fast-growing eucalyptus plantation. Holzforschung, v. 75, n. 11, p. 979-988, 2021.
-
SÃO PAULO (State). Secretariat of Agriculture and Supply. Resolução SAA nº 40, de 14 de dezembro de 2015: amends Resolução SAA nº 10/2003 (PMQ 3-03) for charcoal quality. São Paulo: SAA, 2015. Disponível em: Disponível em: [http://www.codeagro.agricultura.sp.gov.br/arquivos/selo/SAA%2040%20Carvao%20Vegetal%202015.pdf](http://www.codeagro.agricultura.sp.gov.br/arquivos/selo/SAA%2040%20Carvao%20Vegetal%202015.pdf) Acesso em: 5 out. 2024.
» [http://www.codeagro.agricultura.sp.gov.br/arquivos/selo/SAA%2040%20Carvao%20Vegetal%202015.pdf](http://www.codeagro.agricultura.sp.gov.br/arquivos/selo/SAA%2040%20Carvao%20Vegetal%202015.pdf) - SARTORI, C. J.; MOTA, G. S.; MORI, F. A.; et al. Bark characterization of a commercial Eucalyptus urophylla hybrid clone in view of its potential use as a biorefinery raw material. Biomass Conversion and Biorefinery, v. 12, n. 5, p. 1541-1553, 2022.
- SHIROSAKI, R. K.; AQUINO, V. B. M.; WOLENSKI, A. R. V.; et al. Effect of CCB treatment and alternative adhesive content on physical and mechanical performance of particleboards. Floresta e Ambiente, v. 29, n. 2, 2022.
- SORATTO, D. N.; CUNHA, A. B.; VITAL, B. R.; et al. Effects of adding bark chips on the quality of MDP panels produced with Eucalyptus sp. Wood Science , v. 4, n. 1, p. 46-59, 2013.
- SUPRIYADI, D.; DAMAYANTI, D.; VEIGEL, S.; et al. Unlocking the potential of tree bark: review of approaches from extractives to materials for higher-added value products. Materials Today Sustainability, p. 101074, 2025.
- SOUZA, E. R. N.; ESCOBAR, C. G.; MUMES, L. C.; et al. Influence of heat treatment on the pH and buffer capacity of Eucalyptus spp. and Pinus spp. wood. In: Proceedings of the Brazilian Congress of Wood Science and Technology. Campinas: Galoá, 2017.
- TECHNICAL ASSOCIATION OF THE PULP AND PAPER INDUSTRY. TAPPI T 204 cm-07: Solvent extractives of wood and pulp. Atlanta: Tappi Press, 1997.
- TECHNICAL ASSOCIATION OF THE PULP AND PAPER INDUSTRY. TAPPI T 264 cm-97: Preparation of wood for chemical analysis. Atlanta: Tappi Press, 1997.
- TRIPATHI, S.; ALAM, I.; BHARDWAJ, N. Effect of bark content in mixed hardwood chips on pulp and papermaking properties. Nordic Pulp & Paper Research Journal, v. 35, n. 3, p. 325-331, 2020.