Evaluation of materials derived from rice husk as adsorbents of cationic and anionic dyes
ABSTRACT
The rice husk was chemically treated with acetic acid and calcined at 600 °C, in an uncontrolled atmosphere to obtain the ash (RHA), and in an oxygen-limited atmosphere to produce the biochar (BC). The influence of the thermal treatment on the adsorbent properties for removing cationic (methylene blue) and anionic (methyl orange) dyes was investigated. Both materials showed amorphous structures rich in silica, with acicular morphology and a high roughness. High surface areas (157.2 and 215.5 m²g-1) and pH at the point of zero charge close to neutrality (6.73 and 6.58) for RHA and BC were found, respectively. The anionic dye was adsorbed only by BC due to its contribution to the π- π stacking interaction between the C=C bonds of the adsorbent and the benzene rings of the dye. In contrast, the cationic dye was adsorbed by electrostatic interaction between the Si-O-Si and Si-OH groups of the adsorbents, with the positive charge of the dye. All adsorption isotherms adjusted better to the SIPS model, suggesting adsorption in homogeneous and heterogeneous sites. The observed results suggest good adsorption capacities and the interactions between surface groups on the adsorbents and functional groups of the contaminants are the most important mechanism in the adsorption of dyes of different ionic natures on surfaces derived from rice husk.
Keywords:
agro-industrial waste; rice husk ash; biochar
INTRODUCTION
Human and industrial activities generate pollutants that are potential sources of contamination of water ecosystems, compromising the maintenance of aquatic life and bringing risks to human health. Contamination by dyes, for example, results in risks of carcinogenicity, toxicity, and mutagenicity, as well as preventing the photosynthetic activity of algae and causing the depletion of dissolved oxygen 1.
This scenario boosted the development of several methods for removing these substances from an aqueous medium, such as membrane filtration and coagulation 2, adsorption 3, oxidation 4, and precipitation 5. Among these, adsorption is the most common, however, it has a high associated cost because it generally uses activated carbon. Therefore, several literatures have proposed the use of agro-industrial residues to development of new adsorbents, reducing costs and environmental impacts, especially due to their biodegradability and high availability 6)-(10.
One of the agro-industrial activities that generates many residues is rice production, whose grain is consumed on a large scale worldwide. According to the Food and Agriculture Organization (FAO), worldwide rice production in 2022/23 is projected to be 516.7 million tons 11. For each ton of rice processed, around 20% of rice husk is generated as waste, and its direct disposal in the soil can lead to accumulation due to the difficulty of biodegradatio 12),(13. Then, in addition to the economic advantage of reusing this residue in value-added applications, such as the adsorption of contaminants for wastewater decontamination, there are also environmental advantages for reducing its accumulation in the environment.
Rice husk can be submitted to thermolysis to generate ash or biochar. The latter can be obtained by limiting oxygen during the thermal treatment (pyrolysis), where carbon can be fixed in the product of synthesis. Studies investigating the use of rice rusk or its ashes and biochars as adsorbents for both cationic and anionic dyes have shown good removal efficiencies 10),(14)-(16. The adsorption capacity of these materials can also be favored by the chemical pre-treatment of the husk, because, in addition to removing alkaline and alkaline earth mineral impurities and improving the silica content, it can increase porosity and surface area 17),(18.
Several studies involving the use of both ash or biochar for the removal of cationic (methylene blue, MB) and/or anionic (methyl orange, MO) dyes (Table I) have been carried out. For instance, the production of ash from rice husk by heating it at 300, 500, 700, and 900 °C (rate = 5 ºC/min, holding time = 2 h) for MB adsorption, shows that high content of potassium in the biomass composition at 500 °C of heating favored graphitized carbon fixation in the ash, which favored the adsorption of the dye, mainly due the increased surface area promoted by the presence of the carbon 19. The comparison of the adsorption of MB and MO using biochars from rice husk pyrolyzed in pure N2 atmosphere at 600°C for 6 h, produced an adsorbent with a pore structure, high specific surface area (973.8 m2/g), and rich surface functional groups 15. These properties promoted the high performance of adsorption for both dyes, but only a small range of initial concentrations of dyes were investigated, hiding the real difference in adsorption behavior between the investigated dyes. Besides, the hole of silica and carbon structure forming the biochar were not considered in the mechanism of adsorption of each dye, and mechanisms were not well elucidated.
Literature studies evaluating the use of ash or biochar from rice husks to remove methylene blue and methyl orange.
Therefore, despite important research evaluating MB and MO adsorption using materials derived from the thermolysis of rice husk, no one evaluated the adsorption of both cationic and anionic dyes on ash and biochar produced from the same biomass. Then, two issues about the effect of the thermolysis process of rice husk on the properties of those adsorbents remain: i) what is the effect of limiting oxygen in the thermolysis process on the adsorbent properties and ii) what is the real contribution of silica and fixed carbon in those adsorbents for adsorption of MB and MO? In this context, this study investigates the use of ash and biochar produced from rice husk in the removal of MB and MO from aqueous media evaluating the relationship between the structure and properties of each material and their ability to adsorb the dyes.
EXPERIMENTAL
Chemical analysis of Rice Husk
Rice husk was donated by a producer in the city of Lavras-MG, Brazil. Its chemical characterization was carried out through the analysis of total extractives (NBR 14853, ABNT, 2010), lignin (NBR 7989, ABNT, 2010), and ash (NBR 13999, ABNT, 2017). Analyzes were performed in triplicate.
Ash (RHA) and biochar (BC) synthesis from rice husk
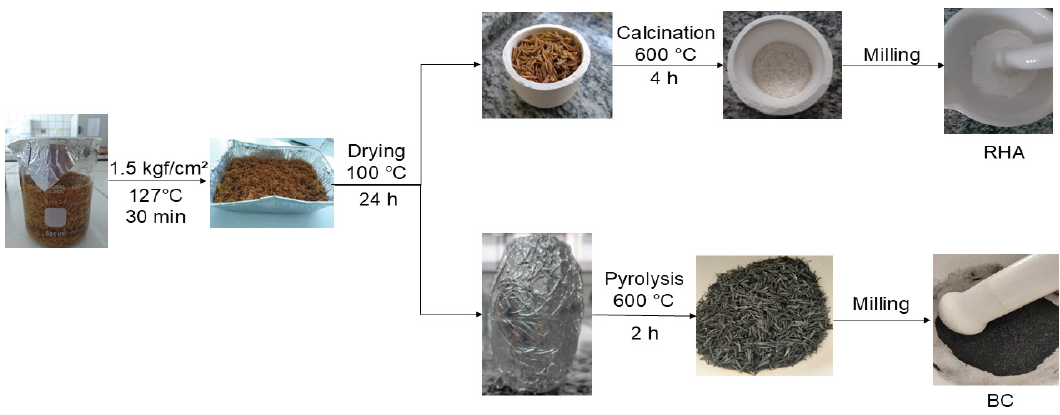
To obtain ash and biochar, the procedures described by other authors were adapted and are schematized in Figure 1 21),(22.

Briefly, the rice husk sample was pre-treated with acetic acid to eliminate impurities, where 40.0 g of rice husk samples were placed in a beaker containing 350 mL of 1.7 mol L-1 acetic acid solution. The mixture was taken to an autoclave (SOC. FABBE Ltda., mod. 104) at 1.5 kgf cm-2 and 127 °C, for 30 minutes. After, the sample was washed with distilled water until neutral pH and dried in an oven at 100 °C for 24 h. The dried sample was placed in alumina crucibles, followed by calcination in a muffle furnace at 600 °C for 4 hours to obtain the ash (RHA). To obtain the biochar (BC), two alumina crucibles were filled with the sample, joined, and sealed with aluminum foil to limit the presence of oxygen. The set was also heated in a muffle furnace at 600 °C for 2 h. The heating rate for both processes was 20 °C min-1. Both samples were ground in a porcelain mortar after calcination and passed through a 60-mesh sieve for characterization and use in the adsorption experiments.
Characterization of adsorbent samples
The surface area of the adsorbents was determined by the Brunauer-Emmett-Teller (BET) method, and the pore size distribution was calculated using the Barrett, Joyner, and Halenda (BJH) method in a QUANTACHROME instrument, mod. NOVA 2200e. The functional groups present in each sample were identified by Fourier Transform Infrared Spectroscopy with attenuated total reflectance (FTIR-ATR, Bomen MB- mod. 100C26) in the range of 4000 to 400 cm-1 with a resolution of 4 cm-1. The presence or absence of crystalline phases in the adsorbents was evaluated by X-ray diffraction (XRD, Shimadzu SSX-550) with electron acceleration of 40 kV, electric current of 30 mA, using copper radiation between 10° to 80° in 2θ. For morphological and surface chemical analysis, Scanning Electron Microscopy with Energy Dispersive Spectroscopy (LEO EVO 40 XVP with EDS XFlash 6160-Bruker system) was performed, where the samples were coated with carbon.
The point of zero charge (PZC) was determined by the solid addition method (SINGH et al., 2015). Briefly, the pH of a 0.1 mol L-1 NaCl solution was adjusted to different values (2, 4, 6, 8, 10, or 12) from the addition of 0.1 mol L-1 NaOH (P.A., P.M. = 40 g mol-1, Êxodo Científica) or 0.1 mol L-1 HCl (37% P.A., P.M= 36.46g mol-1, Êxodo Científica). A volume of 20.00 mL of the solutions with adjusted pH was added to 20.0 mg of each adsorbent. The systems were manually shaken intermittently to ensure homogeneity and kept at 25±1°C. After 24 hours, the final pH of the solution was measured to obtain a curve of pH variation (ΔpH) as a function of the initial pH. The systems were prepared in triplicate.
Study of the adsorption of dyes
The adsorption capacity of the synthesized materials was evaluated for methylene blue (MM = 373.9 g mol-1, 52015) and methyl orange (MM = 327.34 g mol-1, 13025). Firstly, a stock solution of each dye was produced at room temperature with a concentration of 1 g L-1 that was diluted to obtain the desired concentrations of the dyes for each assay. All studies were performed at a temperature of 25±1 °C, under agitation of 120 rpm in a shaker, using 20.0 mg of each adsorbent in 20.0 mL of dye solution. Blanks were prepared in the same condition in the absence of the dye. For each analysis, the final mixture was centrifuged at 400 rpm for 3 minutes and the supernatants were collected and analyzed using the spectrophotometric method (SHIMADZU UV-3600 Plus equipment) at λ= 648 nm for methylene blue and λ=468 nm for methyl orange.
The influence of pH on the adsorption capacity of the adsorbents was evaluated by adding 0.01 mol L-1 HCl or NaOH to 20.0 mg L-1 MB (or MO) aqueous solutions. Initial pH values of 2.00, 4.00, 7.00, 10.00, and 12.00 were tested. Each system was prepared in triplicate. The pH with the best adsorption efficiency for each dye was used for the kinetic and equilibrium tests (pH 4.00 and 10.0 for MO and MB, respectively).
For kinetics experiments, the initial concentration of the dyes was 20.0 mg L-1. After prepared, the systems were immediately put in the shaker and remained under agitation for a determined period (between 0 and 72 h). For the studies of adsorption equilibrium, similar experiments were carried out but using initial concentrations of dye solutions ranging from 0 to 300 mg L-1 of the dyes. The contact time was the one necessary to reach the adsorption equilibrium, obtained from the kinetics experiments.
To calculate the adsorbed amount (qe or qt), the dye concentrations in the aqueous solutions were determined by UV-Vis. Equation 1 was used to calculate qe and qt:
where, qe (mg g-1) and qt (mg g-1) are the quantities of adsorbate adsorbed in the equilibrium and after a time t, respectively; C0 and Ct are initial and final concentrations (mg L-1), respectively; m is the mass of adsorbent; and V is the solution volume.
Adsorption and equilibrium models
The adsorption kinetics curves were evaluated using the pseudo-first-order, pseudo-second-order, Elovich, and intraparticle diffusion models, whose equations are described in Table II, where k1 e k2 (s-1) are the adsorption rate constants of the PPO and PSO model, respectively; qe (mg g-1) e qt (mg g-1) are the quantities of adsorbate adsorbed in the equilibrium and after a time t, respectively; α (mg (g min)-1) is the initial sorption rate; β (mg g-1) is the desorption constant; ki is the intraparticle diffusion coefficient and can be defined from the slope of the line qt versus t1/2 and C, constant related to resistance to diffusion, is the intersection point.
The Langmuir, Freundlich, and SIPS isotherm models were used to adjust and study the parameters, as described in Table III, where qe (mg g-1) is the quantity of contaminant adsorbed per unit of adsorbent; qmáx (mg g-1) is the maximum adsorption capacity; Ce is the equilibrium concentration (mg L-1); KL is the Langmuir coefficient, which indicates the equilibrium constant for the adsorption process; KF and n are the Freundlich constants, where KF Replace with: (mg g−1)(L mg−1)1/n is taken as a relative indicator of the adsorption capacity and 1/n shows the energy or intensity of adsorption; ks is the SIPS constant (L mg-1)n.
RESULTS AND DISCUSSION
Chemical analysis of rice husk
The chemical composition of biomass is an important aspect that can determine the properties of materials derived from its thermal treatment. The average values calculated for extractives, lignin, ashes, and holocellulose in the rice husk used in this study are described in Table IV.
The chemical composition of biomass depends on several factors, such as soil type, climate, and geographic location, among other variables that cause the chemical composition to vary even within the same species 24. As can be seen, rice husks have similar levels of lignin and holocellulose but have a high ash content when compared to other biomass, such as bamboo and coconut fibers, which have ash contents around 1.6 and 0.6%, respectively 25.
Lignin and cellulose are organic molecules composed mainly of carbon, while rice husk ash is composed of silica. To produce biochar, many authors evaluate the elemental composition or fixed carbon content of biomass on a dry base and ash-free, bringing only the values of cellulose, hemicellulose, and lignin, which are related to the presence of carbon in the final product 26),(27. However, the amount and type of inorganic compounds are also important to determine biomass applications, especially for rice husks due to their high ash content, which means that the final product also consists of them 28.
The high ash content of rice husk is related to its final yield after calcination, which enables its use in new applications, such as adsorption. High ash and lignin contents in the biomass, in addition to a low cellulose content, also can contribute to a high yield of biochar 25),(28. In fact, the yield of the BC obtained in this study was 32.7%, which is slightly higher than the maximum of 30% calculated for other biomasses at pyrolysis temperatures between 500 and 800 °C reported in the literature 28)-(30.
Characterization of adsorbent samples
Fourier Transform Infrared Spectroscopy (FTIR-ATR)
FTIR-ATR analysis was performed to identify functional groups present on the surface of the samples. The spectra obtained for the different adsorbents (RHA and BC), compared with the feedstock (RH) are shown in Figure 2.

The position of the bands referring to the analyzed samples showed few variations. For the rice husk, bands between 1347 and 1742 cm-1 could be observed, referring to bonds involving carbon. The region around 1700 cm-1 refers to the C=O stretching vibration, related to carbonyl 31. The bands observed between 1400, and 1600 cm-1 are characteristic of aromatic rings from lignin 32. The intensity of these bands is very weak, likely due to the low concentration of these groups on the material surface, combined with a high content of ash, which may inhibit the absorption of light by carbonyl groups and C=C bonds.
The bands located at 447, 793, and 1061 cm-1 in the RH spectrum were attributed to Si-O-Si siloxane bonds 19. The band at 1061 cm-1 can also be attributed to the silanol (Si-OH) bond and at 793 cm-1, to the Si-H bond 33. The presence of these chargeable polar groups on the surface of the adsorbents can generate cation exchange capacity for the materials, favoring the adsorption of charged species 34.
It should be noted that the bands referring to bonds involving silicon were observed at a very high intensity in the RHA and BC spectra, which may be related to the high content of these groups in the adsorbents. This indicates that pyrolysis and calcination favored the decomposition of organic groups with the maintenance of groups containing silicon. However, while calcination promoted the total decomposition of rice husk organic compounds in RHA, pyrolysis preserved a carbon structure in the BC, confirmed by the light and broadband at 1577 cm-1, related to the C=C bond of aromatic structures 32. Once more, the low intensity of this band indicates the low surface concentration of carbonaceous structure in BC.
Surface area and pore volume
Variations in the textural properties (surface area (SBET), pore volume, and average pore size) for samples of biochar and ash obtained from rice husks depend heavily on the material production conditions (19),(27),(32),(33),(35),(36 and were accessed for RHA and BC by BET analysis (Table V).
Both adsorbents showed high surface area and pore volume, with values higher than most of the studies found in the literature for materials from rice husk, especially regarding the pore volume (19),(27),(33),(37. The higher SBET for BC is probably associated with the extra carbon structure retained during pyrolysis. Both adsorbents presented an average pore size smaller than 2 nm and can be classified as microporous 38.
X-Ray Diffraction (XRD)
Figure 3 shows the XDR diffractogram obtained for the two analyzed samples. It is possible to verify the presence of an amorphous halo between 15 and 31°, with maximum intensity at approximately 22°, which is related to amorphous silica 39)-(41. Biochar also showed a halo between 40 and 50°, which is related to the presence of graphitic structure in the material 42. This result agrees with the FTIR analysis, which indicated the presence of C=C bonds only in the BC sample.

The amorphous structure is produced by burning rice husks at temperatures between 500 and 800 °C. It has higher Gibbs free energy than the crystalline structure due to the absence of long-range order in its structure, which generates greater reactivity, surface area, and porosity that contribute to adsorption 19.
Scanning Electron Microscopy with Energy Dispersive (SEM-EDS)
Figure 4 shows the SEM images obtained for the analyzed samples, at different magnifications (100x and 500x). Both samples presented similar microscopic shapes: they are acicular and with high roughness, similar to that found by other authors for materials derived from rice husks 19),(43. Biochar showed a more regular distribution of shapes and with more rough structures, as enlarged in Figure 4d. These structures may be related to its greater surface area compared with ash.

Scanning electron microscopy for samples of a, b) rice husk ash; c, d) rice husk biochar. Images a) and c) are magnified at 100 times and b) and d) at 500 times.
Little porosity can be also observed in the magnifications analyzed, and the porosity found in the BET analysis can be related to the presence of open or interconnected micropores, as verified in other research at higher resolutions 19. From the BET analysis, the samples are known to have porosity on the micropore scale, which is formed inside the material and may not be visible at this resolution.
The EDS analysis coupled with the SEM (Figure 5) allowed the visualization of the predominant composition of silica in both materials, with the most intense peak for the RHA, in the same way as the FTIR, for the bonds involving this element.

Thus, these results corroborate the greater amount of silica on the surface of RHA than on BC. The presence of carbon that could also be observed in the FTIR for biochar was not evaluated in this analysis due to the test methodology, in which the samples were bathed with carbon before measurements.
Point of Zero Charge (PZC)
The PZC analysis indicates the pH value where the surface of the adsorbents becomes neutral. The point where the pH variation is zero in the curve of ΔpH versus initial pH represents this value and can be seen in Figure 6.

Both samples showed similar values for PZC, being 6.58 for BC and 6.73 for RHA. The close values are due to the superficial chemical similarity of the materials that could be observed by the FTIR and EDS analyses. At pH values smaller than PCZ, many authors cite the generation of net positive charges on the surface of the adsorbents, creating an electrostatic interaction with anionic dyes, such as methyl orange 10),(44. However, in the case of materials derived from rice husk, especially RHA, the surface is composed of groups that can acquire just a negative charge due to the deprotonation of functional groups containing hydroxyls bounded to Si, providing electrostatic interaction with cationic dyes, such as methylene blue 9),(14. However, RHA and BC surface groups will hardly suffer protonation to acquire a positive net charge on their surface. This hypothesis is also confirmed by the ΔpH values vary low at an initial pH smaller than PZC. Thus, at pH < PZC the surface of these adsorbents will probably be neutral or have a very low net positive charge.
Study of the adsorption of dyes
Because of all the properties highlighted until now, a comparison between the performance of adsorption of BC and RHA for MO and MB can provide new insights on the specific interactions with silica determining the adsorption of these dyes.
pH effect
As pH can change the surface change of BC and RHA, as well as those of adsorbates, the initial pH of the solutions was evaluated on the adsorption capacity of the material (Figure 7).

Influence of pH on the removal efficiency of the different analyzed systems (X-Y abbreviations denote the dye X and Y adsorbent used). Conditions: 20.0 mg of adsorbent in 20.0 mL of 20.0 mg L-1 dye solutions; stirring at 120 rpm for 24 hours, at 25°C.
The pH had a strong influence on the adsorption capacity of the materials in the presence of two types of dyes. An increase of the pH up to 10.00 increased the MB adsorption, for both adsorbents, as verified by other authors 9),(45. This occurs because at higher pH values, specifically at pH higher than the PZC, the surfaces of the adsorbents become negatively charged, favoring the electrostatic interaction with the positively charged MB (Figure 8) 20. The low removal efficiency of the MB dye at lower pH values can be attributed to the increase in the concentration of H+ ions, as indicated by Equation 2,
where (MB)+ represents the methylene blue cationic dye and x is the number of protons 19.

In the low pH condition, the equilibrium is shifted to the left due to the high concentration of hydrogen ions, which compete with the dye cations, generating methylene blue desorption 9. However, even with a high concentration of H+ ions in the solution at pH 2.00 and 4.00, for example, there was considerable dye removal (about 40-50%). This can be justified by the possibility of the formation of hydrogen bonds between the amino group in the MB cation and the hydroxyl groups attached to the silica on the surface of the adsorbents BC and RHA, besides π-π stacking interactions of the dye aromatic structure with the graphitic carbon structure of the BC. This last one could also explain the higher values of removal efficiency observed for BC, which present the greater specific surface area, at pH 2.00 and 4.00 (Table 4). On the other hand, the RHA demonstrated a greater efficiency of adsorption of MB in the pH range from 7 to 12, confirming the more important contribution of negative sites in the silica surface for the adsorption of the MB.
At pH 12.00 the removal efficiency of MB decreased sharply, probably due to the high concentration of sodium ions resulting from the addition of NaOH, which also competed with the dye for the adsorption sites. Unlike MB, MO showed greater removal at pH values of 2.00 and 4.00 for BC. As the pH increased, removal efficiency decreased up to 29.8%, indicating a change in the balance of intermolecular interactions determining adsorption with pH change. This behavior has been observed by other authors 10),(15. Interestingly, no adsorption was observed for RHA in the investigated pH range, indicating that the carbon fixed in the pyrolysis process determined the adsorption of MO by BC.
In fact, despite the similarity of the chemical nature between the surface groups of the two adsorbents, the FTIR bands indicated that the RHA presented only functional groups involving silicon atoms. These functional groups favored the interaction with the cationic dye at higher pH values (both for BC and RHA) but strongly repelled the negative charge of the anionic one.
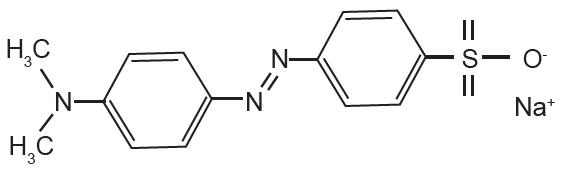
The anionic nature of MO (Figure 9) suggests that adsorption could be favored at a pH smaller than PZC for materials that acquire a positive surface charge, attracting the dye by electrostatic forces. However, as previously discussed in section 3.2.1, the BC surface charge is near neutrality at this condition due to its composition of silica groups and other functional groups that do not acquire a positive charge by protonation.

As the pH decreased, the protonation of the silicate groups, as mentioned, may have led to the formation of hydrogen bonds with MB, which still maintained good removal at the lower pH values. However, it was expected that MO could also be a hydrogen bond acceptor species, which was not reflected in the removal of this dye by RHA even in the lower pH values. This corroborates the hypothesis that the interactions that determine the removal of this dye by the BC at lower pH values are the π-π stacking interactions between the aromatic structure of the MO and the aromatic groups of the BC.
Due to the results obtained, considering the application of the adsorbents in the condition of better adsorption performance for each dye, the other assays were conducted at the initial pH value in which the adsorbent showed the best removal for each dye, i.e., pH 10.00 for MB and pH 4.00 for MO.
Adsorption kinetics
Figure 10 shows the kinetic curves of adsorption and the linear and non-linear fit of the experimental data to different kinetic models. The values obtained for the parameters of each model with the associated statistical errors are in Table VI.

Experimental data of adsorption kinetics and adjustments to the different kinetic models evaluated. Conditions: 25 °C, 20.0 mg of adsorbent in 20.0 mL of 20.0 mg L-1 dye solution, stirring at 120 rpm, pH 4 (MO-BC) or pH 10 (MB-BC and MB-RHA).
All analyzed systems presented long equilibrium times. BC in contact with methyl orange MO reached equilibrium after 18 hours of contact (1080 min), while for MB in the presence of BC and RHA, 48 hours were necessary (2880 min). This may be related to the relation between the pore sizes of the adsorbent and adsorbate molecular size. There are review studies that show that the equilibrium time of porous materials, such as those analyzed in this study, is superior due to the different adsorption mechanisms involved in the process, which can reach several days 46. However, studies evaluating the adsorption of MO and MB in adsorbents from rice husks have shown small time intervals for steady state conditions 9),(14),(19),(47, which can be associated with distinct pore size averages of the materials produced.
If the pore size of the adsorbent is much larger than the molecular size of the adsorbate, the adsorption time is very short, but if they are similar, the adsorption time is relatively long 48, especially due to intrapore diffusion processes. The intraparticle diffusion model (Equation 5) was applied to the data (Figures 8a.2, 8b.2, and 8c.2), where values of C equal to 0 indicate that there is no mass transfer by the liquid film. Besides, the higher ki, the greater the diffusion of the contaminant in the pores of the material, that is, the less limited the process by intrapore diffusion 1),(15. Only stage 1 of the MB-RHA system did not show diffusion through the liquid film. As for the diffusion rate, the ki values were reduced at each stage due to the progressive filling of the pores, which limits the diffusion in the final stages. Furthermore, MB showed higher diffusion rates in RHA than in BC.
The molecular cross-sectional diameters of methylene blue and methyl orange are 0.8 and 7 nm, respectively 48. Therefore, the first one is slightly smaller than the average pore size of BC (0.88 nm) and RHA (1.81 nm), managing to diffuse through them, but in long times due to the similarity of sizes. Furthermore, due to the larger average pore size of RHA, which facilitates diffusion, MB had higher ki1 and ki2 values in RHA than in BC. On the other hand, MO is considerably larger than the average pore size of both adsorbents, and probably it cannot penetrate them, but only greater pores, where diffusion is faster. This explains its shorter equilibration time and the smaller number of stages observed in the intraparticle diffusion model.
The results obtained by the treatments using linear and non-linear regression for the pseudo-first order (PFO) and pseudo-second order (PSO) models differed from one another. For the adsorption of MO in BC, the non-linear PPO model was the one that best fitted the experimental data, comparing all statistical errors - lower values of χ2 (0.230) and ERRSQ (2.529) and higher R2 (0.981). In addition, from the graph in Figure 8a.1, it is possible to observe that the curves of the PFO model, for the linear and non-linear adjustments, were almost coincident. The values of qe, cal by the linear (8.93 mg g-1) and non-linear (9.00 mg g-1) adjustments of this model were close, in addition to differing less from the value of qe,exp (8.71 mg g-1), compared with the PSO model. This, in turn, despite presenting the same R2 for the linear and non-linear adjustments, obtained discrepant qe, cal values from each other (linear: 10.47 mg g-1 and non-linear: 11.07 mg g-1) and far from the experimental one.
The adsorption of MB showed a different behavior from that of MO, adapting better to the PSO model than to the PFO, for both investigated adsorbents. The linear and non-linear PFO models showed differences in the qe, cal values. For BC, qe, cal by PFO (linear: 8.86 mg g-1 and non-linear: 9.93 mg g-1) was closer to the experimental (10.01 mg g-1), while the calculated by PSO (linear: 11.23 mg g-1 and non-linear: 11.72 mg g-1) was higher. Despite this, the R2 values were higher, associated with a lower ERRSQ and χ2. As for the RHA, qe, cal (linear: 16.75 mg g-1 and non-linear: 15.97 mg g-1) by PSO was closer to the experimental (16.10 mg g-1), for both linear and non-linear adjustments, in addition to the higher R2 value when compared to the PFO. The best fit of the adsorption of MB in materials derived from rice husk to the PSO model is in line with other research in the literature 9),(15),(19),(43.
Comparing the linear and non-linear adjustments for the PFO and PSO models, it is possible to observe that the model with the best fit in each system was the one that presented the greatest coincidence (within variations of the adjustments) between the two forms of calculation. For the MO-BC system, the parameters of the linear and non-linear PFO model were close, as well as the fit curves obtained, while for the MB-BC and MB-RHA systems, this proximity applies to the PSO model. Thus, when the non-linear model did not fit the experimental data well, the linear model showed greater divergences.
The PFO model considers that the adsorption rate varies proportionally with the concentration of sites, while the PSO model considers the variation of this rate with the concentration of sites squared. As the concentration of sites decreases, this rate also decreases, as can be seen in the graphs by the lower slope of the curves for longer contact times. The PFO model has been evaluated in many studies as descriptive of physisorption-controlled adsorption processes. 15. As it fits better to the MO in biochar, this result supports the existence of π-π interactions between the surface groups C=C of the adsorbent and the aromatic structures of the dye determining the adsorption. The PSO model is usually associated with chemisorption adsorption, where there are more adsorbate molecules or adsorption sites involved 15. As the adsorption of MB probably occurs predominantly due to the electrostatic interactions of the negative silica functional groups with the positive charge of the dye and those are present in both adsorbents in the evaluated condition, interaction with higher enthalpy change is favored.
Elovich’s model presented the best fit for the RHA and, from the graphs, it is possible to observe that it happened more similarly to the experimental data in the initial contact times, prior to saturation. This indicated that the chemisorption was dominant in the adsorption process and the model fits better to conditions far from reaction equilibrium 22.
However, these attributions of adsorption mechanisms by physisorption and chemisorption, based only on kinetic models, have been criticized in the literature 46. More precise conclusions can only be obtained from the relationship between adsorption and the physical-chemical characterization of the adsorbent material.
Adsorption isotherms
Adsorption isotherms for MB on BC and RHA and for MO in BC are shown in Figure 11. The most common models evaluated in the literature for the adsorption of the dyes investigated in this study on silica structures are those of Langmuir and Freundlich, with variations in the use of linear and non-linear calculations 1),(9),(14),(19),(43),(48. The values of the parameters related to these models are shown in Table VII and the fitted curves are in Figure 11, comparing the linear and non-linear adjustments..

Graphs of fit of experimental data of adsorption equilibrium to different isotherm models. Conditions: 25 °C, 20.0 mg of adsorbent in 20.0 mL of dye solution with different concentrations, stirring at 120 rpm for 24 h for MO-BC and 48 hours for MB-BC and MB-RHA, pH 4.00 (MO-BC) and pH 10.00 (MB-BC and MB-RHA).
Parameters for adjusting the experimental data to isothermal models for the adsorption equilibrium.
Comparing the linear fits with the non-linear ones, the non-linear Langmuir model fitted better to the data than the linear Langmuir one considering the lower ERRSQ. For Freundlich, the non-linear fit was better considering the lowest ERRSQ value and the highest R2, except for the MB-BC system.
MB-BC system showed the best fit to the linear Langmuir model, comparing the R² values, besides the smaller variations between the linear and non-linear qmax and KL parameters. The MO-BC system, for Freundlich fit, presented lower ERRSQ values and high R2 values compared with Langmuir, as well as closer Kf and n, with a ratio of 90% between the linear and the non-linear fit, respectively. The systems that presented the best fit to each model had a better approximation between the linear and nonlinear calculations, as well as in kinetic analysis. When the model did not fit the data well, there were greater discrepancies between linear and nonlinear calculations.
Comparing the non-linear fits for Langmuir and Freundlich models, only for MB on BC it was observed a higher R2, with lower ERRSQ and χ2 for the Langmuir model. However, these values were also close to those obtained by non-linear Freundlich. Because of this, it can be inferred that the Freundlich model fitted well to the three systems evaluated, with the highest R2 value and the lowest ERRSQ and χ2 for MO on BC. The constant KF showed increasing values in the order MO-BC < MB-BC < MB-RHA, indicating a better adsorption capacity of methylene blue by ash, as seen by the higher values of qe15. The 1/n values between 0 and 1 reflected favorable adsorption of all systems at low concentrations 10. Heterogeneity becomes more prevalent as 1/n approaches 0 19. The values found were low, but close to each other, not allowing conclusions about differences in the heterogeneity of the adsorption sites of BC and RHA in the evaluated conditions by this model.
The Langmuir model considers the adsorption process to take place in homogeneous monolayers, while Freundlich assumes heterogeneous surfaces 9),(43. From the graphs in Figure 11, it is possible to observe a better fit of the Langmuir curves to low concentrations, while Freundlich manages to get closer to the points of higher concentration. The combination of the influence of these two models on the adsorption was confirmed by the good fit of the data to the SIPS model.
For n=1, the SIPS model is equal to that of Langmuir, and the MB-BC system was the one that presented the value of n near to unity. In fact, the similarity of the SIPS and Langmuir curves in Figure 11 is evident for this system. The highest values of “n” for the MO-BC and MB-RHA systems indicated a better approximation of SIPS to the Freundlich model in these cases, as can be seen by the almost coincident curves obtained from this model and from SIPS in Figures 11a and 11c. The low Ks value for MB-RHA contributes to this conclusion, as Ks values close to 0 reduce this isotherm back to Freundlich. This suggests that the RHA has a more heterogeneous surface than the BC in the adsorptive process of MB, with more silica bonds available for physical interactions with the dye, as observed in FTIR and EDS analyses. Good fits of Langmuir to adsorption of cationic dyes on biochars, suggesting the possibility of homogenous sites in this adsorbent, had been reported 21. SEM analysis demonstrated the presence of more regular shapes for BC compared to RHA.
The qmax values obtained by SIPS are higher than those by Langmuir, especially for rice husk ash. The MB-BC adsorption curve showed a tendency to reach equilibrium, which justifies closer qmax values between the two models, while the others show a growth trend that is followed by the SIPS model. The SIPS model predicts adsorption beyond the experimental data when qe values have not yet reached a constant value 49.
CONCLUSIONS
Rice husk was used to produce ash (RHA) and biochar (BC) to investigate the relationship between the properties of each material and its adsorptive potential for anionic (methyl orange) and cationic (methylene blue) dyes. Both samples showed an amorphous structure, predominantly composed of silica, with similar morphologies (acicular and with high roughness), similar PZC, and high surface area and pore volume. However, the pyrolysis of rice husk in an atmosphere with O2 control to produce BC preserved the presence of aromatic functional groups (C=C) in its structure that interacted by π-π stacking with the anionic dye.
Rice husk ash (RHA) presented only silica groups, which are easily deprotonated, favoring the interaction with the cationic dye. At the same time, the absence of organic groups and high surface negative charge prevented the removal of the anionic dye by this adsorbent, independent of the pH. Within the kinetic models, the MO-BC system fitted better to the pseudo-first order, while the others fitted to the pseudo-second order model. In addition, intraparticle diffusion was favored for the methylene blue molecule, due to its smaller size compared to the pores of the adsorbents, especially for RHA. As for the adsorption equilibrium, all investigated systems fitted better to the SIPS model. Therefore, despite being obtained from the same agro-industrial residue, rice husk, the burning conditions of the BC and the RHA influenced the structure and properties of the final material obtained, especially in the functional groups and porosity, resulting in different adsorption performances.
ACKNOWLEDGEMENTS
Financial support for this study was provided by Fundação de Amparo à Pesquisa do Estado de Minas Gerais (FAPEMIG, grant APQ-00775-21), Conselho Nacional de Desenvolvimento Científico e Tecnológico (CNPq, grant 406474/2021-4), and Coordenação de Aperfeiçoamento de Pessoal de Nível Superior (CAPES, Finance Code 001). The authors would like to thank the Analysis and Chemical Prospecting Center of the Federal University of Lavras (CAPq), and FINEP, FAPEMIG, CNPq, and CAPES for the provision of the equipment and technical support for experiments involving FTIR and TGA analyses. Additional support was provided by CNPq (scholarships granted to GMD Ferreira - grant 309999/2022-7).
REFERENCES
-
1 Loc NX, Tuyen PTT, Mai LC, Phuong DTM. Chitosan-Modified Biochar and Unmodified Biochar for Methyl Orange: Adsorption Characteristics and Mechanism Exploration. Toxics. 2022;10:500. doi:10.3390/toxics10090500.
» https://doi.org/10.3390/toxics10090500 -
2 Paixão RM, Reck IM, da Silva LHBR, Baptista ATA, Bergamasco R, Vieira MF, Vieira AMS. Discolouration of contaminated water with textile dye through a combined coagulation/flocculation and membrane separation process with different natural coagulants extracted from Moringa oleifera seeds. J Chem Eng. 2021;99:1976-83. doi:10.1002/cjce.23932.
» https://doi.org/10.1002/cjce.23932 -
3 Tavakolian M, Wiebe H, Sadeghi MA, Van De Ven TGM. Dye Removal Using Hairy Nanocellulose: Experimental and Theoretical Investigations. ACS Appl Mater Interfaces. 2020;12:5040-9. doi:10.1021/acsami.9b18679.
» https://doi.org/10.1021/acsami.9b18679 -
4 Tony MA. Central composite design optimization of Bismarck Dye oxidation from textile effluent with Fenton’s reagent. Appl Water Sci. 2020;10:1-9. doi:10.1007/s13201-020-01192-5.
» https://doi.org/10.1007/s13201-020-01192-5 -
5 Zhu MX, Lee L, Wang HH, Wang Z. Removal of an anionic dye by adsorption/precipitation processes using alkaline white mud. J Hazard Mater. 2007;149:735-41. doi:10.1016/j.jhazmat.2007.04.037.
» https://doi.org/10.1016/j.jhazmat.2007.04.037 -
6 Mor S, Chhoden K, Ravindra K. Application of agro-waste rice husk ash for the removal of phosphate from the wastewater. J Clean Prod. 2016;129:673-80. doi:10.1016/j.jclepro.2016.03.088.
» https://doi.org/10.1016/j.jclepro.2016.03.088 -
7 Tavlieva MP, Genieva SD, Georgieva VG, Vlaev LT. Kinetic study of brilliant green adsorption from aqueous solution onto white rice husk ash. J Colloid Interface Sci. 2013;409:112-22. doi:10.1016/j.jcis.2013.07.052.
» https://doi.org/10.1016/j.jcis.2013.07.052 -
8 Sirajudheen P, Poovathumkuzhi NC, Vigneshwaran S, Chelaveettil BM. Applications of chitin and chitosan based biomaterials for the adsorptive removal of textile dyes from water - A comprehensive review. Carbohydr Polym. 2021;273:118604. doi:10.1016/j.carbpol.2021.118604.
» https://doi.org/10.1016/j.carbpol.2021.118604 -
9 Tabassam N, Mutahir S, Khan MA, Khan IU, Habiba U, Refat MS. Facile synthesis of cinnamic acid sensitized rice husk biochar for removal of organic dyes from wastewaters: Batch experimental and theoretical studies. Mater Chem Phys. 2022;288:126327. doi:10.1016/j.matchemphys.2022.126327.
» https://doi.org/10.1016/j.matchemphys.2022.126327 -
10 Mobarak M, Mohamed EA, Selim AQ, Mohamed FM, Sellaoui L, Bonilla-Petriciolet A, et al. Statistical physics modeling and interpretation of methyl orange adsorption on high-order mesoporous composite of MCM-48 silica with treated rice husk. J Mol Liq. 2019;285:116. doi:10.1016/j.molliq.2019.04.116.
» https://doi.org/10.1016/j.molliq.2019.04.116 -
11 FAO. Nota informativa de la FAO sobre la oferta y la demanda de cereales, Plan de acción de la FAO 2022-2025 para la aplicación de la Estrategia de la FAO sobre el cambio climático. FAO. 2023. doi:10.4060/cc7014es.
» https://doi.org/10.4060/cc7014es -
12 Santana Costa JA, Paranhos CM. Systematic evaluation of amorphous silica production from rice husk ashes. J Clean Prod . 2018;192:688-97. doi:10.1016/j.jclepro.2018.05.028.
» https://doi.org/10.1016/j.jclepro.2018.05.028 -
13 Lima AM, Telöken FT, Hermes RH, Moraes JAR, Silva ALE. A casca de arroz como fonte de energia em empresas beneficiadoras do grão. Exacta. 2019;17:375-82. doi:10.5585/exactaep.v17n4.8576.
» https://doi.org/10.5585/exactaep.v17n4.8576 -
14 Sharma P, Kaur R, Baskar C, Chung WJ. Removal of methylene blue from aqueous waste using rice husk and rice husk ash. Desalination. 2010;259:249-57. doi:10.1016/j.desal.2010.03.044.
» https://doi.org/10.1016/j.desal.2010.03.044 -
15 Yan X, Sun Y, Ma C, Kong X, Zhang Y, Tao W. Adsorption of Anionic and Cationic Dyes on Different Biochars. Russ J Phys Chem A. 2021;95:2031-41. doi:10.1134/s0036024421100289.
» https://doi.org/10.1134/s0036024421100289 -
16 Shaban M, Abukhadra MR, Hamd A, Amin RR, Abdel Khalek A. Photocatalytic removal of Congo red dye using MCM-48/Ni2O3 composite synthesized based on silica gel extracted from rice husk ash; fabrication and application. J Environ Manage. 2017;204:189-99. doi:10.1016/j.jenvman.2017.08.048.
» https://doi.org/10.1016/j.jenvman.2017.08.048 -
17 Ahmaruzzaman M, Gupta VK. Rice Husk and Its Ash as Low-Cost Adsorbents in Water and Wastewater Treatment. Ind Eng Chem Res. 2011;50:13589-613. doi:10.1021/ie201477c.
» https://doi.org/10.1021/ie201477c -
18 Steven S, Restiawaty E, Bindar Y. Routes for energy and bio-silica production from rice husk: A comprehensive review and emerging prospect. Renew Sustain Energy Rev. 2021;149:111329. doi:10.1016/j.rser.2021.111329.
» https://doi.org/10.1016/j.rser.2021.111329 -
19 Chandrasekhar S, Pramada PN. Rice husk ash as an adsorbent for methylene blue-effect of ashing temperature. Adsorption. 2006;12:27-43. doi:10.1007/s10450-006-0136-1.
» https://doi.org/10.1007/s10450-006-0136-1 -
20 Ahmad A, Khan N, Giri BS, Chowdhary P, Chaturvedi P. Removal of methylene blue dye using rice husk, cow dung and sludge biochar: Characterization, application, and kinetic studies. Bioresour Technol. 2020;306:123202. doi:10.1016/j.biortech.2020.123202.
» https://doi.org/10.1016/j.biortech.2020.123202 -
21 de Castro AE, da Silva Martinho F, Barbosa ML, Franca JR, Ribeiro-Soares J, Ferreira GMD, et al. Influence of Methyl Groups in Triphenylmethane Dyes on Their Adsorption on Biochars from Coffee Husks. Water Air Soil Pollut. 2022;233:70-8. doi:10.1007/s11270-022-05623-8.
» https://doi.org/10.1007/s11270-022-05623-8 -
22 Pandiarajan A, Kamaraj R, Vasudevan S, Vasudevan S. OPAC (orange peel activated carbon) derived from waste orange peel for the adsorption of chlorophenoxyacetic acid herbicides from water: Adsorption isotherm, kinetic modelling and thermodynamic studies. Bioresour Technol . 2018;261:329-41. doi:10.1016/j.biortech.2018.04.005.
» https://doi.org/10.1016/j.biortech.2018.04.005 -
23 Huang W, Yu X, Li D. Adsorption removal of Congo red over flower-like porous microspheres derived from Ni/Al layered double hydroxide. RSC Adv. 2015;5:84937-46. doi:10.1039/c5ra13922h.
» https://doi.org/10.1039/c5ra13922h -
24 Chirayil J, Cintil J, Lovely M, Thomas S. Isolation and characterization of cellulose nanofibrils from Helicteres isora plant. Rev Adv Mater Sci. 2014;27:20-28. doi:10.1016/j.indcrop.2014.04.020.
» https://doi.org/10.1016/j.indcrop.2014.04.020 -
25 Dorez G, Ferry L, Sonnier R, Taguet A, Lopez-Cuesta JM. Effect of cellulose, hemicellulose and lignin contents on pyrolysis and combustion of natural fibers. J Anal Appl Pyrolysis. 2014;107:323-31. doi:10.1016/j.jaap.2014.03.017.
» https://doi.org/10.1016/j.jaap.2014.03.017 -
26 Tsai WT, Lee MK, Chang YM. Fast pyrolysis of rice husk: Product yields and compositions. Bioresour Technol . 2007;98:22-28. doi:10.1016/j.biortech.2005.12.005.
» https://doi.org/10.1016/j.biortech.2005.12.005 -
27 Binnal P, Kumar DJ, Sasalu Parameshwaraiah M, Patil J. Upgrading rice husk biochar characteristics through microwave‐assisted phosphoric acid pretreatment followed by co‐pyrolysis with LDPE. Biofuels Bioprod Biorefining. 2022;16:1254-73. doi:10.1002/bbb.2392.
» https://doi.org/10.1002/bbb.2392 -
28 Weber K, Quicker P. Properties of biochar. Fuel. 2018;217:240-61. doi:10.1016/j.fuel.2017.12.054.
» https://doi.org/10.1016/j.fuel.2017.12.054 -
29 Keiluweit M, Nico PS, Johnson M, Kleber M. Dynamic Molecular Structure of Plant Biomass-Derived Black Carbon (Biochar). Environ Sci Technol. 2010;44:1247-53. doi:10.1021/es9031419.
» https://doi.org/10.1021/es9031419 -
30 Abdullah H, Mediaswanti KA, Wu H. Biochar as a Fuel: 2. Significant Differences in Fuel Quality and Ash Properties of Biochars from Various Biomass Components of Mallee Trees. Energy Fuels. 2010;24:1972-9. doi:10.1021/ef901435f.
» https://doi.org/10.1021/ef901435f -
31 Qiao Y, He C, Zhang C, Jiang C, Yi K, Li F. Comparison of adsorption of biochar from agricultural wastes on methylene blue and Pb2+. BioResources. 2019;14:9766-80. doi:10.15376/biores.14.4.9766-9780.
» https://doi.org/10.15376/biores.14.4.9766-9780 -
32 Shi J, Fan X, Tsang DCW, Wang F, Shen Z, Hou D, Alessi DS. Removal of lead by rice husk biochars produced at different temperatures and implications for their environmental utilizations. Chemosphere. 2019;235:825-31. doi:10.1016/j.chemosphere.2019.06.237.
» https://doi.org/10.1016/j.chemosphere.2019.06.237 -
33 Severo FF, da Silva LS, Moscôso JSC, Sarfaraz Q, Rodrigues Júnior LF, Lopes AF, et al. Chemical and physical characterization of rice husk biochar and ashes and their iron adsorption capacity. SN Appl Sci. 2020;2:88-94. doi:10.1007/s42452-020-3088-2.
» https://doi.org/10.1007/s42452-020-3088-2 -
34 Srivastava VC, Mall ID, Mishra IM. Characterization of mesoporous rice husk ash (RHA) and adsorption kinetics of metal ions from aqueous solution onto RHA. J Hazard Mater . 2006;134:257-67. doi:10.1016/j.jhazmat.2005.11.052.
» https://doi.org/10.1016/j.jhazmat.2005.11.052 -
35 Jia Y, Shi S, Liu J, Su S, Liang Q, Zeng X, Li T. Study of the Effect of Pyrolysis Temperature on the Cd2+ Adsorption Characteristics of Biochar. Appl Sci. 2018;8:1019. doi:10.3390/app8071019.
» https://doi.org/10.3390/app8071019 -
36 Huang F, Gao LY, Wu RR, Wang H, Xiao RB. Qualitative and quantitative characterization of adsorption mechanisms for Cd2+ by silicon-rich biochar. Sci Total Environ. 2020;731:139163. doi:10.1016/j.scitotenv.2020.139163.
» https://doi.org/10.1016/j.scitotenv.2020.139163 -
37 Muthukrishnan S, Gupta S, Kua HW. Application of rice husk biochar and thermally treated low silica rice husk ash to improve physical properties of cement mortar. Theor Appl Fract Mech. 2019;104:102376. doi:10.1016/j.tafmec.2019.102376.
» https://doi.org/10.1016/j.tafmec.2019.102376 -
38 Naik B, Ghosh N. A Review on Chemical Methodologies for Preparation of Mesoporous Silica and Alumina Based Materials. Recent Pat Nanotechnol. 2009;3:233-44. doi:10.2174/187221009789177768.
» https://doi.org/10.2174/187221009789177768 -
39 Bakar RA, Yahya R, Gan SN. Production of High Purity Amorphous Silica from Rice Husk. Procedia Chem. 2016;19:189-95. doi:10.1016/j.proche.2016.03.092.
» https://doi.org/10.1016/j.proche.2016.03.092 -
40 Hubadillah SK, Othman MHD, Ismail AF, Rahman MA, Jaafar J, Iwamoto Y, et al. Fabrication of low cost, green silica based ceramic hollow fibre membrane prepared from waste rice husk for water filtration application. Ceram Int. 2018;44:10498-509. doi:10.1016/j.ceramint.2018.03.067.
» https://doi.org/10.1016/j.ceramint.2018.03.067 -
41 Costa JAS, Paranhos CM. Systematic evaluation of amorphous silica production from rice husk ashes. J Clean Prod . 2018;192:688-97. doi:10.1016/j.jclepro.2018.05.028.
» https://doi.org/10.1016/j.jclepro.2018.05.028 -
42 Nieva Lobos ML, Sieben JM, Comignani V, Duarte M, Volpe MA, Moyano EL. Biochar from pyrolysis of cellulose: An alternative catalyst support for the electro-oxidation of methanol. Int J Hydrogen Energy. 2016;41:10695-706. doi:10.1016/j.ijhydene.2016.04.041.
» https://doi.org/10.1016/j.ijhydene.2016.04.041 -
43 You X, Wang R, Zhu Y, Sui W, Cheng D. Comparison of adsorption properties of a cellulose-rich modified rice husk for the removal of methylene blue and aluminum (III) from their aqueous solution. Ind Crops Prod. 2021;170:113687. doi:10.1016/j.indcrop.2021.113687.
» https://doi.org/10.1016/j.indcrop.2021.113687 -
44 Mohammadi N, Khani H, Gupta VK, Amereh E, Agarwal S. Adsorption process of methyl orange dye onto mesoporous carbon material-kinetic and thermodynamic studies. J Colloid Interface Sci . 2011;362:457-62. doi:10.1016/j.jcis.2011.06.067.
» https://doi.org/10.1016/j.jcis.2011.06.067 -
45 Adam F, Appaturi JN, Khanam Z, Thankappan R, Nawi MAM. Utilization of tin and titanium incorporated rice husk silica nanocomposite as photocatalyst and adsorbent for the removal of methylene blue in aqueous medium. Appl Surf Sci. 2013;264:718-26. doi:10.1016/j.apsusc.2012.10.106.
» https://doi.org/10.1016/j.apsusc.2012.10.106 -
46 Tran HN, You SJ, Hosseini-Bandegharaei A, Chao HP. Mistakes and inconsistencies regarding adsorption of contaminants from aqueous solutions: A critical review. Water Res. 2017;120:88-116. doi:10.1016/j.watres.2017.04.014.
» https://doi.org/10.1016/j.watres.2017.04.014 -
47 Yusmaniar Y, Erdawati E, Ghifari YF, Ubit DP. Synthesis of mesopore silica composite from rice husk with activated carbon from coconut shell as absorbent methyl orange color adsorbent. IOP Conf Ser Mater Sci Eng. 2020;830:032078. doi:10.1088/1757-899x/830/3/032078.
» https://doi.org/10.1088/1757-899x/830/3/032078 -
48 Li Y, Pan B, Miao H, Xu H, Liu X, Shi G. Single and Binary Dye Adsorption of Methylene Blue and Methyl Orange in Alcohol Aqueous Solution via Rice Husk Based Activated Carbon: Kinetics and Equilibrium Studies. Chem Res Chin Univ. 2020;36:1272-8. doi:10.1007/s40242-020-0063-9.
» https://doi.org/10.1007/s40242-020-0063-9 -
49 Oliveira SP, Silva WLL, Viana RR. Avaliação da capacidade de adsorção do corante azul de metileno em soluçãoes aquosas em caulinita natural e intercalada com acetato de potássio. Cerâmica. 2013;59:338-44. doi:10.1590/s0366-69132013000200021.
» https://doi.org/10.1590/s0366-69132013000200021