 Genetic diversity in Syagrus coronata (Mart.) Becc. (Arecaceae) revealed low genetic differentiation
Abstract
Syagrus coronata is an endemic palm of Brazil, widely distributed in the “Caatinga” and Atlantic Forest domains, with significant socioeconomic and ecological importance. The objective was to estimate the polymorphism in individuals from six locations across “Caatinga” and Atlantic Forest domains, using microsatellite markers and variant detection through sanger sequencing of chloroplast sequences. A diversity panel of 107 accessions revealed the formation of two population groups, suggesting low genetic differentiation between the locations. Most of the genetic variation is found within the samples (89.47% for SSR data and 70.82% for chloroplast data). However, private alleles were found in some populations, suggesting that germplasm bank may include all the populations. We conclude that the genetic diversity of S. coronata is distributed across the two biomes, suggesting that the species has high gene flow, which contributes to conservation strategies.
Keywords:
Ouricuri; palm tree; molecular markers; Brazilian biomes
INTRODUCTION
The conservation of genetic resources has become increasingly necessary for many species due to habitat loss, overexploitation of natural resources, invasive species, pollution, climate change, and other human activities that elevate the risk of extinction. Quantifying genetic diversity and the degree of inbreeding within populations is crucial for assessing relationships among individuals of a species. These genetic parameters are vital for effective planning of genetic resource conservation (Hohenlohe et al. 2020). The ability to estimate genetic diversity parameters has improved with the discovery and development of molecular markers, which have become more accessible to many species following the advent of next-generation sequencing (NGS) technologies. This has led to the availability of various types of molecular markers, such as microsatellites (SSRs - Simple Sequence Repeats) (Hodel et al. 2016, Moura et al. 2017, Maia et al. 2022) and chloroplast sequence polymorphisms (Loera-Sanchez et al. 2019), which are abundant in genomes, easy to analyze, and manageable in terms of data (Thomson 2014).
Syagrus coronata (Mart.) Becc., commonly known as ouricuri or licuri (Noblick 2017), among other denominations, is an endemic palm tree of Brazil with significant socioeconomic and ecological potential. It is extensively used in food production and artisanal crafts (Noblick 2017). Additionally, its fruits are an important food source for native wildlife, particularly the endangered bird Anodorhynchus leari Bonaparte, 1856 (Santos-Neto and Camandaroba 2008). Syagrus coronata is widely distributed across the Atlantic Forest and Caatinga biomes (Noblick 2017, Souza et al. 2018), which are critical regions in Brazil known for their high levels of endemism. However, both biomes have suffered significant habitat fragmentation, leading to a reduction in vegetation cover. The Atlantic Forest retains only 11% to 16% of its original extent (Ribeiro et al. 2009), while the Caatinga has less than 10% of its original area remaining, making it one of the most threatened natural regions in the country (Moro et al. 2016).
Genetic studies on S. coronata have included chloroplast genome sequencing (Áquila et al. 2018), the development of SSR molecular markers (Barbosa and Almeida 2018), and the investigation of its phylogeographic structure in the Atlantic Forest and Caatinga regions (Souza et al. 2018). These phylogeographic studies have uncovered significant genetic variability in haplotypes, indicating high genetic diversity in natural populations, which could be leveraged to develop strategies for establishing germplasm banks. In the present study, we assessed the genetic diversity of S. coronata using SSR molecular markers and sequences of the trnH-psbA intergenic spacer from the chloroplast genome. The objectives were: 1) to identify polymorphisms in microsatellite loci and detect variations in chloroplast genome sequences in S. coronata and 2) to propose strategies for the collection and conservation of the species' genetic resources.
MATERIAL AND METHODS
Plant material and DNA extraction
The plant material comprised leaf samples from mature, uninjured plants collected from six populations: four from the Caatinga (São José da Tapera-AL, Santana do Ipanema-AL, Raso da Catarina-BA, and Água Branca-AL) and two from the Atlantic Forest (Pirambú-SE and Coruripe-AL) (Figure 1 and Table 1). The number of sampled individuals ranged from 13 to 20, all of which were georeferenced (Table 1). The DNA extraction was carried out according to the protocol of Doyle and Doyle (1987), and the integrity and quantity of DNA were measured using a 1% agarose gel and a spectrophotometer, respectively.

PCR and genotyping of microsatellite sequences (SSRs)
DNA amplification was performed for five microsatellite marker loci of the nuclear genome (SYA92, SYA100, SYA116, SYA129, SYA131) using primers developed by Barbosa and Almeida (2018). The PCR reactions were carried out in a volume of 50 µL, with each reaction containing 100-200 ng of DNA, 5 µL of buffer solution (Tris-HCl pH 8.5 and 500 mM KCl), 0.2 mM of each dNTP, 1.5 mM of MgCl2, 0.5 µL of each primer, and 2.5 units of Taq Polymerase. The amplifications were conducted using a thermal cycler (Applied Thermal Cycler Biosystems® 2720) with an initial denaturation at 94 °C for two min, followed by 35 cycles of denaturation at 94 °C for 45 sec, annealing for 30 sec at the specific temperature for each primer, and extension at 72 °C for one min. A final extension at 72 °C for 10 min was performed. The PCR products were analyzed on a 1% agarose gel. For genotyping, 1 µL of the PCR reaction, 0.2 µL of the LIZ600 marker, and 8.8 µL of formamide were used per sample. The products of this reaction were denatured at 95 °C for two min in a thermocycler and genotyped using an ABI3500 automatic sequencer (Applied Biosystems).
PCR and sequencing of cpDNA sequences
Eight regions of the plastid genome were amplified using the primers described by Scarelli et al. (2011) (rpL2, trnH-psbA, rps16-trnQ, trnD-trnT, rbclA1, trnS-trnG, petB-petD and atpB-rbcL). However, only the trnH-psbA region showed polymorphism, and the sequences from this region were used for genotyping by sequencing. DNA amplification followed the same procedure used for microsatellite markers, and the PCR products were sequenced using the BigDye® Terminator v3.1 Sequencing Kit (Applied Biosystems®) on the ABI3500 Genetic Analyzer (Applied Biosystems®).
Data analysis for chloroplast region
The sequences were aligned using MAFFT v.7.017 (Katoh and Standley 2013), and various genetic parameters were calculated, including the Shannon-Wiener (2001) diversity index (H), Stoddart and Taylor's (1987) diversity index (G), Simpson's (Simpson 1949) diversity index (lambda), allele richness and Shannon information measure (Sherwin et al. 2017). These statistics were computed using the poppr R package (Kamvar et al. 2014). The genetic structure analysis was conducted using STRUCTURE 2.3.4 (Hubisz et al. 2009) to estimate population groups (k). This analysis was implemented in the R package strataG (Archer et al. 2016) using an admixture model with a burn-in period of 500,000 and 1,000,000 MCMC iterations. The data were first converted to the genlight format using the gl.read.fasta function from the dartR R package, then further converted to gtypes format using the genlight2gtypes function from strataG. The structure analysis was performed with the command structureRun(data, k.range = 1:4, num.k.rep = 10, numreps = 1,000,000, burnin = 500,000, exec = structure). The groups identified from the STRUCTURE analysis were subsequently used in analysis of molecular variance (AMOVA) conducted with the poppr.amova function from the poppr R package (Kamvar et al. 2014).
Additionally, spatial genetic structure analysis was performed using BPEC (Bayesian Phylogeographic and Ecological Clustering), an R package designed for clustering that integrates geographical data with DNA sequence data to reveal geographical patterns of genetic structuring. The analysis was conducted with the following parameters: maximum number of migration events (maxMig = 5), parsimony relaxation parameter (ds = 0), number of MCMC iterations (iter = 1,000,000), and posterior samples per chain (100,000).
The genetic relationships among the identified haplotypes for each individual were analyzed using principal component analysis (PCA) with the glPca function from the R package adegenet (Jombart 2008). Visualizations were generated using the plot3D and rgl functions from the R package plot3D.
Data analysis for SSR
The number of alleles (Na), observed (H O ) and expected (H E ) heterozygosity, GST (Hedrick 2005), and diversity (Hexp) were analyzed and the frequency of null alleles for each locus was calculated based on Chakraborty and Zhong (1994), implemented in the R PopGenReport 3.0 package (Adamack and Gruber 2017). Genetic diversity parameters were calculated including the Shannon-Wiener diversity index (H), Stoddart and Taylor's index (G), Simpsons diversity index (lambda) (Simpson 1949) and allele richness using the poppr R package (Kamvar et al. 2014).
The genetic structure analysis was performed using STRUCTURE 2.3.4 (Hubisz et al. 2009) to estimate population groups (k), implemented through the R package strataG (Archer et al. 2016). The data were first converted to genind format using the df2genind function from adegenet and subsequently converted to gtypes format using the genind2gtypes function from strataG. The STRUCTURE analysis was executed using the command structureRun(data, k.range = 1:4, num.k.rep = 10, numreps = 1,000,000, burnin = 500,000, exec = structure). The groups identified from the STRUCTURE analysis were further utilized for analysis of molecular variance (AMOVA) using the poppr.amova function from the poppr R package (Kamvar et al. 2014). Principal component analysis (PCA) was also conducted using the glPca function from the adegenet package (Jombart 2008).
Additionally, spatial genetic structure analysis was performed using R Geneland 2.0.9 (Estoup et al. 2007), which estimates population groups by integrating genetic and geographical data to identify geographical structuring. The analysis was conducted with the following parameters: uncorrelated allele frequencies, 1,000,000 MCMC iterations, and a thinning interval of 200. We estimated effective population size (Ne) using the molecular co-ancestry method of Nomura, as implemented in NeEstimator V2.1 (Do et al. 2014).
RESULTS AND DISCUSSION
Chloroplast genetic diversity
Among the amplified regions of the chloroplast genome, only the intergenic spacer region trnH-psbA exhibited polymorphism, spanning a length of 533 nt. This region displayed five polymorphic sites, which, when combined, resulted in nine haplotypes. The haplotypes were identified in Roman numerals ranging from I to IX, where the distribution of haplotypes V and VIII is most frequent in the Atlantic Forest, while the most frequent haplotypes in the Caatinga are IX, V and VII. Although haplotype VIII is present only in the Coruripe population, and haplotype VI is identified solely in the São José da Tapera population, there is a significant sharing of haplotypes across different biomes (I, III, IV, V, VII and IX), suggesting the occurrence of ancestral gene flow between individuals from the Caatinga and Atlantic Forest (Figure 2A).

A. Distribution of trnH-psbA haplotypes, where colors indicate different haplotypes. B, C, and D display allelic distribution for three microsatellite regions. The specified abbreviations refer to the populations: Pop.A (São José da Tapera), Pop.B (Pirambú), Pop.C (Coruripe), Pop.D (Santana do Ipanema), Pop.E (Raso da Catarina), and Pop.F (Água Branca)
The evaluation of genetic diversity in chloroplast DNA sequences, using the H, G, and lambda statistics, shows that the Pirambú population (Atlantic Forest biome) has the highest values compared to other locations. However, the population from Raso da Catarina (Caatinga biome) exhibited greater diversity using the Shannon information. The highest allelic richness was found in the São José da Tapera and Pirambú populations, both with 0.8 (Table 1). It is considered that the presence of gene flow may be a consequence of the efficiency of seed dispersal mechanisms. Although some studies point to A. leari as a seed dispersal agent, this bird apparently does not play this role, as it consumes immature fruits (Andrade et al. 2015). Thus, the most likely mode of seed dispersal in the different biomes was carried out by terrestrial animals and through human activities, transporting the seeds from one place to another (Souza et al. 2018).
Nuclear genetic diversity
For the microsatellite loci, only three showed polymorphism (P92, P129, and P131). The number of alleles found in each population ranged from 15 to 18 alleles, demonstrating significant genetic diversity. Restricted alleles were only absent in population D. The other populations showed exclusive alleles: population A and C had restricted alleles at the locus P130; population B at locus P92; and population E and F at loci P92 and P130 (Figures 2B-D, and Table 1). The levels of genetic diversity were high for all analyzed loci, where the observed heterozygosity (Ho) obtained values greater than 0.67 and the expected heterozygosity (He) values above 0.60, so that Ho>He, revealing an excess of heterozygotes. This occurs when there are more heterozygotes than expected in populations, which can be a sign of mixing between different populations or other evolutionary processes (Stoeckel et al. 2006)
Heterozygosity based on Nei (1978) ranged from 0.60 to 0.74, also suggesting genetic variability. The highest value obtained for GST in the three loci was 0.207, indicating considerable genetic differentiation between the populations (Table 2). Since Hedrick's estimate of GST uses HS (the average within-population heterozygosity) and HT (the total heterozygosity), it is possible to obtain negative values. These negative values can be interpreted as zero, as they do not reflect true biological meaning and are typically considered to be an artifact of the estimation method. The value of null alleles ranged from 0.09 to 0.19 for P129 and P131, respectively, and population F had the highest amplification failure rate (52.6%) at the locus P129, suggesting that the region of this locus might have a genetic alteration in the primer annealing region, preventing the success of the polymerase chain reaction (PCR).
Structuring of genetic diversity
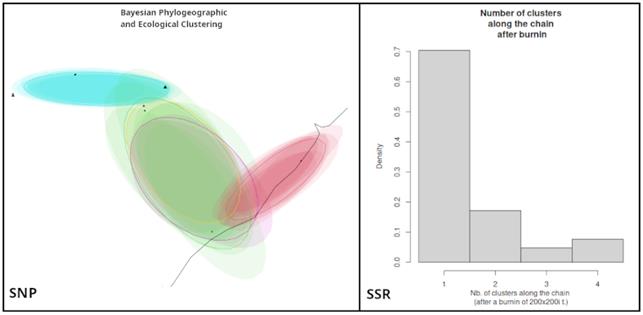
In the organization of genetic diversity, some methods aim to group individuals in a way that maximizes genetic diversity. These methods can rely solely on genetic data; however, they may also incorporate geographical data, enabling a spatial analysis of genetic diversity. In the present study, both approaches were employed. For chloroplast data, we used the BPEC method, while for SSR data, we used the Geneland R package. In both regions, the analysis revealed that genetic diversity is structured into a single population group (Figure 3). On the other hand, when structuring was conducted without considering geographical data, genetic group structuring was detected in both chloroplast data and SSR data (Figure 4). An analysis of molecular variance revealed that the differentiation was small for both markers. For SNP, the diversity between genetic groups accounted for 29.17%, while 70.82% of the diversity was distributed within the groups (Table 3).

The spatial genetic structure was analyzed for both chloroplast and SSR data. The SNP structure was obtained using BPEC, where different colors represent distinct genetic groups, and overlapping colors indicate the absence of distinct structure. The SSR spatial genetic structure was derived using the Geneland R package.

Population genetic structure obtained for chloroplast (A to D) and SSR (E to H) data. A and E the K best groups; B and F distribution of the populations in structure groups. C and G Principal Component Analysis (PCA) revealing a two-dimensional distribution. D and H Minimum spanning network depicting the multilocus distribution in Syagrus coronata.
Analysis of Molecular Variance between groups using sequences data from chloroplast and SSR data
For the microsatellite data, the results suggested that 10.53% of the genetic diversity is distributed between two groups (Table 3), while 89.47% of the genetic diversity resides within groups, implying high gene flow among populations. This conclusion is also supported by the Gst value between the groups (Gst=0.021), suggesting that genetic structuring into groups is low. This result is interesting because S. coronata is distributed across the Caatinga and Atlantic Forest biomes (Souza et al. 2018). However, this evidence suggests that migration of individuals has been recent, which has not led to significant genetic structuring. Genetic structuring in species occurring in these biomes has shown similar results. For example, in Spondias tuberosa (Anacardiaceae), the Caatinga has shown a large genetic group with little diversification (Balbino et al. 2018). Similarly, a study on Hancornia speciosa (Apocynaceae) revealed that individuals from the Atlantic Forest and the Caatinga converged into the same genetic group (Maia et al. 2022). This implies that, for the establishment of germplasm banks, there is no requirement to gather individuals from various populations. This evidence was supported by principal component analysis (PCA) and minimal clustering network, which showed that genetic structuring into two groups is weak, suggesting that genetic variation does not differ between the studied populations (Figure 4).
Conservation of genetic resources
The results obtained in this study allow us to comprehend the distribution of genetic diversity and contribute to genetic conservation programs for the species, along with habitat preservation. The analyses in the six populations, distributed across the Caatinga and Atlantic Forest biomes, allowed us to conclude that the genetic diversity of the species is distributed throughout its range.
Assuming that the ouricuri palm is monoecious, with unisexual flowers (forming a standard distribution, where the pistillate flowers are always between two staminate flowers) (Noblick 2017), and is considered facultative xenogamous, some phenotypic characteristics of the plant may not be maintained due to potential genetic recombination. The formation of seed banks could be feasible, as ouricuri seeds are orthodox, although germination studies in the species are preliminary. However, in situ conservation seems to be the more favorable option, due to the high genetic diversity found within populations, indicating that diversity is widely distributed across the different studied locations. Furthermore, it is suggested to enhance Conservation Units (UCs) that harbor the presence of the ouricuri palm, such as parks (national, state, and municipal), ecological stations, and environmental protection areas (Gomes et al. 2018). In general, it can be said that the knowledge about the importance of conserving S. coronata deserves better dissemination in society, necessitating closer collaboration between rural communities, research institutions, and consumers themselves, aiming to achieve increasingly promising results. Thus, local extractive practices must be taken into account, especially those focused on leaf extraction for artisanal production (Andrade et al. 2015), which are responsible for the livelihood of various communities (Noblick 2017). In this context, understanding leaf harvesting practices can assist in implementing more sustainable measures that contribute to improved conservation strategies (Campos et al. 2018).
ACKNOWLEDGMENTS
We thank the Universidade Federal de Alagoas (UFAL) for the laboratories used and scientific support and the Fundação de Amparo à Pesquisa do Estado de Alagoas (FAPEAL) for funding this project.
Data Availability
The datasets generated and/or analyzed in this study are available from the corresponding author upon reasonable request.
REFERENCES
- Adamack AT, Gruber B2017 PopGenReport: simplifying basic population genetic analyses in R. Methods in Ecology and Evolution 5:384-387
- Andrade WM, Ramos MA, Souto WMS, Bento-Silva JS, Albuquerque UP, Araújo EL2015 Knowledge, uses and practices of the licuri palm (Syagrus coronata (Mart.) Becc.) around protected areas in northeastern Brazil holding the endangered species Lear´s Macaw (Anodorhynchus leari). Tropical Conservation Science 8:893-911
- Áquila R, Silva J, Silva JV and Almeida C2018 The first complete chloroplast genome sequence of Syagrus coronata: comparative analysis in Arecoideae (Arecaceae). Brazilian Journal of Botany 41:393-401
- Archer FI, Adams PE, Schneiders BB2016 strataG: An R package for manipulating, summarizing and analysing population genetic data. Molecular Ecology Resources 17:5-11
- Balbino E, Caetano B, Almeida C2018 Phylogeographic structure of Spondias tuberosa Arruda Câmara (Anacardiaceae): seasonally dry tropical forest as a large and continuous Refuge. Tree Genet Genomes 14:67
- Barbosa SN, Almeida C2018 Genome survey and development of 15 microsatellite molecular markers in Syagrus coronata (Martius) Beccari (Arecaceae) by next-generation sequencing. Brazillian Journal of Botany 42:195-200
- Campos JLA, Araújo EL, Gaoue OG, Albuquerque UP2018 How can local representations of changes of the availability in natural resources assist in targeting conservation? Science of the Total Environment 628:642-649
- Chakraborty R, Zhong Y1994 Statistical power of na exact test of Hardy-Weinberg proportions of genotypic data a multiallelic locus. Human Heredity 44:1-9
- Do C, Waples RS, Peel D, Macbeth GM, Tillett BJ, Ovenden JR2014 NeEstimator V2: re-implementation of software for the estimation of contemporary effective population size (Ne) from genetic data. Molecular Ecology Resources 14:209-214
- Doyle JJ, Doyle JL1987 A rapid DNA isolation procedure for small quantities of fresh leaf tissue. Phytochemical Bulletin 19:11-15
-
Estoup A, Guillot G, Santos F2007 Geneland: simulation and MCMC inference in landscape genetics. R package version 2.0.5. Available at <Available at http:/cran.r-project.org/ >. Accessed on December 20, 2020.
» http:/cran.r-project.org/ - Gomes FM, Ribeiro RTM, Batista MEP, Souza EB, Siqueira Filho JA, Portela S, Castro R, Loiola MIB2018 Syagrus coronata - Licuri. In Coradin L, Camillo J and Pareyn FGC (eds) Espécies nativas da flora brasileira de valor econômico atual ou potencial - plantas para o futuro - região Nordeste. Ministério do Meio Ambiente, Brasília, p. 1056-1072
- Hedrick PW2005 A standardized genetic differentiation measure. Evolution 59:1633-1638
- Hodel RGJ, Segovia-Salcedo C, Landis JB, Crowl AA, Sun M, Liu X, Gitzendanner MA, Douglas NA, Gernam-Aubrey CC, Chen S, Soltis DE, Soltis PS2016 The report of my death was an exaggeration: A review for researchers using microsatellites in the 21st century. Applications in Plants Sciences 4:1600025
- Hohenlohe PA, Funck WC, Rajora OP2020 Population genomics for wildlife conservation and management. Molecular Ecology 30:62-82
- Hubisz MJ, Falush D, Stephens M, Pritchard JK2009 Inferring weak population structure with the assistance of sample group information. Molecular Ecology Resources 9:1322-1332
- Jombart T2008 Adegenet: A R package for the multivariate analysis of genetic markers. Bioinformatics 24:1403-1405
- Kamvar ZN, Tabima JF, Grünwald NJ2014 Poppr: An R package for genetic analysis of populations with clonal, partially clonal, and/or sexual reproduction. PeerJ 2:e281
- Katoh K, Standley DM2013 MAFFT multiple sequence alignment software version 7: Improvements in performance and usability. Molecular Biology and Evolution 30:772-780
- Loera-Sanchez M, Studer B, Kolliker R2019 DNA-based assessment of genetic diversity in grassland plant species: Challenges, approaches, and applications. Agronomy 9:881
- Maia AKS, Terto J, Oliveira IF, Nascimento WF, Almeida C, Silva EF2022 Genetic diversity and structure of Hancornia speciosa Gomes populations characterized by microsatellites markers. Crop Breeding and Applied Biotecnology 22:e38012228
- Moro MF, Lughadha EN, Araújo FS, Martins FR2016 A phytogeographical metanalysis of the semiarid caatinga domain in Brazil. Botanical Review 82:91-148
- Moura RF, Dawson DA, Nogueira DM2017 The use of microsatellite markers in neotropical studies of wild birds: A literature review. Anais da Academia Brasileira de Ciências 89:145-154
- Nei M1978 Estimation of average heterozygosity and genetic distance from a small number of individuals. Genetics 89:583-590
- Noblick LR2017 A revision the genus Syagrus (Arecaceae). Phytotaxa 294:1-262
- Ribeiro MC, Metzger JP, Martensen AC, Ponzoni FJ, Hirota MM2009 The Brazilian Atlantic Forest: How much is left, and now is the remaining forest distributed? Implication for conservation. Biological Conservation 142:1141-1153
- Santos-Neto JR, Camandaroba M2008 Mapeamentos dos sítios de alimentação da arara-azul-de-Lear (Anodorhynchus leari) (Bonaparte, 1856). Ornithologia 3:1-17
- Scarcelli N, Barnaud A, Eiserhardt W, Treier UA, Seveno M, d’Anfray N, Vigouroux Y, Pintaud JC2011 A set of 100 chloroplast DNA primer pairs to study populations genetics and phylogeny in monocotyledons. PLoS ONE 6:e19954
- Shannon CE2001 A mathematical theory of communication. Mobile Computing and Communications Review 5:3-55
- Sherwin WB, Chao A, Jost L, Smouse PE2017 Information theory broadens the spectrum of molecular ecology and evolution. Trends in Ecology &Evolution 32:1-16
- Simpson EH1949 Measurement of diversity. Nature 163:688
- Souza MCP, Moura F, Silva JV, Almeida C2018 Phylogeografhy of the palm Syagrus cononata (Martius) Becarri (Arecaceae): Distribution in the “Caatinga” and Atlantic Forest domains. Brazilian Journal of Botany 41:849-857
- Stoddart JA, Taylor JF1987 Genotypic diversity: Estimation and prediction in samples. Genetics 118:705-711
- Stoeckel A, Grange J, Fernandez-Manjarres JF, Bilger I, Frascaria-Lacoste N, Mariette A2006 Heterozygote excess in a self-incompatible and partially clonal forest tree species - Prunus avium L. Molecular Ecology 15:2109-2118
- Thomson MJ2014 High-throughput SNP genotyping to accelerate crop improvement. Plant Breeding and Biotechnology 2:195-212