 Agronomic performance and cluster analysis of determinate dwarf tomato lines using unsupervised machine learning approach
ABSTRACT
The incorporation of dwarfism genes in tomato breeding has contributed to advancements in genetic improvement, but the compact architecture of dwarf plants presents challenges in germplasm characterization. This study employed unsupervised machine learning techniques to assess the agronomic potential of 21 determinate dwarf tomato lines (spsp/dd) and a control genotype. Conducted in a randomized block design with three replications, the experiment evaluated 14 agronomic traits. Analysis of variance (ANOVA) was performed, with mean comparisons made using the Scott-Knott test. Multivariate analysis, including hierarchical clustering and K-means partitioning, was used to identify genotype groupings. Additionally, Kohonen’s Self-Organizing Map (SOM) was applied for unsupervised classification. The results revealed that the evaluated dwarf lines outperformed the donor parent, highlighting their potential in breeding programs. Specifically, UFU SDd 14 exhibited a superior compact architecture and early, uniform fruit maturation, while UFU SDd 17 combined favorable plant architecture with high yield potential. Unsupervised machine learning clustering techniques effectively formed distinct genotype groups, each based on specific approaches to identifying dissimilarities between lines. The K-means algorithm stood out for its simplicity in implementation and clarity in result interpretation, making it especially useful for exploratory analysis. The SOM method, although more complex, demonstrated greater capacity for exploring extensive datasets, enhancing the potential to identify patterns in high-dimensional contexts.
Index terms:
Solanum lycopersicum L.; dwarfism genes; genetic dissimilarity; process optimization; agricultural technology
RESUMO
A incorporação de genes de nanismo no melhoramento do tomateiro tem contribuído para avanços no melhoramento genético; no entanto, a arquitetura compacta das plantas anãs apresenta desafios na caracterização do germoplasma. Este estudo empregou técnicas de aprendizado de máquina não supervisionado para avaliar o potencial agronômico de 21 linhagens de tomateiro anão de crescimento determinado (spsp/dd) e um genótipo controle. Conduzido em delineamento de blocos ao acaso, com três repetições, o experimento avaliou 14 características agronômicas. Foi realizada análise de variância (ANOVA), com comparação de médias pelo teste de Scott-Knott. A análise multivariada, incluindo agrupamento hierárquico e particionamento pelo método K-means, foi utilizada para identificar agrupamentos de genótipos. Adicionalmente, o Mapa Auto-Organizável de Kohonen (SOM) foi aplicado para classificação não supervisionada. Os resultados revelaram que as linhagens anãs avaliadas superaram o genitor doador, destacando seu potencial em programas de melhoramento. Especificamente, a UFU SDd 14 apresentou arquitetura compacta superior e maturação precoce e uniforme dos frutos, enquanto a UFU SDd 17 combinou arquitetura de planta favorável com alto potencial produtivo. As técnicas de agrupamento baseadas em aprendizado de máquina não supervisionado formaram efetivamente grupos distintos de genótipos, cada um baseado em abordagens específicas para identificar dissimilaridades entre as linhagens. O algoritmo K-means destacou-se pela simplicidade de implementação e pela clareza na interpretação dos resultados, tornando-se especialmente útil para análises exploratórias. O método SOM, embora mais complexo, demonstrou maior capacidade para explorar conjuntos de dados extensos, ampliando o potencial de identificação de padrões em contextos de alta dimensionalidade.
Termos para indexação:
Solanum lycopersicum L.; genes de nanismo; dissimilaridade genética; otimização de processos; tecnologia agrícola
Introduction
Tomato (Solanum lycopersicum L.) is one of the most economically important vegetables worldwide and is extensively cultivated across diverse regions. Brazil ranks as the eighth largest tomato producer globally, with an estimated production of 4.17 million tons. China leads global production, accounting for approximately 70.12 million tons (Food and Agriculture Organization Corporate Statistical Database - FAOSTAT, 2025).
In Brazil, tomato cultivation is predominantly based on cultivars with an indeterminate growth habit, mainly intended for fresh consumption. Cultivars with a determinate growth habit are also used for fresh markets; however, their primary purpose is fruit production for industrial processing. Currently, approximately 19,000 hectares are dedicated to tomato cultivation for industrial processing, resulting in an estimated production of 1.7 million tons (World Processing Tomato Council - WPTC, 2024). This marks a 54.47% increase in cultivated area compared to 2017 (Branthôme, 2017).
The increase in the area planted with determinate growth tomato plants has been attributed to advantages such as easier crop management, reduced labor requirements, concentrated flowering, and greater harvest uniformity (Maciel et al., 2015a), which contribute to more standardized fruit maturation (Luz et al., 2016). Regardless of growth habit, tomato production systems predominantly rely on hybrid seeds derived from crosses between plants with normal architecture to exploit heterosis (Piotto & Peres, 2012).
An alternative approach to investigating heterosis in determinate-growth tomato genotypes remains unexplored, namely the use of dwarf tomato plants with compact architecture as male parents. This strategy has recently been proposed to exploit heterosis in breeding programs for indeterminate-growth tomatoes (Finzi et al., 2017; Pereira et al., 2024a). The use of dwarf plants provides additional advantages for hybrid development, including more compact plant architecture, increased yield, and improved fruit nutritional quality (Finzi et al., 2017; Pereira et al., 2024a). In addition, dwarf plants exhibit enhanced resistance to arthropod pests and phytopathogens, as well as elevated levels of metabolites associated with tolerance to both biotic and abiotic stresses (Finzi et al., 2017; Jacinto et al., 2024; Maciel et al., 2024; Pereira et al., 2024b).
Despite the genetic potential of dwarf tomato plants for hybrid development, there is a need to develop and apply new germplasm evaluation techniques to facilitate the selection of parents with dwarf architecture and determinate growth habit. Due to their small size, the phenotypic characterization of dwarf tomato germplasm with an indeterminate growth habit is already challenging (Gomes et al., 2022; Mattos et al., 2025), and this difficulty is presumably even greater in dwarf plants with a determinate growth habit.
To address this limitation, consolidated germplasm characterization techniques used in other crop species, particularly those based on machine learning, represent a promising alternative (Mahesh, 2020). Machine learning approaches can be applied at various stages of plant breeding programs (Najafabadi, Hesami & Eskandari, 2023) and have been increasingly adopted in agriculture due to their efficiency in supporting the development of new cultivars (Najafabadi et al., 2021). Unsupervised machine learning, a branch of artificial intelligence, aims to identify patterns, structures, or intrinsic relationships within datasets without prior labeling or classifications (Asnicar et al., 2024; Greener et al., 2022). In the context of genetic improvement, this approach enables the identification of groups with shared agronomic characteristics based on germplasm datasets (Mahesh, 2020).
Therefore, the objective of this study was to evaluate the agronomic potential of dwarf tomato lines with a determinate growth habit and to apply unsupervised machine learning techniques to identify genetic dissimilarity among these genotypes.
Material and Methods
Experimental site and plant material
The experiment was conducted from March to August 2024 at the Vegetable Experimental Station (EEH; 873 m altitude, 18°42’43.19” S, 47°29’55.8” W) of the Federal University of Uberlândia (UFU), Monte Carmelo campus, Minas Gerais, Brazil.
The introgression of the self-pruning gene (spsp) into dwarf tomato plants carrying the dwarf gene (dd) and an indeterminate growth habit (SPSP) began in 2022. Hybridization was performed among three lines (UFU-057, UFU- T4R2#4, and UFU- T7A) with normal plant size (Dwarf gene, DD) and determinate growth habit (gene, spsp) and two lines (UFU-DTOM4 41111 and UFU-DTOM 19142121) with dwarf plant size (Dwarf gene, dd) and indeterminate growth habit (gene, SPSP), generating four hybrids.
The agronomic performance of these hybrids was evaluated to select the best one for subsequent self-fertilization and selection of dwarf plants in the following generations. At 30 days after sowing, seedlings exhibiting dwarf (expected proportion of 25%) and normal (75%) phenotypes were identified still in the trays, in accordance with Maciel et al. (2015b). Only seedlings with the dwarf phenotype were retained. To identify dwarf plants with a determinate growth habit, seedlings were maintained in trays, and at 45 days after sowing, plants expressing determinate growth were selected (Pereira et al., 2024b). Two successive self-fertilizations were then carried out, resulting in 21 dwarf tomato lines with a determinate growth habit that were evaluated in this study. In addition to these lines (spsp/dd), the donor parent UFU MC TOM1, characterized by a dwarf size and indeterminate growth habit (SPSP/dd), was included as a control.
Experimental design and crop management
The lines and the donor parent were sown in February 2024 in expanded polystyrene trays with 128 cells filled with a commercial coconut fiber-based substrate. Seedlings were grown in an arch-type greenhouse (7 x 21 meters), with a ceiling height of 4 meters, side curtains covered with anti-aphid mesh, and a transparent polyethylene cover with ultraviolet protection.
At 30 days after sowing, seedlings were transplanted into the soil in a multi-span arched-roof greenhouse (14 x 48 meters), with a ceiling height of 4 meters, anti-aphid side curtains, and 200-micron transparent polyethylene covering with ultraviolet protection. The plants were drip-irrigated using emitters with a flow rate of 1.6 L h-1, operating at pressures between 1 and 4 kgf cm-2, spaced 0.30 m apart.
The experimental design was a randomized complete block design with 22 treatments, three replicates, and a total of 66 plots. Each plot consisted of six plants, of which the four central plants were used for evaluations. Crop management practices followed recommendations for tomato cultivation (Filgueira, 2013). Due to the dwarf growth habit, staking was not required.
Agronomic evaluations
The following agronomic traits were evaluated. Total plant height (TPH) was measured as the distance from the plant collar to the apical meristem. Internode distance (ID) was measured as the distance between nodes. The distance between bunches (DB) was calculated as the ratio of total plant height to the number of bunches. The number of bunches (NB) was determined by counting the bunches per plant, and the height of the first bunch (HFB) was measured as the distance from the plant collar to the first bunch.
Fruit shape (FS) was calculated as the ratio between longitudinal and transverse fruit diameters. Pulp thickness (PT) was defined as the distance from the fruit’s outer surface to the beginning of the locule and was measured in the central region of the fruit using a millimeter-graduated ruler. The number of locules (NL) was determined after horizontal sectioning of the fruit.
The number of fruits per plant (NFP) was calculated as the ratio of the total number of fruits harvested to the number of plants per plot. Average fruit weight (AFW) was obtained as the ratio between fruit mass (g) and the number of fruits. Total soluble solids (BRIX) were measured using an analog refractometer (0-32% scale, 0.2 °Brix resolution).
Production (PROD, kg plant⁻¹) was calculated as the ratio between total harvested fruit mass and the number of plants per experimental plot. The harvest precocity index (PRE) was calculated as the ratio between the production (g plant⁻¹) from the first two harvests and the total fruit production, multiplied by 100. The harvest uniformity index (UNI) was calculated as the ratio between the highest fruit mass obtained in a single harvest and the total fruit mass harvested.
Statistical analysis
Agronomic performance data were subjected to tests of homogeneity of variance (Lilliefors test), normality (Oneill-Mathews test), and additivity (Tukey’s additivity test) to check the assumptions of the analysis. After verification, the data were tabulated and subjected to analysis of variance using the F test (p ≤ 0.05). Treatment means were compared using the Scott-Knott test at the 5% significance level.
Multivariate analysis of genetic dissimilarity among genotypes was performed using the Mahalanobis generalized distance (). Genetic divergence was visualized through a heatmap and a dendrogram constructed using the hierarchical Unweighted Pair-Group Method Using Arithmetic Averages (UPGMA). Cluster validation was assessed using the cophenetic correlation coefficient (CCC), calculated by the Mantel (1967) test. The relative contribution of quantitative traits to genetic divergence was determined according to Singh’s criterion.
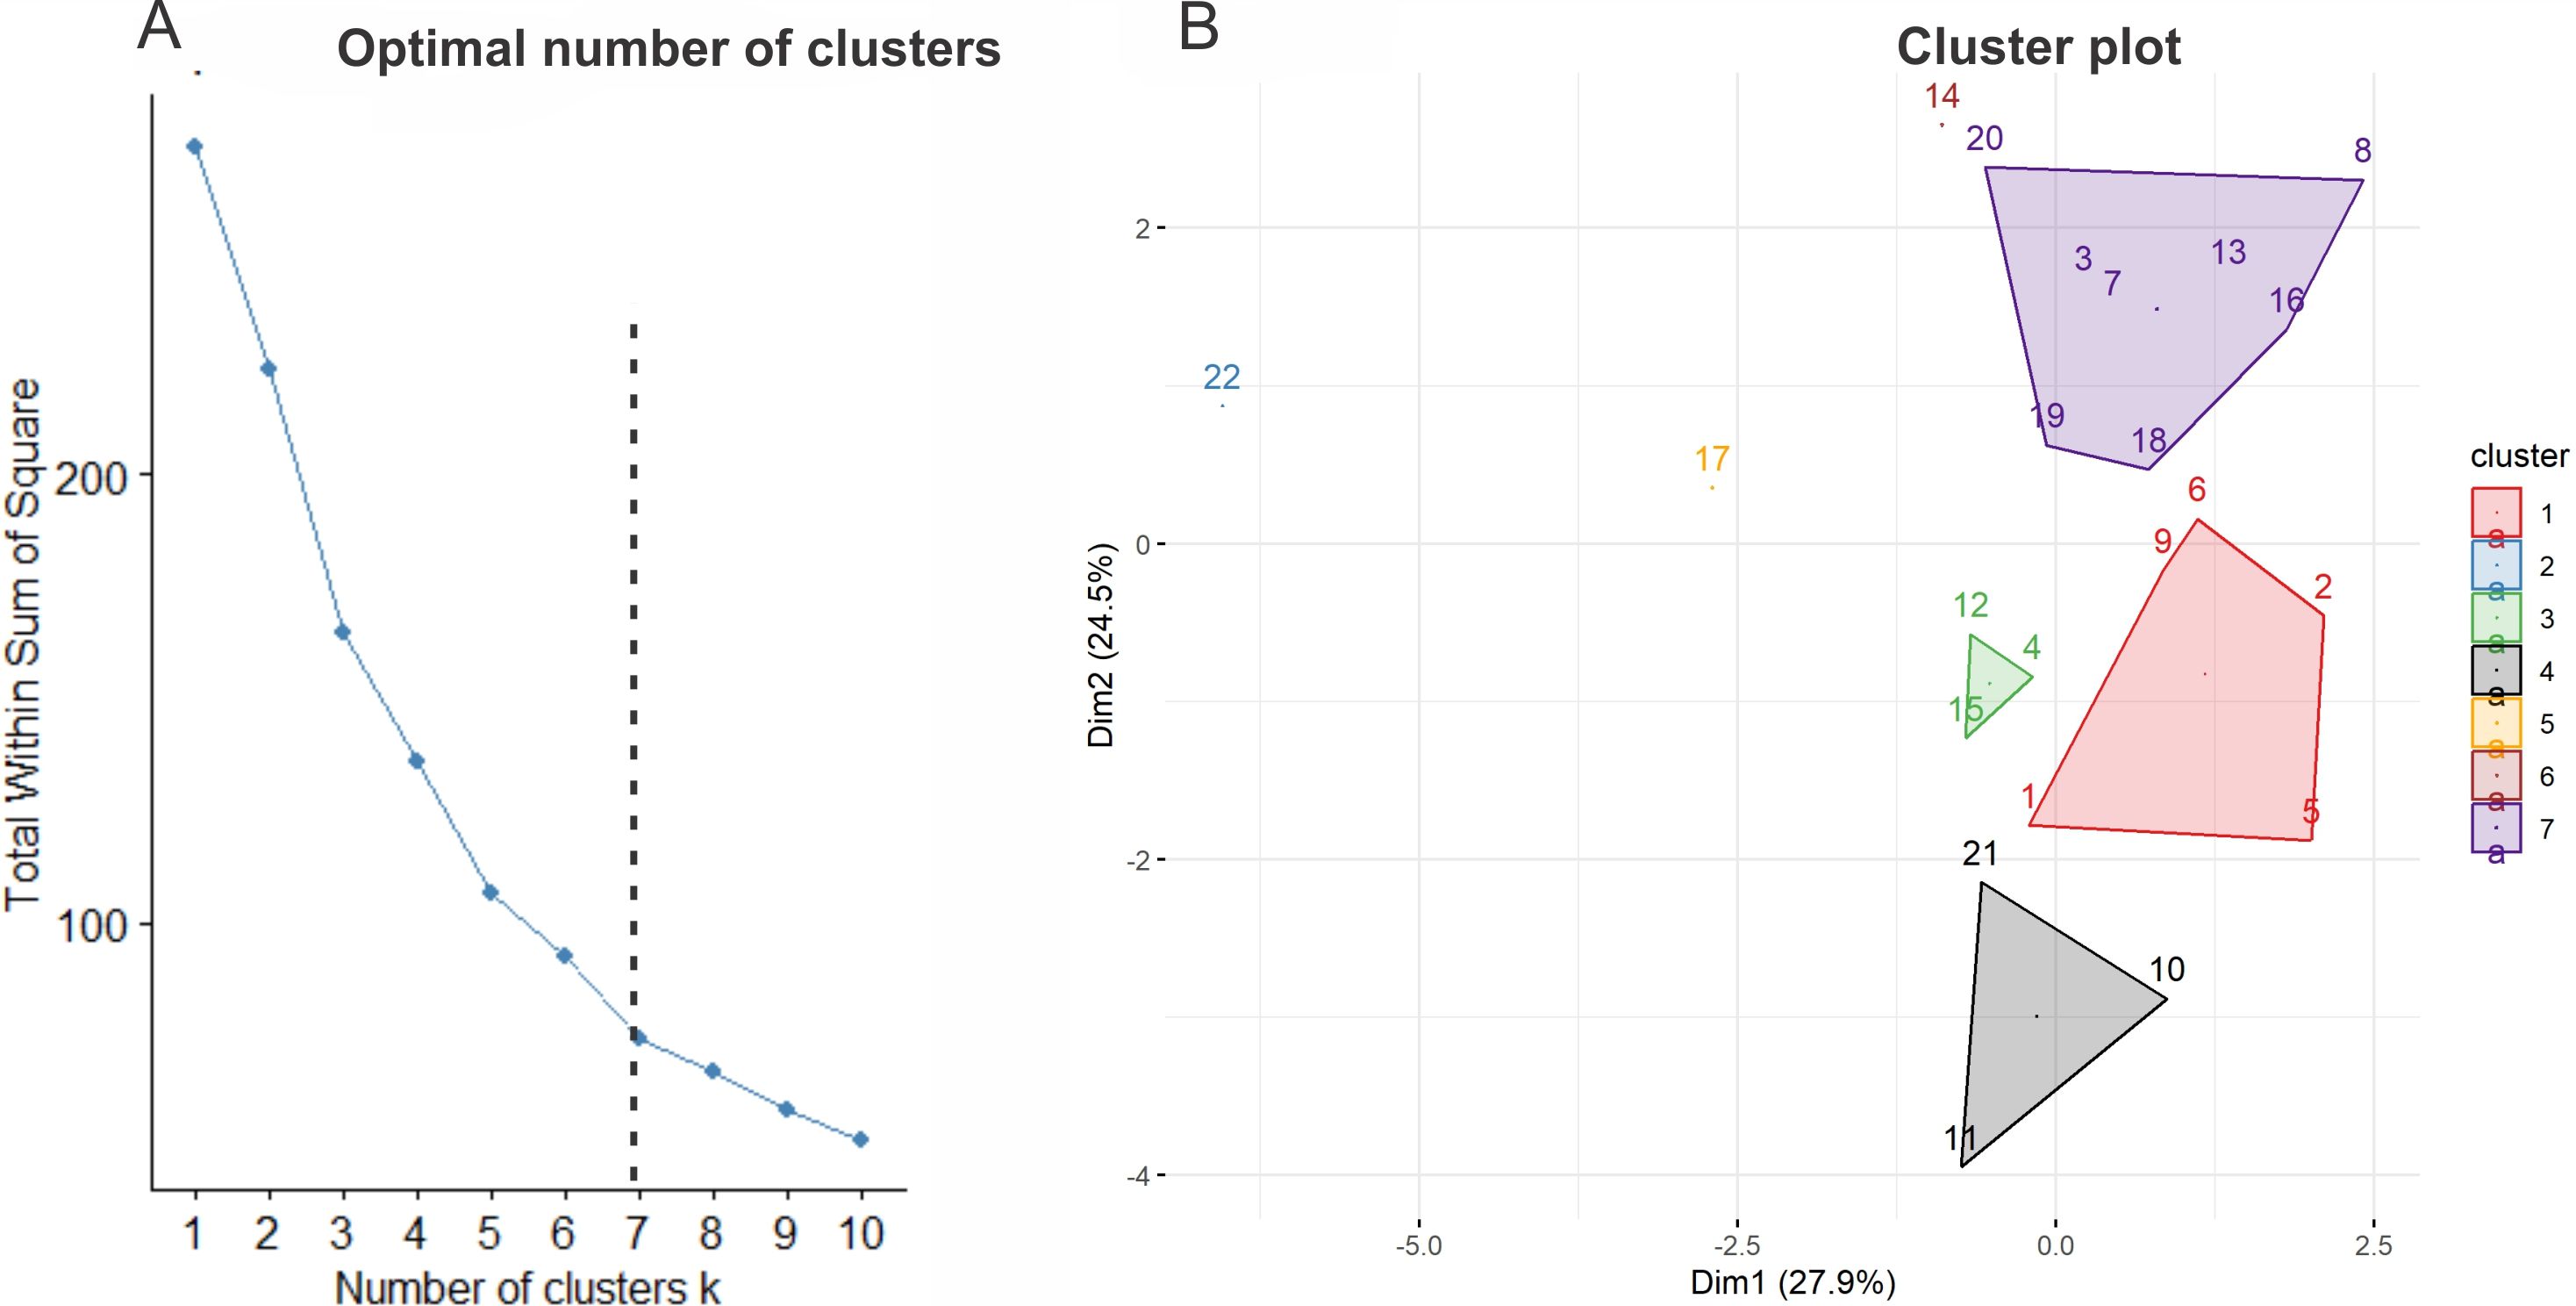
Additionally, the K-means partitional clustering algorithm was applied due to its simplicity in implementation and efficiency in cluster formation. The optimal number of clusters was determined using the elbow method (Bholowalia & Kumar, 2014), resulting in the selection of k=7. This graphical method has been reported as more efficient than other criteria, such as Gap Statistic, Silhouette Coefficient, and Canopy (Yuan & Yang, 2019).
Unsupervised classification was also performed using Kohonen’s self-organizing maps (SOM). The SOM was trained using 4,000 iterations, a neighborhood radius of 1, and a hexagonal topology. A 4 x 4 neuron grid was adopted, as it provided the best balance between topological and quantization errors, which are essential criteria for evaluating the quality of map organization.
All analyses were performed using GENES software v. 1990.2021.131 (Cruz, 2016) and R software v. 4.2.1 (R Core Team, 2025). K-means clustering was executed in R software using the factoextra package (Kassambara & Mundt, 2020), while SOM analysis was conducted using the Kohonen package (Wehrens & Kruisselbrink, 2018). Graphic visualizations were generated using the ggplot2 package (Wickham, 2016).
Results and Discussion
Agronomic performance of the lines
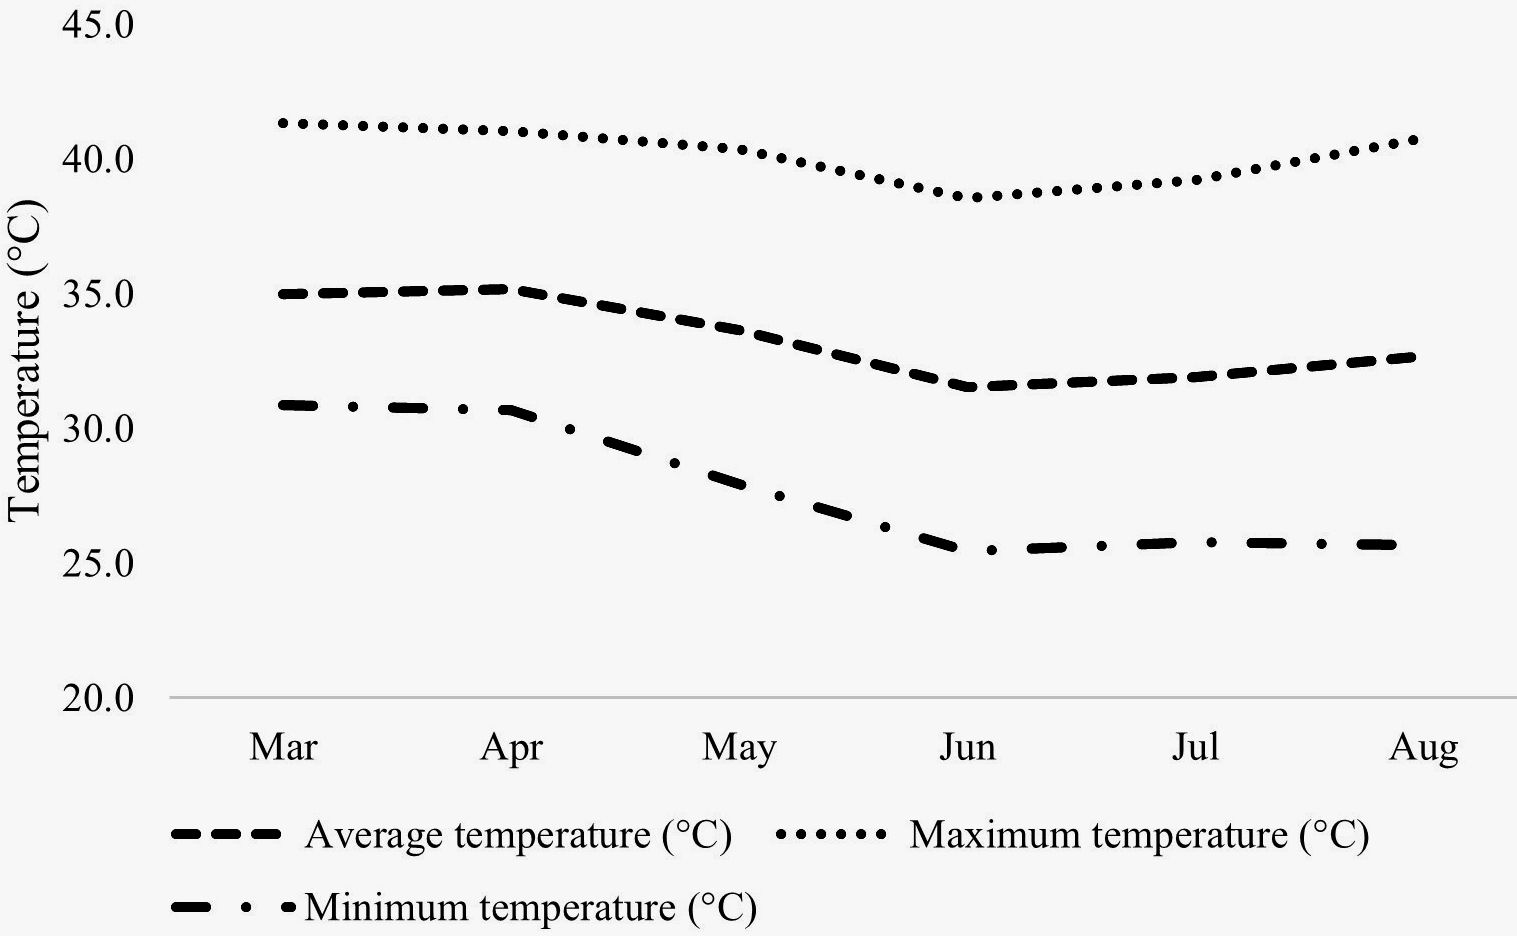
The maximum, average, and minimum temperatures recorded during the experimental period are presented in Figure 1.

Climograph for the experimental period inside the greenhouse in Monte Carmelo, MG, Brazil. Source: Sismet (2025).
The climatic conditions inside the greenhouse during late summer, autumn, and mid-winter were unfavorable for tomato plant development, with maximum and minimum temperatures of 41.4 °C and 25.4 °C, respectively, exceeding the optimal range for the crop (Alvarenga, 2013). Under these conditions, plants experienced thermal stress. Nevertheless, despite the adverse environment, the genotypes were able to express both vegetative and reproductive potential, demonstrating adaptability under stress conditions (Figure 2).

Representation of the 22 treatments evaluated in the study. Genotypes 1-21 correspond to UFU SDd lines, and 22 corresponds to the donor parent UFU MC TOM1.
Significant differences were detected among treatments for all evaluated traits using the Scott-Knott test at the 5% significance level (Figures 3 and 4).

Mean values of plant morphology parameters: total plant height (TPH), internode distance (ID), distance between bunches (DB), number of bunches (NB), and height of the first bunch (HFB). All distances are in cm. Means followed by the same letter do not differ by the Scott-Knott test (p ≤ 0.05). Genotypes 1-21 correspond to UFU SDd lines, and 22 corresponds to the donor parent UFU MC TOM1.

Mean values of fruit and yield traits: fruit shape (FS), pulp thickness (PT), number of fruits per plant (NFP), average fruit weight (AFW), soluble solids content in °Brix (BRIX), production (PROD), harvest precocity (PRE), and harvest uniformity (UNI). Means followed by the same letter do not differ by the Scott-Knott test (p ≤ 0.05). Genotypes 1-21 correspond to UFU SDd lines, and 22 corresponds to the donor parent UFU MC TOM1.
Regarding plant morphology, all evaluated lines exhibited lower total plant height (TPH) than the donor parent UFU MC TOM1 (55.17 cm), confirming the effect of introgressing the self-pruning gene (spsp). UFU SDd 8 showed the lowest plant stature, with a TPH of 18.17 cm. The reduction in plant stature promoted by the determinate growth habit resulted in a compact architecture relative to the indeterminate donor parent (SPSP). Compact plant architecture is advantageous, as plant height has a direct impact on crop management and fruit quality. In indeterminate tomato plants of normal size, apical pruning is commonly adopted to improve yield and bunch quality (Nkansah et al., 2021).
Internode distance (ID) values were generally similar to those observed in the donor parent, UFU-MC TOM1 (2.13 cm). However, several lines (UFU SDd 2, 3, 6, 7, 8, 9, 13, 14, 16, 18, and 20) exhibited reduced internode length, contributing to their compact growth habit. A similar trend was observed for the distance between bunches (DB), which decreased as a direct consequence of reduced internode length and overall plant height. While some lines (UFU SDd 1, 2, 5, 6, 7, 9, 10, 11, and 21) showed greater DB values, most lines and the donor parent UFU-MC TOM1 (6.94 cm) exhibited lower DB values, reinforcing the relationship between plant stature and bunch distribution.
The reduction in plant height also influenced the number of bunches per plant (NB). Although the evaluated lines generally showed fewer bunches than UFU-MC TOM1, this difference is attributable to the indeterminate growth habit and greater plant height of the donor parent. Notably, UFU SDd 17 exhibited a medium plant height and seven bunches, approaching the eight bunches observed in UFU-MC TOM1. This suggests that the reduction in plant size resulting from the introgression of the determinate growth habit enhanced production capacity, as plants with reduced stature exhibited a comparable bunch formation capacity to those with the indeterminate growth habit. Similar effects of reduced plant stature associated with an increased number of bunches per plant have been reported in tomato hybrids derived from dwarf plants with an indeterminate growth habit (Finzi et al., 2017; Pereira et al., 2024a).
Thus, reduced plant size represents an advantageous trait in breeding programs, particularly because it can be transmitted to hybrids, as previously demonstrated in mini tomato hybrids (Finzi et al., 2017) and indeterminate Saladette hybrids (Pereira et al., 2024a).
Another trait strongly affected by determinate growth was the height of the first bunch (HFB). The lines UFU SDd 3 (10.61 cm), UFU SDd 7 (9.36 cm), UFU SDd 8 (10.42 cm), and UFU SDd 16 (8.44 cm) exhibited lower HFB values, whereas UFU-MC TOM1 (16.25 cm) and several lines, including UFU SDd 1 (15.92 cm), UFU SDd 4 (15.87 cm), UFU SDd 5 (15.58 cm), UFU SDd 9 (15.67 cm), UFU SDd 10 (16.58 cm), UFU SDd 11 (17.06 cm), UFU SDd 14 (14.25 cm), and UFU SDd 21 (15.50 cm), showed higher values. Reduced HFB is commonly associated with greater precocity, as compact plants tend to initiate reproductive development earlier. Earlier bunch formation can increase the number of bunches produced and positively affect yield (Dola & Gheller, 2023).
Fruit-related traits and yield performance
Significant differences were also observed among genotypes for fruit-related and yield traits (Figure 4).
Most lines produced elongated fruits with FS values above 1.5, typical of fruits in the Saladette segment (Andrade et al., 2014). However, some lines also produced more rounded fruits, with FS values close to 1.0, indicating morphological variability among lines.
Pulp thickness (PT) was generally higher in the determinate dwarf lines than in UFU MC TOM1, except for UFU SDd 14, which showed values similar to the donor parent (control). The smaller fruit size of UFU MC TOM1 likely contributed to its lower PT. Greater pulp thickness, combined with a reduced number of locules, is associated with increased fruit firmness and longer postharvest shelf life.
Dwarf determinate lines also exhibited higher numbers of fruits per plant (NFP), particularly UFU SDd 17, which produced approximately 37 fruits per plant, compared with 17 fruits in UFU MC TOM1. Although some lines showed NFP values similar to the donor parent, they generally outperformed it.
The average fruit weight (AFW) was another positive highlight among the evaluated lines. With the exception of UFU SDd 14 (18.90 g), all the other lines produced heavier fruits than UFU MC TOM1 (14.94 g), demonstrating the productive potential of the determinate dwarf lines. Lines UFU SDd 2, 5, 10, 11, and 15 produced the largest fruits, with weights exceeding 40 g per fruit.
Regarding soluble solids content, UFU MC TOM1 exhibited the highest °Brix value (8.24 °Brix). Nevertheless, several lines showed °Brix values above 5.0, a threshold considered desirable, including UFU SDd 3 (5.50 °Brix), UFU SDd 14 (5.74 °Brix), UFU SDd 19 (5.83 °Brix), and UFU SDd 20 (5.31 °Brix). Soluble solids content is a key quality trait, as it correlates with sweetness and processing yield (Asri, Dermitas & Ari, 2015; Maciel et al., 2015a). Compact plants have a relatively greater capacity for distributing photoassimilates, which allows for the formation of fruits with higher °Brix levels (Rashid et al., 2016).
In terms of production (PROD), UFU SDd 17 stood out with the highest yield (1.09 kg per plant), whereas lines UFU SDd 6 and UFU MC TOM1 showed the lowest values (0.24 kg per plant and 0.25 kg per plant, respectively). The superior performance of UFU SDd 17 resulted from its high NFP combined with moderate AFW, reinforcing the positive relationship between yield, fruit number, and fruit weight (Diel et al., 2019; Pereira et al., 2024a).
Harvest precocity (PRE) and uniformity (UNI) were also influenced by genotype. UFU SDd 14 line exhibited outstanding precocity, with 91.67% of production concentrated in the first two harvests, corroborated by its high harvest uniformity (UNI) index of 0.39. Other lines, including UFU SDd 1 (0.30), UFU SDd 4 (0.34), UFU SDd 6 (0.40), UFU SDd 11 (0.31), UFU SDd 20 (0.33), and UFU SDd 21 (0.31), also showed high harvest uniformity, indicating concentrated harvest periods. Harvest precocity and uniformity are economically important factors that directly affect a producer’s profitability. Early fruit production can enhance profitability, as fruits are less available in the market at the start of the season, allowing for higher prices. Additionally, harvesting over a shorter period reduces the exposure of plants and fruits to unfavorable weather conditions, as well as the risk of pest and disease attacks (Wamser et al., 2008; Zayat et al., 2022).
Cluster analysis based on unsupervised classification
Following agronomic evaluation, unsupervised clustering techniques were applied to assess genetic dissimilarity among genotypes. The first classification technique employed was hierarchical clustering using the UPGMA method, which resulted in the formation of five distinct clusters (Figure 5).

Dendrogram illustrating genetic dissimilarity among tomato genotypes, obtained using the UPGMA method, Based on total plant height (TPH), internode distance (ID), distance between bunches (DB), number of bunches (NB), height of the first bunch (HFB), fruit shape (FS), pulp thickness (PT), number of fruits per plant (NFP), average fruit weight (AFW), soluble solids content (BRIX), production (PROD), harvest precocity (PRE), and harvest uniformity (UNI).
The cut-off point can be defined based on the specialist’s knowledge of the dataset or by identifying the point at which abrupt changes occur in the dendrogram branches (Cruz et al., 2014). In this study, the cut-off point was determined based on abrupt changes in dendrogram branches. The first cluster consisted solely of the donor parent UFU MC TOM1. The second cluster comprised the lines UFU SDd 1, UFU SDd 2, UFU SDd 4, UFU SDd 5, UFU SDd 6, UFU SDd 9, UFU SDd 10, UFU SDd 11, UFU SDd 12, UFU SDd 15, UFU SDd 18, and UFU SDd 21. The third cluster included only the line UFU SDd 17, while the fourth cluster was formed exclusively by UFU SDd 14. The fifth cluster comprised the remaining lines, namely UFU SDd 3, UFU SDd 7, UFU SDd 8, UFU SDd 13, UFU SDd 16, and UFU SDd 19.
The internal structure of the dendrogram was displayed as a heatmap, in which more intense colors (dark reddish tones) indicated a stronger response of the genotype for the analyzed variable. Genetic dissimilarity between the lines and UFU MC TOM1 can be visualized through contrasts in color intensity across the evaluated variables.
The cophenetic correlation coefficient (CCC) obtained from the clustering analysis was 93.96%, with a distortion of 6.86%. Production was the variable that contributed most to genetic dissimilarity (43.17%), followed by soluble solids content (27.46%). Genetic dissimilarity analyses have been applied in studies involving dwarf plants with an indeterminate growth habit (Finzi et al., 2017; Gomes et al., 2022; Oliveira et al., 2022); however, to our knowledge, no studies have reported the use of this approach in dwarf plants with a determinate growth habit. In the present study, the technique proved effective in identifying genetic dissimilarity among determinate-growth dwarf tomato lines. Nevertheless, this method may present limitations related to dataset size and potential inconsistencies caused by outliers (Barbosa et al., 2011; Lattin, Carroll & Green, 2011; Spanoghe et al., 2020).
Another clustering technique evaluated in this study was the K-means algorithm (Figure 6). With k=7, seven distinct clusters were formed. The genotypes UFU MC TOM1, UFU SDd 14, and UFU SDd 17 were each allocated to individual clusters. Compared with hierarchical clustering, the K-means algorithm resulted in a larger number of clusters, indicating higher genetic dissimilarity among the treatments. Notably, in both hierarchical and partitional approaches, the genotypes UFU MC TOM1, UFU SDd 14, and UFU SDd 17 were consistently grouped into separate clusters, reinforcing the distinctiveness of their characteristics relative to the other genotypes. The standardized means for each cluster were also calculated to assess the contribution of each variable to cluster differentiation (Figure 7).

(A) The elbow graph obtained using the Elbow method with an R-squared base. (B) Graphical representation of the K-means cluster analysis, showing seven distinct clusters. Colors indicate the different clusters, and the convex ellipses represent the dispersion of observations within each cluster, highlighting the similarity structure among the evaluated lines. Genotypes 1-21 correspond to UFU SDd lines, and 22 corresponds to the donor parent UFU MC TOM1.

Standardized means as a function of each cluster, obtained using the K-means algorithm with k=7. Variables included total plant height (TPH), internode distance (ID), distance between bunches (DB), number of bunches (NB), height of the first bunch (HFB), fruit shape (FS), pulp thickness (PT), number of fruits per plant (NFP), average fruit weight (AFW), soluble solids content (BRIX), production (PROD), harvest precocity (PRE), and harvest uniformity (UNI).
UFU MC TOM1, allocated to cluster 2, stood out for the traits TPH, NB, HFB, FS, and BRIX, reflecting high fruit quality due to its soluble solids content, though it exhibited a less compact plant architecture than the determinate lines. The lines present in cluster 1 were characterized by production-related traits, with high values for PROD, NFP, FS, and AFW. Cluster 6, represented by the UFU SDd 14 line, stood out for its plant architecture traits, including lower TPH and ID, which indicated a more compact plant structure. Additionally, cluster 5, represented by the UFU SDd 17 line, displayed a balance between plant morphology and production potential.
Despite its simplicity and efficiency, the K-means algorithm has limitations. The need to predefine the number of clusters (k) reduces analytical flexibility, and sensitivity to outliers can distort centroid positions and influence cluster formation (Fachieri & Suaide, 2025).
After validating the K-means clustering, a third technique was applied using Kohonen’s self-organizing map (SOM). SOM-based cluster analysis allowed the distribution of lines across neurons and facilitated visualization of the contribution of each variable to the classification (Figure 8).

(A) Classification of genotypes based on the number of neurons. (B) Representation of neurons and the relative influence of each variable on them. (C) U-Matrix (Unified Distance Matrix) illustrating dissimilarity between neurons in the SOM, where reddish colors indicate shorter distances and lighter colors indicate greater distances. Variables include total plant height (TPH), internode distance (ID), distance between bunches (DB), number of bunches (NB), height of the first bunch (HFB), fruit shape (FS), pulp thickness (PT), number of fruits per plant (NFP), average fruit weight (AFW), soluble solids content (BRIX), production (PROD), harvest precocity (PRE), and harvest uniformity (UNI). Genotypes 1-21 correspond to UFU SDd lines, and 22 corresponds to the donor parent UFU MC TOM1.
The lines (1-21) and UFU MC TOM1 were distributed across all neuron arrangements, with each neuron containing at least one treatment (Figure 8A). Notably, UFU MC TOM1 was allocated to a single neuron and exhibited the strongest influence for FS, BRIX, TPH, and NB (Figure 8B). Similarly, UFU SDd 17 was allocated to a neuron strongly influenced by the PROD variable.
Based on the Euclidean distances between neurons, the U-matrix (Figure 8C) was constructed as a heatmap representing the distances between neighboring SOM neurons, allowing the identification of five distinct clusters. Color gradients in the U-matrix indicate homogeneous regions and boundaries, facilitating the selection of genotypes with greater genetic dissimilarity. In this analysis, UFU MC TOM1 was positioned in a neuron most distant from all others, indicating the greatest genetic dissimilarity relative to the lines. The lines UFU SDd 14 and UFU SDd 17 were also allocated to separate neurons, highlighting their distinctiveness based on contrasting characteristics.
Kohonen’s self-organizing maps (SOM) allow visualization of the spatial distribution of e germplasm traits, helping to identify which variables contribute most to cluster formation and enabling the selection of lines with high genetic dissimilarity for breeding programs (Oliveira et al., 2021; Sá et al., 2022; Santos et al., 2019). Another advantage of SOM is its capacity to reduce dimensionality while preserving neighborhood relationships, which enhances the exploration of data patterns (Cruz & Nascimento, 2018; Antonucci et al., 2025).
Hierarchical clustering is widely used in breeding programs to explore multivariate data, study genetic dissimilarity, and select promising lines. Similar to K-means, defining the number of clusters (k) in a dendrogram requires prior knowledge of the germplasm or application of criteria such as abrupt changes in branches (Cruz et al., 2014) or Mojena’s (1977) cut-off criterion. Unlike hierarchical clustering and K-means, SOM does not require a predefined number of clusters; only the neuron arrangement must be defined, and clusters self-organize based on the data (Cruz & Nascimento, 2018).
When comparing K-means and SOM results, it is evident that K-means classifies clusters rigidly, without reflecting the proximity between them. In contrast, SOM facilitates the analysis of similarity both within and between clusters, as adjacent clusters may exhibit greater similarity than those located at opposite ends of the map. This relationship is visualized in the dissimilarity matrix formed by SOM (Antonucci et al., 2025; Santos et al., 2019).
Based on these results, future studies could further explore the application of unsupervised clustering in more complex genetic contexts by integrating K-means and SOM with hybrid or deep learning methods. The simplicity and efficiency of K-means can be enhanced by incorporating environmental or epigenetic variables, while the ability of SOM to handle high-dimensional data makes it suitable for multivariate analyses involving large databases.
Conclusions
The dwarf tomato line UFU SDd 14 showed compact architecture, early harvest, and uniform fruit maturation, while UFU SDd 17 combined favorable plant architecture with high yield potential. Unsupervised machine learning clustering methods effectively grouped genotypes. The K-means algorithm proved useful due to its simplicity and ease of interpretation. In contrast, the Self-Organizing Map (SOM) demonstrated greater ability to detect patterns in high-dimensional datasets, providing deeper insight into complex relationships among genotypes for breeding programs.
Acknowledgments
National Council for Scientific and Technological Development (CNPq) grant number 310083/2021-4, the Minas Gerais Research Foundation (FAPEMIG) grant number APQ-03776-25, the Coordination for the Improvement of Higher Education Personnel (CAPES) finance Code 001, and the Federal University of Uberlândia (UFU).
Data Availability Statement
Data available upon request to authors.
References
- Alvarenga, M. A. R. (2013). Tomate: Produção em campo, em casa de vegetação e em hidroponia Lavras: Editora UFLA, 455p.
- Andrade, M. C. et al. (2014). Combining ability of tomato lines in saladette-type hybrids. Bragantia, 73(3):237-245.
- Antonucci, F. et al. (2025). Application of self-organizing maps to explore the interactions of microorganisms with soil properties in fruit crops under different management and pedo-climatic conditions.Sistemas de Solo, 9(10):1-14.
- Asnicar, F. et al. (2024). Machine learning for microbiologists. Nature Reviews Microbiology, 22(4):191-205.
- Asri, F. O., Demirtas, E. I., & Ari, N. (2015). Changes in fruit yield, quality and nutrient concentrations in response to soil humic ac id applications in processing tomato. Bulgarian Journal of Agricultural Science, 21(3):585-591.
- Barbosa, C. D. et al. (2011). Artificial neural network analysis of genetic diversity in Carica papaya L. Crop Breeding and Applied Biotechnology, 11(3):224-231.
-
Bholowalia, P., & Kumar, A. (2014). Ebk-means: A clustering technique based on elbow method and k-means in wsn. International Journal of Computer Applications, 105(9):17-24. https://www.ijcaonline.org/archives/volume105/number9/18405-9674/
» https://www.ijcaonline.org/archives/volume105/number9/18405-9674/ -
Branthôme, F. X. (2017). Brazil: Goiás is the country’s main growing region. Tomato News, Avignon, 16 nov. 2017. Available in: < https://tomatonews.com/brazil-goias-is-the-countrys-main-growing-region/>.
» https://tomatonews.com/brazil-goias-is-the-countrys-main-growing-region/ - Cruz, C. D. et al. (2014). Modelos biométricos aplicados ao melhoramento genético (3ª ed.) Viçosa: Editora UFV, v.2, 668p.
- Cruz, C. D. (2016). Genes Software - extended and integrated with the R, Matlab and Selegen. Acta Scientiarum Agronomy, 38(4):547-552.
- Cruz, C. D., & Nascimento, M. (2018). Inteligência computacional aplicada ao melhoramento genético Editora Viçosa: UFV, 310p.
- Diel, M. I. et al. (2019). Relationship between morpho-agronomic traits in tomato hybrids. Revista Colombiana de Ciencias Hortícolas, 13(1):64-70.
- Dola, A., & Gheller, J. A. (2023). Diferentes tipos de cobertura do solo no plantio de tomate tutorado. Revista Cultivando o Saber, 16(1):78-86.
- Fachieri, D. N., & Suaide, A. A. P. (2025). Introdução a métodos de aprendizado de máquina não supervisionados através de um experimento simples de medidas de densidades de sólidos. Revista Brasileira de Ensino de Física, 47:e20240443.
-
Food and Agriculture Organization Corporate Statistical Database. (2025). Crops and livestock products Available in: <https://www.fao.org/faostat/en/#data/QCL/visualize>.
» https://www.fao.org/faostat/en/#data/QCL/visualize - Filgueira, F. A. R. (2013). Novo manual de olericultura: agrotecnologia moderna na produção e comercialização de hortaliças (3ª ed). Viçosa: UFV, 421p.
- Finzi, R. R. et al. (2017). Growth habit in mini tomato hybrids from a dwarf line. Bioscience Journal, 33(1):52-56.
- Gomes, D. A. et al. (2022). Agronomic potential of BC1F2 populations of Santa Cruz type dwarf tomato plant. Acta Scientiarum.Agronomy, 45:e56482.
- Greener, J. G. et al. (2022). A guide to machine learning for biologists. Nature Reviews Molecular Cell Biology, 23(1):40-55.
- Jacinto, A. C. P. et al. (2024). Reaction of tomato lineages and Hybrids toXanthomonas euvesicatoriapv.perforans Agronomy,14(6):1211.
-
Kassambara, A., & Mundt, F. (2020). Factoextra: Extract and Visualize the Results of Multivariate Data Analyses. R Package Version 1.0.7. https://CRAN.R-project.org/package=factoextra
» https://CRAN.R-project.org/package=factoextra - Lattin, J., Carroll, J. D., & Green, P. E. (2011). Análise de dados multivariados São Paulo: Cengage Learning, 475p.
- Luz, J. M. Q. et al. (2016). Desempenho e divergência genética de genótipos de tomate para processamento industrial. Horticultura Brasileira, 34(4):483-490.
- Maciel, G. M. et al. (2015a). Influência da época de colheita no teor de sólidos solúveis em frutos de minitomate. Scientia Plena, 11(12):1-6.
- Maciel, G. M. et al. (2015b). Ocorrência de nanismo em planta de tomateiro do tipo grape. Revista Caatinga, 28(4):259-264.
- Maciel, G. M. et al. (2024). New insights into the use of dwarf tomato plants for pest resistance. Bragantia, 83:e20240066.
-
Mahesh, B. (2020). Machine learning algorithms - A review. International Journal of Science and Research, 9:381-386. https://www.ijsr.net/archive/v9i1/ART20203995.pdf
» https://www.ijsr.net/archive/v9i1/ART20203995.pdf - Mantel, N. (1967). The detection of disease clustering and a generalized regression approach. Cancer Research, 27(2):209-220.
- Mattos, T. P. et al. (2025). Introgression of dwarfing genes into tomato fruit through backcrossing aiming at salad-type background. Revista Caatinga, 38:e12718.
- Mojena, R. (1977). Hierarchical grouping method and stopping rules: An evaluation. Computer Journal, 20:359-363.
- Najafabadi, M. Y., Hesami, M., & Eskandari, M. (2023). Machine learning-assisted approaches in modernized plant breeding programs. Genes, 14(4):777.
- Najafabadi, M. Y. et al. (2021). Genome-wide association studies of soybean yield-related hyperspectral reflectance bands using machine learning-mediated data integration methods. Frontiers Plant Science, 12:777028.
- Nkansah, G. O. et al. (2021). Influence of topping and spacing on growth, yield, and fruit quality of tomato (Solanum lycopersicum L.) under greenhouse condition. Frontiers in Sustainable Food Systems, 5:777028.
- Oliveira, C. S. et al. (2021). Artificial neural networks and genetic dissimilarity among saladette type dwarf tomato plant populations. Food Chemistry: Molecular Sciences, 3:100056.
- Oliveira, C. S. et al. (2022). Selection of F2RC1 saladette-type dwarf tomato plant populations for fruit quality and whitefly resistance. Revista Brasileira de Engenharia Agrícola e Ambiental, 26(1):28-35.
- Pereira, L. M. et al. (2024a). Additional advantages for agronomic performance and fruit quality in tomato hybrids of the saladette type derived from a dwarf male parent.Horticulturae, 10(11):1145.
- Pereira, L. M. et al. (2024b). Introgression of the self-pruning gene into dwarf tomatoes to obtain salad-type determinate growth lines.Plants, 13(11):1522.
- Piotto, F. A., & Peres, L. E. P. (2012). Base genética do hábito de crescimento e florescimento em tomateiro e sua importância na agricultura. Ciência Rural, 42:1941-1946.
-
R Core Team. (2025) R: A language and environment for statistical computing R Foundation for Statistical Computing, Vienna, Austria, 2025. Available in: <https://www.R-project.or>.
» https://www.R-project.or - Rashid, A. et al. (2016). Effect of row spacing and nitrogen levels on the growth and yield of tomato under walk-in polythene tunnel condition. Pure and Applied Biology, 5(3):426-438.
- Sá, L. G. et al. (2022). Kohonen’s self-organizing maps for the study of genetic dissimilarity among soybean cultivars and genotypes. Pesquisa Agropecuária Brasileira, 57:e02722.
- Santos, I. G. et al. (2019). Self-organizing maps in the study of genetic diversity among irrigated rice genotypes. Acta Scientiarum Agronomy, 41:e39803.
-
Sismet. (2025) Sistema de monitoramento meteorológico Cooxupé - Sismet. Available in: <https://sismet.cooxupe.com.br:9000/dados/estacao/pesquisarDados/?estCooxupe=1&cdEstacao=12>.
» https://sismet.cooxupe.com.br:9000/dados/estacao/pesquisarDados/?estCooxupe=1&cdEstacao=12 - Spanoghe, M. C. et al. (2020). Genetic patterns recognition in crop species using self-organizing map: the example of the highly heterozygous autotetraploid potato (Solanum tuberosum L.). Genetic Resources and Crop Evolution, 67:947-966.
- Zayat, J. Z. M. et al. (2022). Viabilidade econômica da produção de tomate do tipo saladete no Sul do estado de Goiás. Revista Ibero-Americana de Humanidades, Ciências e Educação, 8(6):1455-1486.
- Wamser A. F. et al. (2008). Influência do sistema de condução do tomateiro sobre a incidência de doenças e insetos-praga. Horticultura Brasileira, 26(2):180-185.
- Wehrens, R., & Kruisselbrink, J. (2018). Flexible self-organising maps in kohonen 3.0. Journal of Statistical Software, 87(7):1-18.
-
Wickham, H. (2016). ggplot2: Elegant graphics for data analysis Springer-Verlag New York. https://doi.org/10.1007/978-3-319-24277-4_9
» https://doi.org/10.1007/978-3-319-24277-4_9 -
World Processing Tomato Council - WPTC. (2024). WPTC crop update as of 17 May 2024 Available in: <https://www.wptc.to/wptc-crop-update-as-of-17-may-2024/>.
» https://www.wptc.to/wptc-crop-update-as-of-17-may-2024/ - Yuan, C., & Yang, H. (2019). Research on k-value selection method of k-means clustering algorithm. J, 2(2):226-235.
-
Editor de seção:
Renato Paiva