 Characterization of sweet sorghum genotypes regarding adaptability and stability for biofuel production
ABSTRACT
Sorghum (Sorghum bicolor L. Moench) has significant potential as a raw material in the bioenergy sector. Consequently, sorghum breeding programs have focused on developing cultivars with agronomic, chemical, and industrial traits most suitable for biofuel production and adaptable to diverse climate conditions. This study aimed to evaluate the adaptability and stability of sweet sorghum genotypes intended for biofuel production using Genotype and Genotype by Environment (GGE) biplots and select the most adapted and stable. The experiments were conducted across six environments located in Jaguariúna/SP, Nova Porteirinha/MG, Planaltina/DF, Sete Lagoas/MG, Sobral/CE, and Vilhena/RO. Twenty-five genotypes were assessed in a randomized complete block design with three replications, with plots consisting of two 5-m rows. Tons of stalks per hectare (TSH) (t ha-1), total soluble solids (TSS) (°Brix), and tons of Brix per hectare (TBH) (t ha-1) were analyzed using analysis of variance, GGE biplots, and Scott-Knott test. We found significant differences (p<0.01) for genotype, environment, and genotype×environment interactions. The environments most effective in discriminating the genotypes and their representativeness were Vilhena, Planaltina, and Sete Lagoas for TSS; Vilhena and Sete Lagoas for TSH; and Nova Porteirinha, Vilhena, and Sete Lagoas for TBH. Considering all traits, as well as adaptability and stability, the genotypes with the best performance were CMSXS5042, CMSXS5022, CMSXS5040, and CMSXS5041. Therefore, GGE biplots successfully identified the environments and the most adapted, stable, and promising sorghum genotypes for biofuel production.
Index terms:
Sorghum bicolor L; moench; GGE biplot; sugar-energy sector; plant breeding
RESUMO
O sorgo (Sorghum bicolor L. Moench) possui grande potencial como matéria-prima no setor de bioenergia. Consequentemente, os programas de melhoramento de plantas têm se concentrado no desenvolvimento de cultivares com características agronômicas, químicas e industriais mais adequadas à produção de biocombustíveis e adaptáveis às diversas condições climáticas. O objetivo deste estudo foi avaliar a adaptabilidade e estabilidade de genótipos de sorgo sacarino, visando a produção de biocombustíveis com uso do método GGE biplots para selecionar os mais adaptados e estáveis. Os experimentos foram conduzidos em Jaguariúna/SP, Nova Porteirinha/MG, Planaltina/DF, Sete Lagoas/MG, Sobral/CE e Vilhena/RO. Foram avaliados 25 genótipos em delineamento de blocos casualizados com três repetições, com parcelas de duas linhas de cinco metros. As características avaliadas incluíram toneladas de colmos por hectare (TSH) (t ha-1), sólidos solúveis totais (TSS) (°Brix) e toneladas de Brix por hectare (TBH) (t ha-1). Análises de variância, GGE biplots e teste de Scott-Knott foram realizados para cada característica. Houve diferenças significativas (p<0,01) para os efeitos de genótipo, ambiente e interações genótipo×ambiente. Os ambientes que se destacaram na capacidade de discriminação entre genótipos e sua representatividade foram Vilhena, Planaltina e Sete Lagoas, para TSS; Vilhena e Sete Lagoas, para TSH; e Nova Porteirinha, Vilhena e Sete Lagoas para TBH. Considerando todas as características, bem como adaptabilidade e estabilidade, os genótipos com melhor desempenho foram CMSXS5042, CMSXS5022, CMSXS5040 e CMSXS5041. Portanto, os biplots GGE discriminaram efetivamente os genótipos e ambientes, destacando CMSXS5042, CMSXS5022, CMSXS5040 e CMSXS5041 como adaptados, estáveis e promissores para a produção de biocombustíveis.
Termos para indexação:
Sorghum bicolor L; moench; GGE biplot; setor sucroenergético; melhoramento de plantas
Introduction
Sorghum (Sorghum bicolor L. Moench) is a C4 species that has high photosynthetic and water use efficiency. Unlike other types of sorghum mainly used for animal feed or grain production, sweet sorghum is valued for its ability to accumulate sugar in stalks and leaves, similar to sugarcane (Parrella et al., 2021). Its juice has structurally fermentable sugars (with approximately 89.40% sucrose, 17.58% glucose, and 9.97% fructose) and has gained prominence due to its potential for bioethanol production and other energy products (Reddy et al., 2014; Xue et al., 2023).
Sorghum can grow in various types of biomes and withstand low water availability and low fertility soils, making it an important crop in arid and semi-arid regions with hot and dry climates (Proietti, Frazzoli & Mantovani, 2015). Due to its adaptability to different environments and its potential in several industries, sorghum is considered a sustainable crop, contributing to agriculture diversification, natural resource conservation, and food and energy security (Rao et al., 2016; Pimentel et al., 2017).
Advances in agricultural research and biotechnology have improved the yield and quality of sorghum cultivars, further increasing sorghum’s potential as a crop of economic and sustainable interest. The growing demand for renewable energy sources, natural sugar alternatives, and the plant’s chemical characteristics have continued to drive interest in the development of sorghum cultivars throughout the world (Baloch et al., 2023).
Brazil is a reference for renewable resources in its energy matrix. Although the country has an expressive capacity for sugarcane ethanol production, it faces a challenge in diversifying feedstock (Agência Nacional do Petróleo, Gás Natural e Biocombustíveis - ANP, 2023). In recent years, sweet sorghum has been studied as an attractive alternative, assisting in ethanol production between sugarcane harvest seasons (Barcelos et al., 2016).
Diversifying feedstock for biofuel production presents a significant challenge closely related to advances in plant breeding: the development of cultivars with greater adaptability and stability within Brazil’s highly diverse environmental conditions. Breeding programs focused on bioenergy aim to ensure greater yield and production of biofuels and other agronomic traits of economic importance (Ambaye et al., 2021). In this context, biplots have been used by breeders to select more adapted and stable genotypes, as in the case of Genotype and Genotype by Environment (GGE) biplots proposed by Yan (2001), due to their ease of interpretation (Olivoto & Lúcio, 2020). This methodology is a valuable tool to achieve yield gains and has become indispensable for advancing plant breeding. Through informative figures, GGE biplots show adaptability, interactions, and performance of the evaluated genotypes (Ruswandi et al., 2021).
Studies such as that of Rakshit et al. (2012) have shown the effectiveness of GGE biplot analysis in evaluating sorghum hybrid performance in multiple locations, while Silva et al. (2021) highlighted the ability of GGE biplots in identifying mega-environments for sorghum in Brazil. In addition, Dang et al. (2024) emphasized that GGE biplots have advantages over other models, such as Additive Main Effects and Multiplicative Interaction, in identifying genotypes with high yield and stability, as well as in evaluating their adaptability in each environment. Therefore, applying GGE biplots has allowed more accurate analysis of genotype-environment interactions and assisted in developing more productive sorghum cultivars adapted to different environmental conditions.This study aimed to evaluate the adaptability and stability of sweet sorghum genotypes intended for biofuel production in Brazil via GGE biplots and select the most adapted and stable ones.
Material and Methods
Evaluated genotypes
We evaluated 16 hybrids (H1 to H16) and seven inbred lines (L17 to L23) of sweet sorghum developed by the Sorghum Breeding Program of Embrapa Maize and Sorghum, with two commercial varieties (BRS508 and BRS511) used as control cultivars (Table 1). The genotypes differ regarding their sensitivity to photoperiod and life cycle (Table 1).
Sensitivity to photoperiod and life cycle of 25 sweet sorghum genotypes evaluated in Jaguariúna/SP, Nova Porteirinha/MG, Planaltina/DF, Sete Lagoas/MG, Sobral/CE, and Vilhena/RO in the 2021/2022 crop season.
Evaluated environments
The experiments were conducted in six environments in the Southeast (Jaguariúna/SP, Nova Porteirinha/MG, and Sete Lagoas/MG), Center-West (Planaltina/DF), North (Vilhena/RO), and Northeast (Sobral/CE) regions of Brazil, in the 2021/2022 crop season (Table 2). The sowing and harvest dates were determined according to the recommendations for the crop in each region (Table 2).
Geographic location of the environments, sowing and harvest dates, and mean life cycle of the genotypes evaluated in the 2021/2022 crop season.
Planning and conducting the experiments
The experimental areas were plowed and disked under conventional soil management two days before sowing. Then, the sowing rows were marked off and fertilizer (50 kg ha-1 of the formulation 08-28-16 + boron and 50 kg ha-1 of FTE BR12®) was applied at planting and nitrogen topdressing (200 kg ha-1 of urea) at 20 days after sowing. At 15 days after emergence, plants were thinned to allow a stand of eight plants per linear meter. Weed control was carried out after sowing through a selective herbicide with systemic action of the triazine chemical group: Atrazine®, at the dose of 3.0 kg ha-1 of the active ingredient, which was complemented by manual hoeing. The experiments were conducted under dryland/rainfed conditions. Supplemental irrigation was used only to prevent loss of the experiment or when this was a standard practice in the production system used (dryland areas).
A randomized complete block experimental design with three replications was used. Plots consisted of two 5-m rows at a 0.70 m spacing in Jaguariúna/SP, Sete Lagoas/MG, and Nova Porteirinha; while in Narandiba/SP, Sobral/CE, and Vilhena/RO, the between-row spacing was 0.45, 0.75, and 0.6 m, respectively. Uniformly distributed seeds sufficient for two rows were sown to a depth of 3 to 4 cm. Seeds were sown mechanically using a conventional planter with fertilizer application.
The traits evaluated in each experiment were tons of stalks per hectare (TSH, in t ha-1), obtained by weighing all the plants in the plot, expressed in kg on a digital scale, with later conversion to tons per hectare, according to the between-row spacing adopted in each location; total soluble solids (TSS, in ºBrix), determined on a digital refractometer from the juice extracted from eight stalks randomly harvested from each plot; and tons of Brix per hectare (TBH, in t ha-1), calculated by the formula .
Statistical analyses
Initially, analyses of variance were carried out for each environment, and the normality and homogeneity of the residual variances were checked according to the following model (Equation 1):
Where Y ij is the observed value of the i-th genotype in the j-th block; μ is the constant associated with all the observations; b j is the fixed effect of the j-th block; g i is the fixed effect of the i-th genotype; and ε ij is the random effect of the error in which , where is the error variance.
After that, the homogeneity of the error variances of each environment was checked by the ratio between the highest and lowest mean square error (Tessema, Mohammed & Abebe, 2020). Based on that, a joint analysis of variance was carried out according to the following model (Equation 2):
Where Y ijk is the observed value of the i-th genotype in the k-th block in the j-th environment; μ is the constant associated with all the observations; g i is the fixed effect of the i-th genotype; a j is the fixed effect of the j-th environment; ga ij is the fixed effect of the interaction of the i-th genotype with the j-th environment; b/a jk is the fixed effect of the k-th block within the j-th environment; and ε ijk is the random effect of the error where .
Adaptability and stability were analyzed by the GGE biplot method (Yan, 2001) according to the following model (Equation 3):
Where Y ij is the observed value of genotype i in environment j; μ is the constant associated with all the observations; β j is the main effect of environment j; y 1 and y 2 are the errors associated with the first (PC1) and second (PC2) principal component, respectively; εi1 and εi2 are the values of PC1 and PC2, respectively, for the genotype i; pj1 and pj2 are the values of PC1 and PC2, respectively, for the environment j; and ε ij is the error associated with the i-th genotype and with the j-th environment (Yan et al., 2000).
Analyses of variance and the GGE biplots were carried out through the R software, using the functions “anova_ind” (individual anovas), “anova_joint” (joint anova), and “gge” (GGE biplots) of the metan package (Oliveira et al., 2022). The Scott-Knott (1974) test was performed using the GENES software (Cruz, 2013), and the graphs were made with the mean values generated by the ggplot2 package (Wickham, 2016). Experimental accuracy was checked by the experimental coefficient of variation (CVe).
Results and Discussion
The ratio between the highest and lowest residual mean square was less than seven for all traits evaluated, showing that the residual variances are homogeneous, a suitable condition for the use of joint analysis of variance according to Tessema, Mohammed and Abebe (2020). The experimental coefficient of variation (CVe) was medium and showed good experimental accuracy according to Pimentel-Gomes (2009) for TSS (11.50%), TSH (13.80%), and TBH (19.27%) (Table 3).
Summary of the joint analysis of variance for total soluble solids (TSS, in %), tons of stalks per hectare (TSH, in t ha-1), and tons of Brix per hectare (TBH, in t ha-1) of 25 sweet sorghum genotypes evaluated in Jaguariúna/SP, Nova Porteirinha/MG, Planaltina/DF, Sete Lagoas/MG, Sobral/CE, and Vilhena/RO in the 2021/2022 crop season.
In the joint analysis of variance, we observed a significant difference (P < 0.01) for the genotype effect for all the traits evaluated, indicating differences among the lines and hybrids evaluated for these traits (Table 3). The environmental effect was also significant (P < 0.01), indicating variation in the environmental conditions among the locations where the experiments were conducted. That may have occurred due to environmental differences in soil type, climate, altitude, geography, and crop cycle (Table 2). The mean values for TSH among the locations ranged from 40.15 t ha⁻¹ in Jaguariúna to 97.58 t ha⁻¹ in Planaltina, and locations with higher accumulated rainfall achieved green mass production above 70 t ha⁻¹ (Table 2). The highest value for SST was obtained in Nova Porteirinha (17.94 ºBrix) likely due to the high temperatures recorded at this location, which influence this trait (Regassa; Wortmann, 2014). Bogapov et al. (2024) evaluating sweet sorghum genotypes observed higher biomass yields in areas with moderate humidity and heat, identifying these conditions as key factors in selecting cultivars and hybrids with a shorter vegetation period. Although sorghum possesses intrinsic mechanisms of drought tolerance, unlike maize and wheat, stress at different stages of plant development (e.g., flowering, grain filling, and vegetative growth) can significantly impact yield and productivity (Munarti et al., 2022).
The effect of the genotype × environment (G×E) interaction was significant (P < 0.01) for all traits (Table 3), indicating that the response of the genotypes did not coincide in the environments tested. The G×E interaction has been observed in several studies with sorghum (Botelho et al., 2021; Pereira et al., 2022, Lombardi et al. 2024) and is a challenge for developing new cultivars. Hassan, Ahmed and Rashed, (2022) working with sorghum performance demonstrated the importance of adapting technologies to study the variability among genotypes in terms of water stress in low humidity locations. Thus, various means of mitigating the interaction have been adopted by breeders; the most used is the identification of cultivars with greater phenotypic stability and adaptability (Rao et al., 2016; Bernardo, 2020). In the present study, multivariate analysis (GGE biplots) proposed by Yan (2001) was used to exploit the adaptability and stability of the hybrids and lines in the different locations.
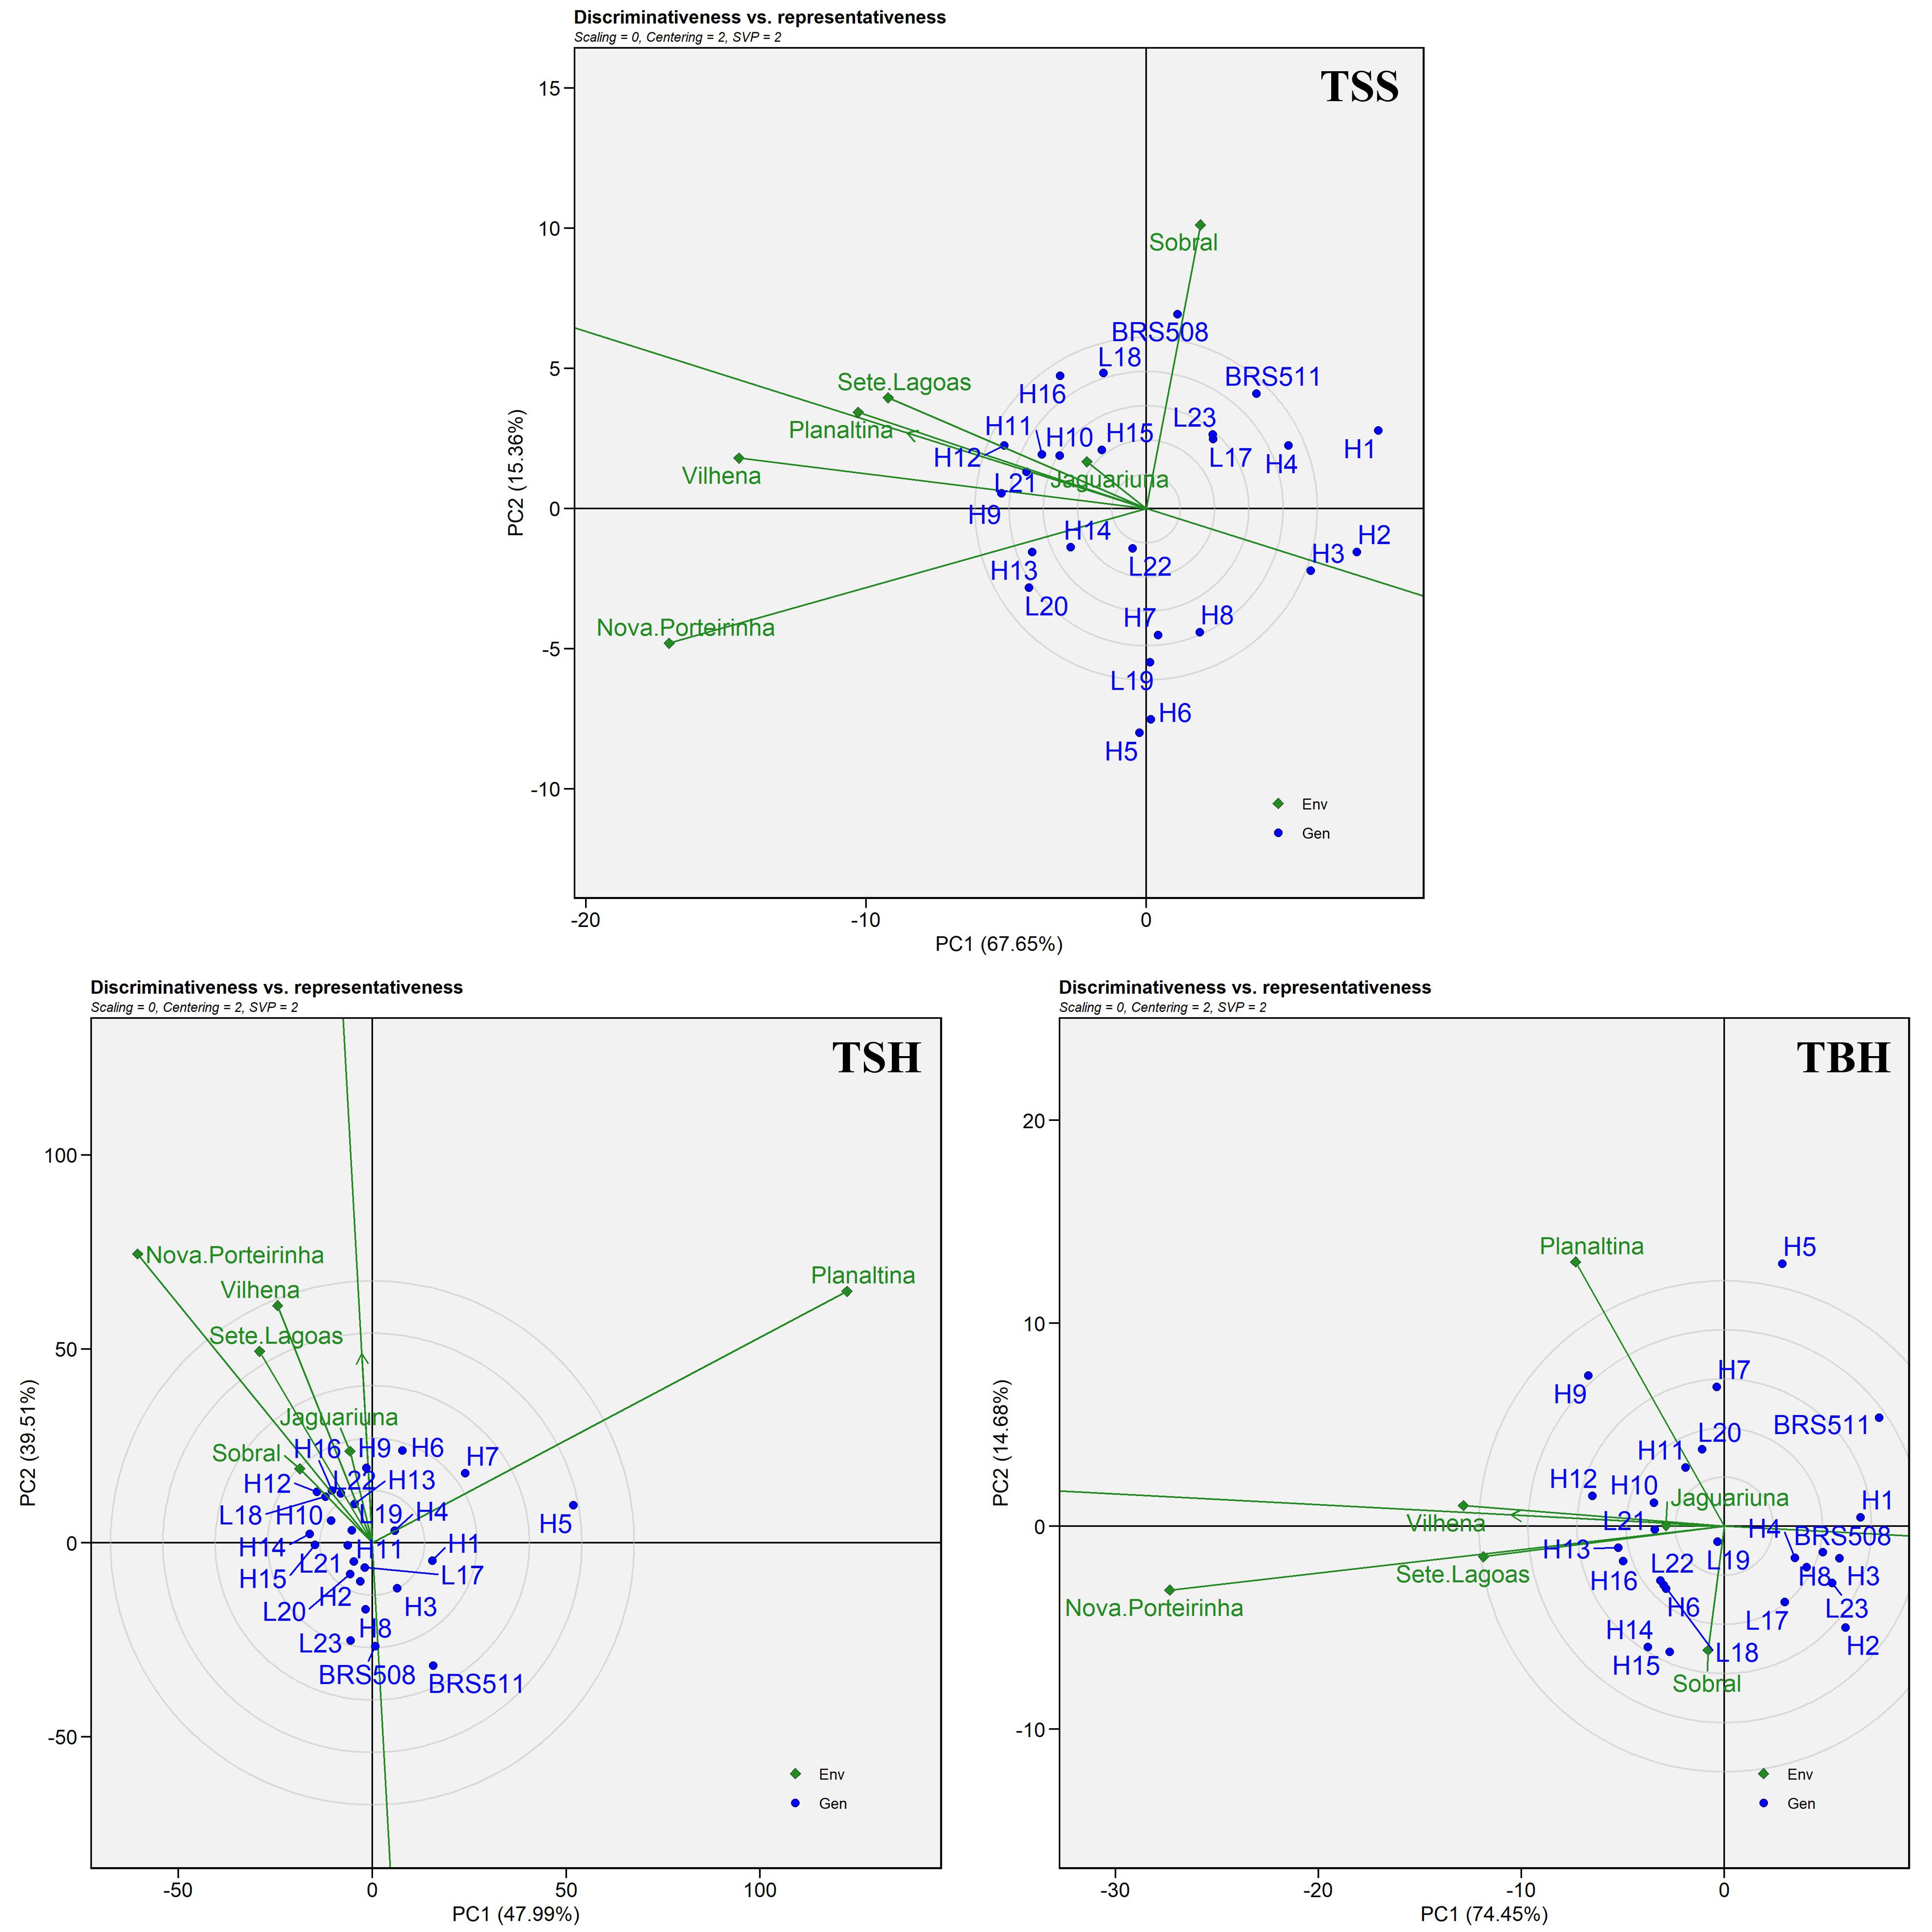
The GGE biplots explain the variation in genotypes and the G×E interaction through principal components. The largest eigenvalues of PC1 and PC2 represented together 83.01% (TSS), 87.50% (TSH), and 89.13% (TBH) of the total variation (Figure 1). Thus, the GGE biplots explained a large proportion of the sum of squares of genotypes and the G×E interaction; therefore, they can be used to study sweet sorghum genotypes. This methodology has been widely applied in studies with sorghum (Figueiredo et al., 2015; Rifka; Breed, 2020; Silva et al., 2022).
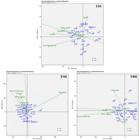
GGE “discriminativeness vs. representativeness” biplot for total soluble solids (TSS, in %), tons of stalks per hectare (TSH, in t ha-1), and tons of Brix per hectare (TBH, in t ha-1) for 25 sweet sorghum genotypes evaluated in Jaguariúna/SP, Nova Porteirinha/MG, Planaltina/DF, Sete Lagoas/MG, Sobral/CE, and Vilhena/RO in the 2021/2022 crop season.
The GGE biplot “discriminativeness vs. representativeness” is related to the environments tested (Figure 1). Two important points should be considered when interpreting the results of this graph. First, the solid line with the arrow indicates the axis of the mean environment. The angle between this line and the environment vector shows the representativeness of each environment, with smaller angles indicating the most representative ones. Furthermore, the length of the environment vector relative to the 0 axis indicates the ability of a particular environment to discriminate genotypes, in which longer vectors indicate more discriminating environments. Therefore, for TSS, Nova Porteirinha, Sobral, and Vilhena had the most significant vector length; consequently, they were the most discriminating for that trait (Figure 1). Nevertheless, Nova Porteirinha and Sobral had the greatest angles relative to the mean environment and were thus the least representative. For TSS, Planaltina, Sete Lagoas, Jaguariúna, and Vilhena were the most representative. Planaltina and Nova Porteirinha were the most discriminating environments for TSH and TBH. However, Planaltina was not representative of either of the two traits. The most representative environments for the production traits (TSH and TBH) were Jaguariúna and Vilhena. When we simultaneously consider the ability to discriminate genotypes and the representativeness, the environments that most stood out were Vilhena, Planaltina, and Sete Lagoas (TSS), Vilhena and Sete Lagoas (TSH), and Nova Porteirinha, Vilhena, and Sete Lagoas (TBH). Thus, these locations are suitable environments for the selection of adapted and stable genotypes for the evaluated traits.
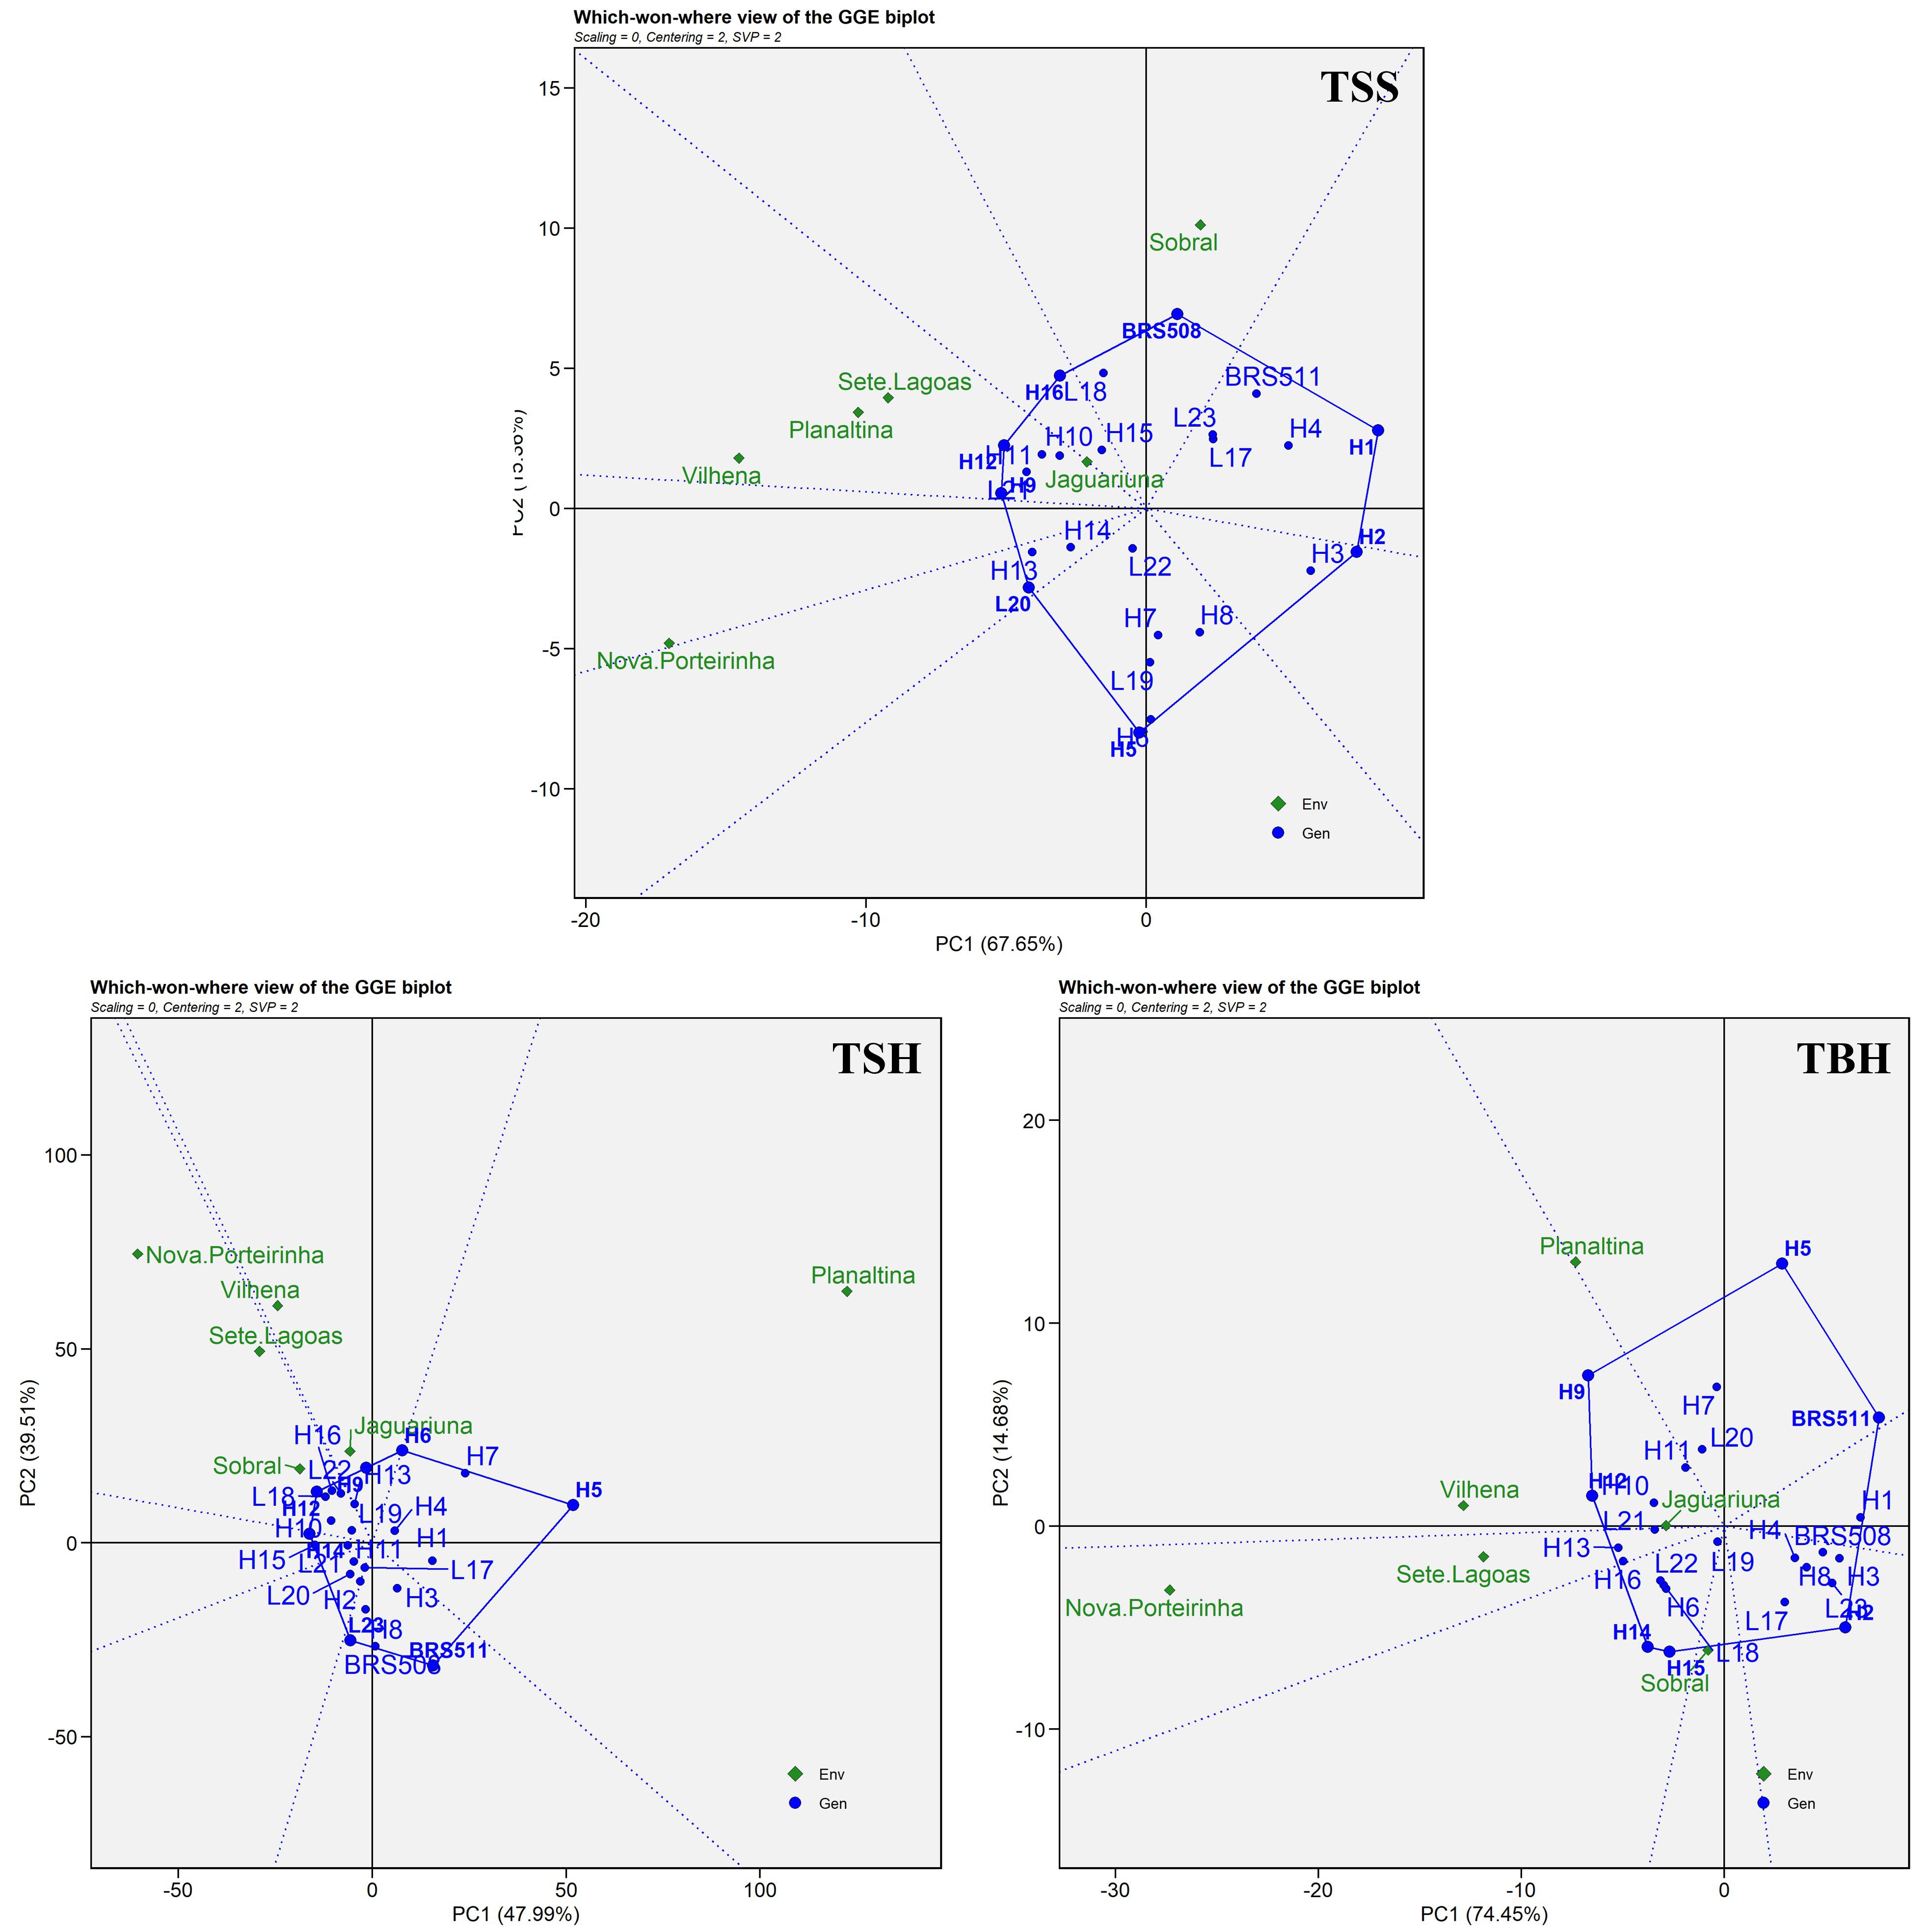
The GGE biplot represented by “which-won-where” (Figure 2) shows the superiority of sorghum genotypes in specific environments. The vertices of the polygon (TSS: H9, H12, H16, and BRS 508; TSH: H6, H9, and H12; and TBH: H5, H9, H12, H14, H15, and BRS 511) represent the genotypes most responsive to the environments located within the sectors formed by the dashed blue lines that form right angles with the solid blue lines (adjacent to the vertex). These genotypes are best suited for specific recommendations because they may do better or worse in one or more environments. The other genotypes at the vertices (TSS: H1, H2, H5, and L20; TSH: H5, H14, L23, and BRS 511; and TBH: H2, H14, and H15) were not clustered in any environment. Therefore, they are more unfavorable for the environments being tested. In contrast, the genotypes within the polygon and within sectors that contain the environments are less responsive to environmental stimuli and more suitable for environments with broad adaptation.

GGE “which-won-where” biplot for total soluble solids (TSS, in %), tons of stalks per hectare (TSH, in t ha-1), and tons of Brix per hectare (TBH, in t ha-1) for 25 sweet sorghum genotypes evaluated in Jaguariúna/SP, Nova Porteirinha/MG, Planaltina/DF, Sete Lagoas/MG, Sobral/CE, and Vilhena/RO in the 2021/2022 crop season.
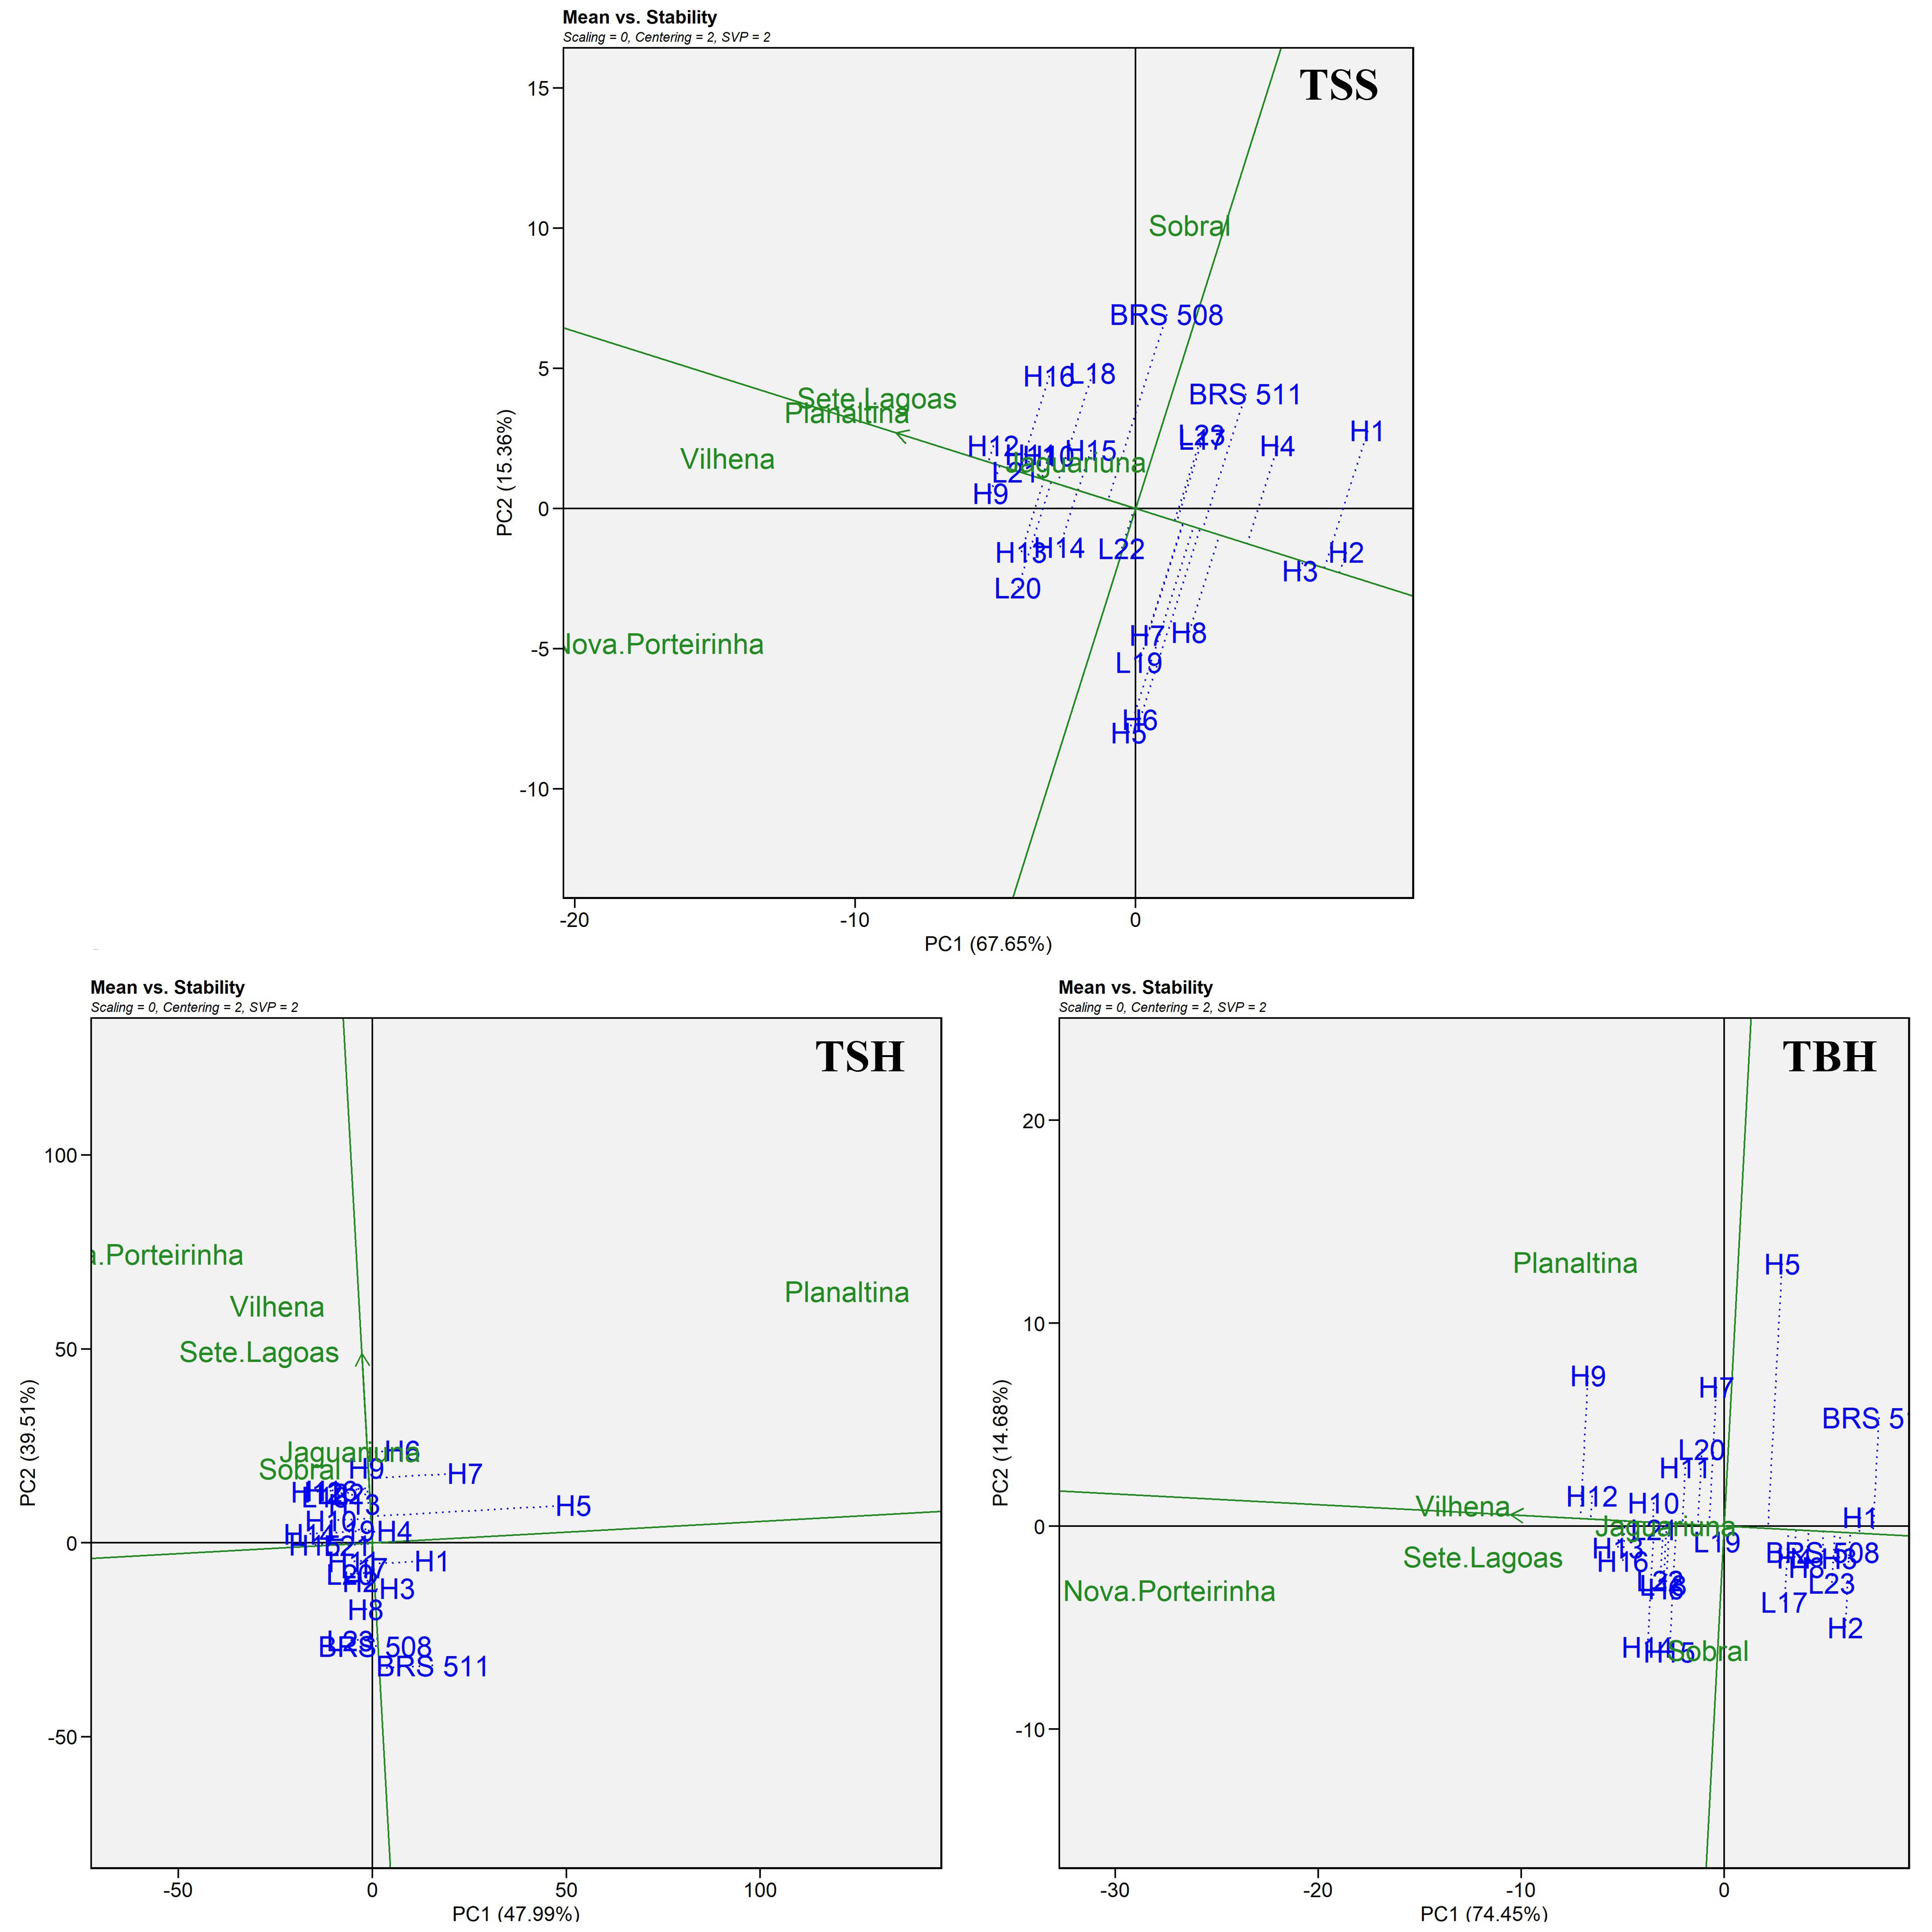
Sweet sorghum breeding programs require stable and adapted genotypes that can be more reliably recommended to farmers. According to Yan (2001), it is possible to exploit adaptability and stability using GGE biplots. By the “Mean vs. Stability” biplot (Figure 3), genotypes H12, H9, L21, H11, H10, and H15 (TSS); H6, H9, H16, H12, L22, L18, H13, H10, L19, and H4 (TSH); and H12, H13, H16, H10, L21, L22, L18, H6, H11, and L19 (TBH) have a smaller projection (dashed blue line) relative to the origin and are in the direction of the arrow (solid green line). Therefore, they are more stable and better adapted to the respective traits evaluated. It should be noted that the treatments highlighted here are lines and hybrids that are still in the experimental phase, but exhibited a better response than the control cultivars (BRS508 and BRS511), indicating their potential for recommendation (Figure 3).

GGE “Mean vs. Stability” biplot for total soluble solids (TSS, in %), tons of stalks per hectare (TSH, in t ha-1), and tons of Brix per hectare (TBH, in t ha-1) for 25 sweet sorghum genotypes evaluated in Jaguariúna/SP, Nova Porteirinha/MG, Planaltina/DF, Sete Lagoas/MG, Sobral/CE, and Vilhena/RO in the 2021/2022 crop season.
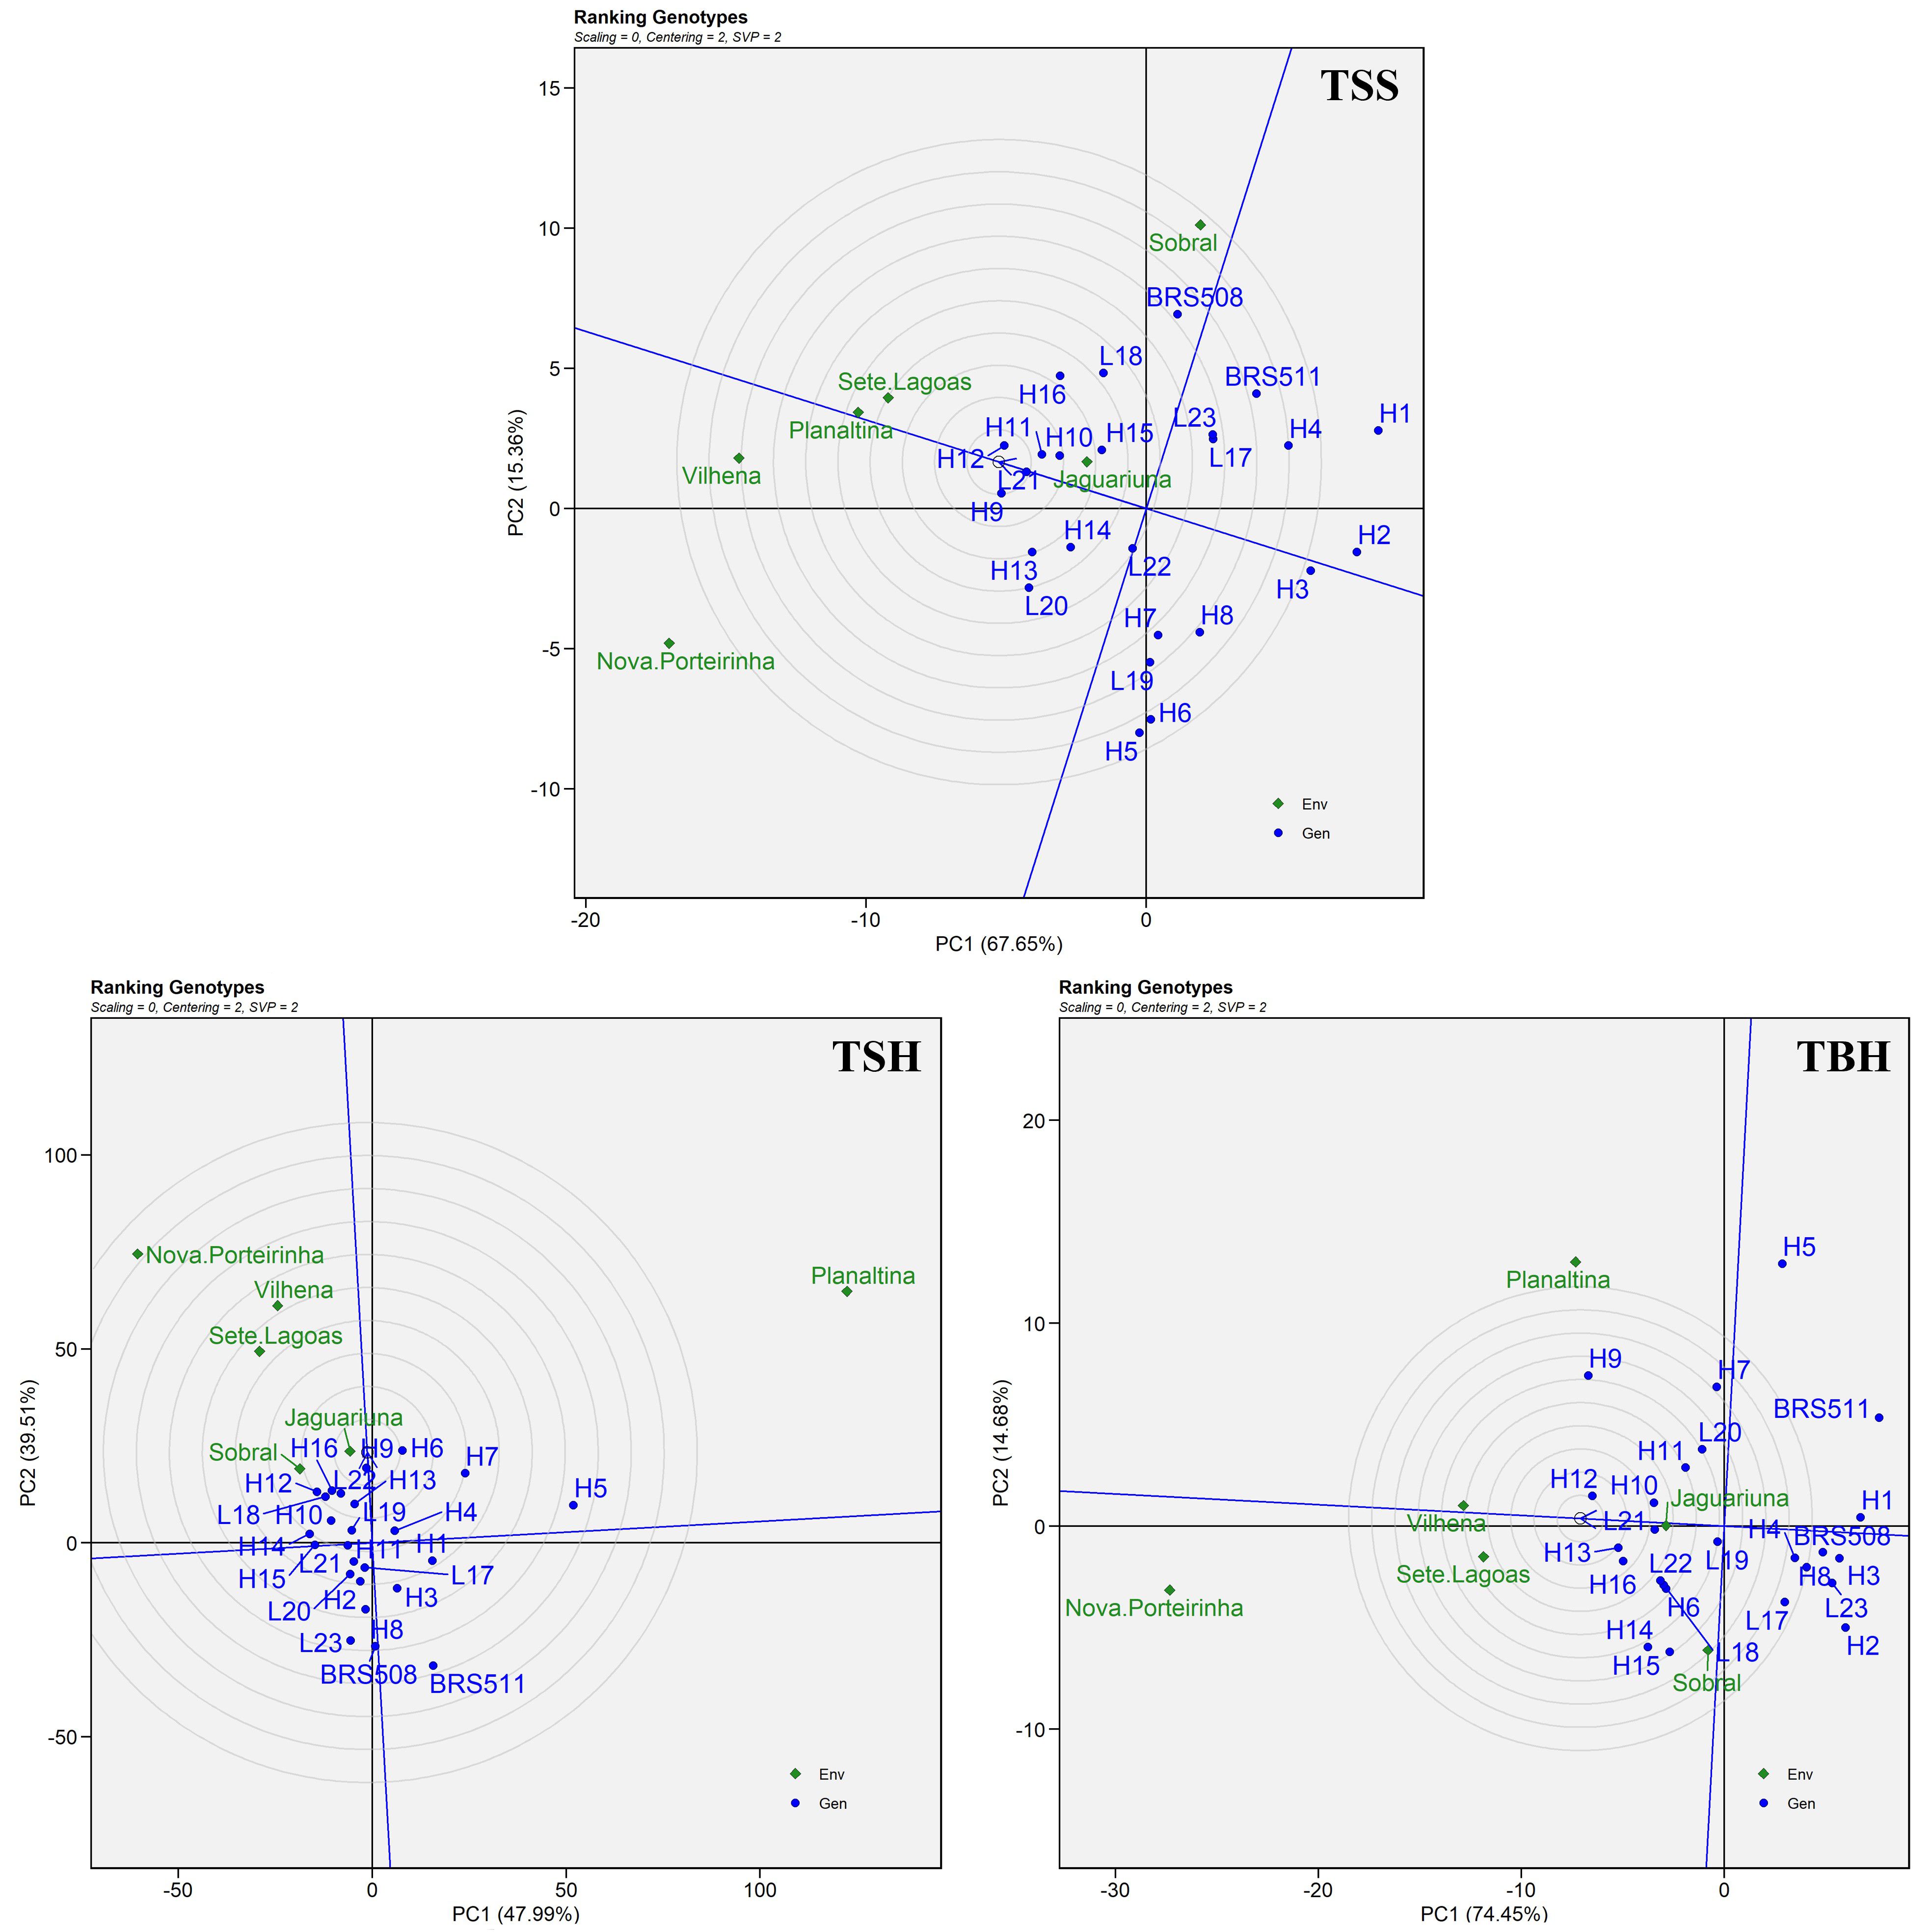
According to the “Ranking Genotypes” biplot (Figure 4), genotypes H12, H11, L21, H9, H10, H15, H16, and L18 (TSS); H6, H9, L22, H16, H7, H12, H9, H4, L18, and H13 (TSH); and H12, H13, H16, H10, H21, L22, H11, L18, H6, H14, H15, and H11 (TBH) are those nearest to an ideal genotype, that is, adapted and stable. According to the evaluated traits, these genotypes are interesting for ethanol production.

GGE “ranking genotypes” biplot for total soluble solids (TSS, in %), tons of stalks per hectare (TSH, in t ha-1), and tons of Brix per hectare (TBH, in t ha-1) for 25 sweet sorghum genotypes evaluated in Jaguariúna/SP, Nova Porteirinha/MG, Planaltina/DF, Sete Lagoas/MG, Sobral/CE, and Vilhena/RO in the 2021/2022 crop season.
Ethanol yield is an important trait for selecting sweet sorghum genotypes for the bioenergy sector. However, we could not estimate this trait in all the environments. Nevertheless, in a study carried out by Lombardi et al. (2015), a high phenotypic correlation (0.89) was obtained between the TBH and ethanol yield, which allows genotypes with good ethanol yield per hectare to be selected indirectly based on TBH. In this context, the genotypes that stood out in the evaluated traits can be considered promising for ethanol production.
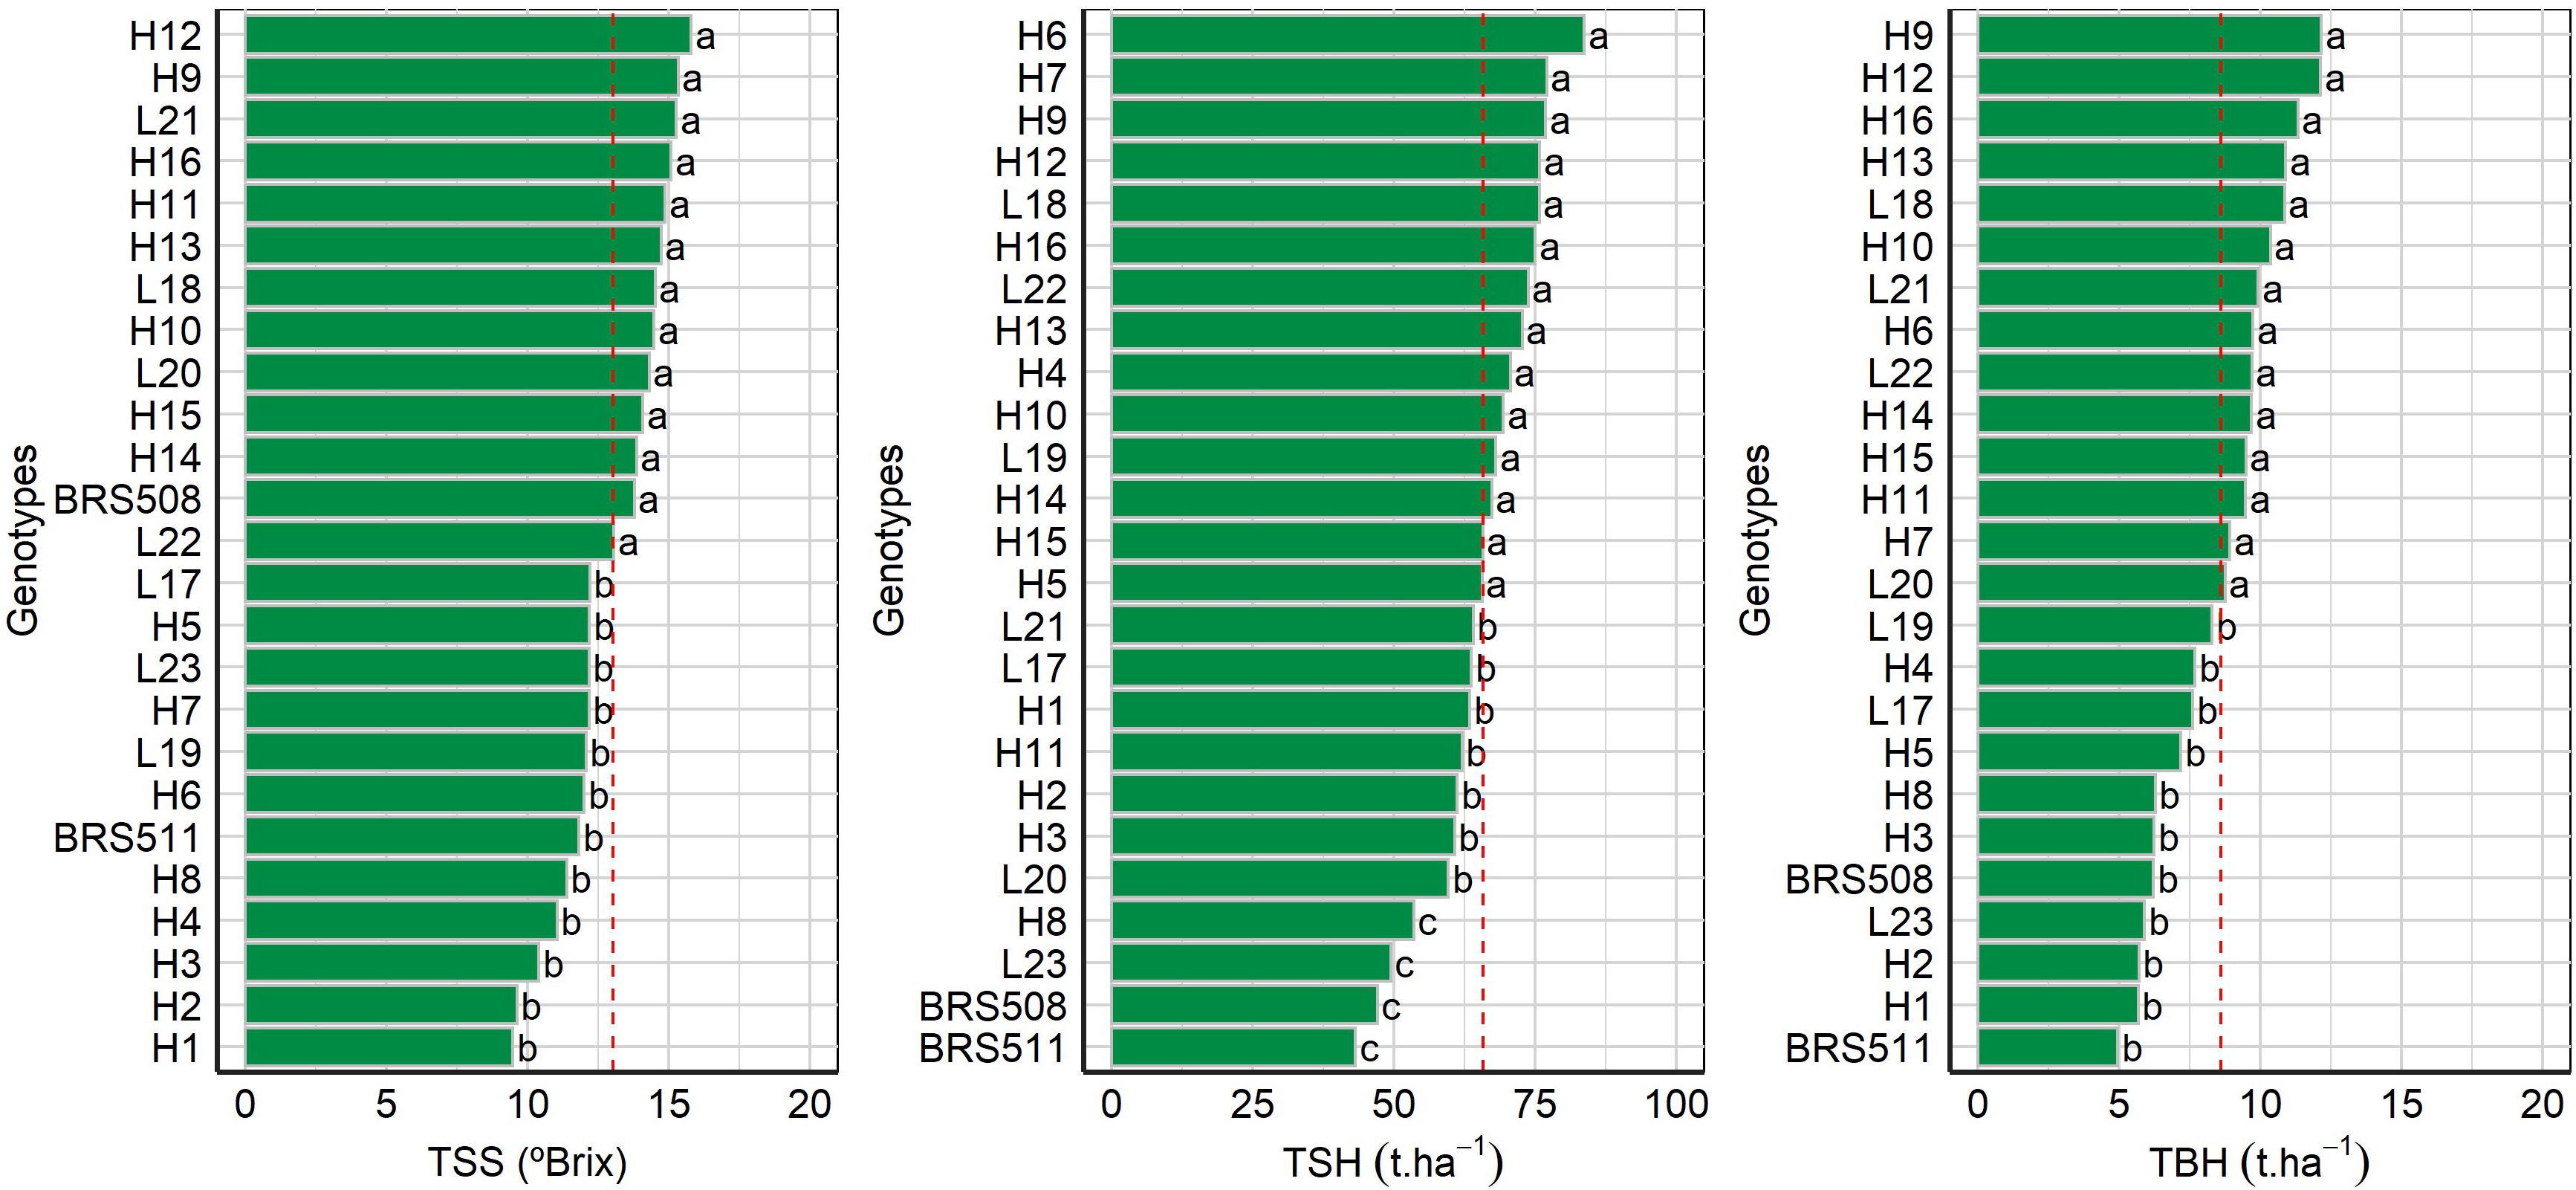
Parrella et al. (2021) established minimum requirements for sorghum genotypes to be suitable for the sugar-energy sector, including biomass yield of 50 t ha-1 and a total soluble solids content of 12.5º Brix, among other traits of interest. Our sorghum hybrids/lines evaluated mostly had TSH values above the necessary minimum, whereas the TSS values were lower than the reference value (Figure 5). However, it should be highlighted that even with the TSS outside the desired range, the TBH values indicate the possibility of selecting genotypes with potential for ethanol yield per hectare. Moreover, TSS is a trait with complex genetic control and heritability of low to medium magnitude; therefore, it is highly affected by the environment (Rini et al., 2017; Parrella et al., 2021; Ishimori et al., 2020). Therefore, lower TSS values may be associated with the environmental conditions during the crop season, and the selection potential for this trait should not be ruled out. An alternative to mitigate the effect of the environment on TSS is the assessment of genotypes in as many environments and crop seasons/years as possible to obtain greater reliability in the selection of genotypes for this trait (Ramalho et al., 2024).

Scott-Knott (1974) test at 5% probability, with mean values of the six growing environments (Jaguariúna/SP, Nova Porteirinha/MG, Planaltina/DF, Sete Lagoas/MG, Sobral/CE, and Vilhena/RO) for total soluble solids (TSS, in %), tons of stalks per hectare (TSH, in t ha-1), and tons of Brix per hectare (TBH, in t ha-1) for 25 sweet sorghum genotypes evaluated in the 2021/2022 crop season. Dashed red line: overall mean.
According to the Scott-Knott (1974) test, two groups were formed for TSS and TBH, while three groups were formed for TSH (Figure 5). Yan (2001) suggests that genotype recommendation should consider not only the mean value but also the adaptability and stability of the genotypes. Therefore, genotypes H12, L21, H10, and H11 are the most adapted and stable (Figure 3), the closest to an ideal genotype (Figure 4), and in the group with the highest Scott-Knott test mean (Figure 5) for traits related to ethanol yield. These genotypes can be selected for ethanol production.
Taken together, the use of the GGE biplot proved to be efficient for the selection of stable sorghum genotypes adapted to different edaphoclimatic conditions. Additionally, the selected genotypes showed good performance for the evaluated agronomic traits (TSH above 70 t ha⁻¹, SST starting at 14 ºBrix, and TBH higher than 10 t ha⁻¹), which are values superior to the minimum requirements suitable for the sugar-energy sector (Parrella et al., 2021). These results reaffirm sweet sorghum as a high-potential crop for the Brazilian ethanol production sector, particularly in the current context of climate change, due to its high adaptability and water use efficiency under water deficit conditions. Furthermore, when compared to other potential feedstocks for bioethanol production, such as elephant grass and eucalyptus, sorghum has an equivalent or lower production cost (Jonker et al., 2015). The potential ethanol production of sorghum reaches up to 8,000 L ha⁻¹, roughly double that of maize and 30% higher than the average yield of sugarcane (Luhnow & Samor, 2006).
Conclusions
This study helped to identify stable and superior hybrids in a clear visual format, but stability for one trait does not necessarily mean stability for another. The GGE biplots discriminated the genotypes and environments. Genotypes H12, L21, H10, and H11 are adapted, stable, and promising for biofuel production, with TSH above 70 t ha-1, SST of 14 ºBrix, and TBH greater than 10 t ha-1.
Acknowledgments
The authors would like to thank the National Council for Scientific and Technological Development (CNPq), the Brazilian Federal Agency for Support and Evaluation of Graduate Education (CAPES), the Brazilian Agricultural Research Corporation (Embrapa) (20.23.00.171.00.00), the Brazilian Sustainable Development Bank (BNDES) (20.18.00.028.00), and the Funding Agency for Studies and Projects (FINEP) (20.22.00.098.00) for the scholarships and resources used to develop this project.
References
- Ambaye, T. G. et al. (2021). Emerging technologies for biofuel production: A critical review on recent progress, challenges and perspectives. Journal of Environmental Management, 290:112627.
-
Agência Nacional do Petróleo, Gás Natural e Biocombustíveis - ANP. (2023). Relatório de análise de impacto regulatório N° 3 Available in: https://www.gov.br/anp/pt-br/assuntos/analise-de-impacto-regulatorio-air/arquivos/3626711-relatorio-analise-impacto-regulatorio.pdf
» https://www.gov.br/anp/pt-br/assuntos/analise-de-impacto-regulatorio-air/arquivos/3626711-relatorio-analise-impacto-regulatorio.pdf - Baloch, F. S. et al. (2023). Recent advancements in the breeding of sorghum crop: Current status and future strategies for marker-assisted breeding. Frontiers in Genetics, 14:1-36.
- Barcelos, C. A. et al. (2016). Sweet sorghum as a whole-crop feedstock for ethanol production. Biomass and Bioenergy, 94:46-56.
- Bernardo, R. (2020). Breeding for quantitative traits in plants (3rd ed.). Stemma Press. 422p.
- Bogapov, I. et al. (2024). Sweet sorghum (Sorghum bicolor L.) genotypes assessment for food, fodder, and energy values in Northern Kazakhstan. SABRAO Journal of Breeding and Genetics, 56(1):156-167.
- Botelho, T. T. et al. (2021). Strategies for multi-trait selection of sweet sorghum progenies. Crop Breeding and Applied Biotechnology, 21(4):e388221410.
- Cruz, C. D. (2013). GENES: A software package for analysis in experimental statistics and quantitative genetics. Acta Scientiarum, 35(3):271-276.
- Dang, X. et al. (2024). AMMI and GGE biplot analysis for genotype × environment interactions affecting the yield and quality characteristics of sugar beet. PeerJ, 12:e16882.
- Figueiredo, U. J. et al. (2015). Adaptability and stability of genotypes of sweet sorghum by GGE biplot and Toler methods. Genetics and Molecular Research, 14(3):11211-11221.
- Hassan, A. M., Ahmed, M. F., & Rashed, M. A. (2022). Performance and transcriptomic analysis of Sorghum bicolor responding to drought stress. SABRAO Journal of Breeding and Genetics, 54(4):814-825.
- Ishimori, M. et al. (2020). Dissecting the genetic architecture of biofuel-related traits in a sorghum breeding population. G3 Genes, 10(12):4565-4577.
- Jonker, J. G. G. et al. (2015). Outlook for ethanol production costs in Brazil up to 2030, for different biomass crops and industrial technologies. Applied Energy, 147: 593-610.
- Lombardi, G. M. R. et al. (2015). Path analysis of agro-industrial traits in sweet sorghum. Genetics and Molecular Research, 14(4):16392-16402.
- Lombardi, G. M. et al. (2024). Heterozygosity, adaptability, and phenotypic stability of sweet sorghum genotypes. Revista Caatinga, 37:e11517.
-
Luhnow, D., & Samor, G. (2006). As Brazil fill up on ethanol, it weans off energy imports. The Wall Street Journal Available in: http://wsj.com/article/SB113676947533241219.html/
» http://wsj.com/article/SB113676947533241219.html/ - Munarti, D. et al. (2022). Stay green genes fragmente homology analysis of Indonesian sorghum. SABRAO Journal of Breeding and Genetics, 54(4):742-754.
- Oliveira, F. T. et al. (2022). Productivity and stability of sweet sorghum in the municipality of Cáceres-MT. Research, Society and Development, 11(8):e5911830042.
- Olivoto, T., & Lúcio, A. D. (2020). Metan: An R package for multi-environment trial analysis. Methods in Ecology and Evolution, 11:783-789.
- Parrella, R. A. C. et al. (2021). Cultivares de sorgo para produção de bioenergia. In C. B. de Menezes. Melhoramento genético de sorgo Brasília, DF, Embrapa Milho e Sorgo, (pp. 278- 292).
- Pereira, D. et al. (2022). Agroindustrial performance and heterosis in sweet sorghum using male-sterile lines with high stem sugar content. Crop Breeding and Applied Biotechnology, 22(3):e42342235.
- Pimentel, L. et al. (2017). Chemical and bioenergetic characterization of sorghum agronomic groups. Pesquisa Agropecuária Tropical, 47(4):424-431.
- Pimentel-Gomes, F. (2009). Curso de estatística experimental 15 ed. FEALQ: São Paulo, 451p.
- Proietti, I., Frazzoli, C., & Mantovani, A. (2015). Exploiting nutritional value of staple foods in the world’s semi-arid areas: Risks, benefits, challenges and opportunities of sorghum. Healthcare, 3(2):172-193.
- Rakshit, S. et al. (2012). GGE biplot analysis to evaluate genotype, environment and their interactions in sorghum multi-location data. Euphytica, 185:465-479.
- Ramalho, M. A. P. et al. (2024). Aplicações da genética quantitativa no melhoramento de plantas autógamas Lavras: Editora UFLA. 456p.
- Rao, V. T. P. et al, (2016). Combining ability for grain mold resistance in sorghum (Sorghum bicolor L. Moench). SABRAO Journal of Breeding and Genetics, 48(3):240-246
- Reddy, P. S. et al. (2014). Genotype by sowing date interaction effects on sugar yield components in sweet sorghum (Sorghum bicolor L. Moench). SABRAO Journal of Breeding and Genetics, 46(2):241-255.
- Regassa, T. H., & Wortmann, C. S. (2014). Sweet sorghum as a bioenergy crop: Literature review. Biomass Bioenergy, 64:348-355.
- Rifka, W. D., & Breed, S. J. (2020). Genotype by environment interaction affecting leaf rust resistance in sorghum.Sabrao Journal of Breeding and Genetics, 52:75-90.
- Rini, E. P. et al. (2017). Genetic analysis on agronomic and quality traits of sorghum hybrids in Indonesia. SABRAO Journal of Breeding and Genetics, 49(2):192-200.
- Ruswandi, D. et al. (2021). GGE biplot analysis for stability and adaptability of maize hybrids in the western region of Indonesia. International Journal of Agronomy, Article ID 2166022, 9p.
- Scott, A. J., & Knott, M. (1974). A cluster analysis method for grouping means in the analysis of variance. Biometrics, 30:507-512.
- Silva, K. J. et al. (2021). Identification of mega-environments for grain sorghum in Brazil using GGE biplot methodology. Agronomy Journal, 113(4):3019-3030.
- Silva, R. A. et al. (2022). Phenotypic stability and adaptability of sweet sorghum genotypes evaluated in different Brazilian regions. Agronomy Science and Biotechnology, 8:1-16.
- Tessema, L., Mohammed, W., & Abebe, T. (2020). Evaluation of potato (Solanum tuberosum L.) varieties for yield and some agronomic traits. Open Agriculture, 5(1):63-74.
- Xue, X. et al. (2023). Sugar accumulation enhancement in sorghum stem is associated with reduced reproductive sink strength and increased phloem unloading activity. Frontiers in Plant Science, 14:1233813.
- Yan, W. et al. (2000). Cultivar evaluation and mega-environment investigation based on the GGE biplot. Crop Science, 40(3):597-605.
- Yan, W. (2001). GGEbiplot: A windows application for graphical analysis of multienvironment trial data and other types of two-way data. Agronomy Journal, 93(5):1111-1118.
- Wickham, H. (2016). ggplot2: Elegant graphics for data analysis (2nd ed.). Springer Cham. 260p.
-
Editor de seção:
Renato Paiva