 Comparison of freeze-drying and spray-freeze-drying coffee with different roast degrees
ABSTRACT
Coffee drying methods significantly impact the final quality of soluble coffee. This study evaluated how two vacuum-based drying techniques, freeze-drying (FD) and spray-freeze-drying (SFD), affect the physicochemical properties and volatile profiles of pour-over coffee prepared from Arabica green coffee beans roasted to light, medium, and dark degrees. We also examined how roast degree and drying method interact to affect microstructure, chemical composition, and flavor retention. FD and SFD produced distinct microstructures. FD formed porous, sheet-like structures, while SFD produced uniform spherical particles. Chemical analysis revealed that increasing roast degree led to decreased total polyphenol content likely due to thermal degradation. Gas chromatography-mass spectrometry analysis showed that SFD retained specific volatile aromatic compounds more effectively. In contrast, FD better preserved non-volatile compounds, such as total dissolved solids (TDS) and polyphenols, likely due to reduced oxidative stress than the atomization step used in SFD. Fourier-transform infrared spectroscopy further confirmed greater degradation of the organic matrix in SFD samples. Overall, the results showed a clear trade-off between the two drying methods. FD was more effective at preserving non-volatile bioactive compounds, including polyphenols and TDS. In contrast, SFD retained key volatile aromatic markers (e.g., 2-furanmethanol) more efficiently through rapid microencapsulation. SFD also reduced total processing time by 45%, indicating greater operational efficiency for producing high-quality instant coffee.
Index terms:
Pour over coffee; gas chromatography-mass spectrometry; microstructure; soluble coffee.
RESUMO
Os métodos de secagem do café impactam significativamente a qualidade final do café solúvel. Este estudo investiga os efeitos de duas técnicas de secagem a vácuo - Liofilização (FD) e Liofilização por Aspersão (SFD) - nas propriedades físico-químicas e nos perfis de compostos voláteis do café coado, preparado a partir de grãos com diferentes graus de torra (clara, média e escura). Os resultados demonstram diferenças microestruturais distintas: a FD produziu estruturas porosas em forma de lâminas, enquanto a SFD gerou partículas esféricas uniformes. A análise química revelou que o aumento do grau de torra levou à diminuição do teor total de polifenóis devido à degradação térmica. Crucialmente, a análise por cromatografia gasosa acoplada à espectrometria de massas (CG-SM) mostrou que a SFD apresentou retenção aprimorada de compostos aromáticos voláteis específicos. A FD foi mais eficaz na preservação de constituintes não voláteis, como sólidos totais dissolvidos (TSD) e polifenóis, provavelmente devido ao menor estresse oxidativo em comparação com a etapa de atomização na SFD. A espectroscopia de infravermelho com transformada de Fourier (FTIR) confirmou ainda a degradação da matriz orgânica nas amostras SFD. A secagem por ar forçado (FD) mostrou-se mais eficaz na preservação de bioativos não voláteis, como polifenóis e sólidos totais dissolvidos (STD). Em contrapartida, a secagem por ar supercrítico (SFD) demonstrou maior eficiência na retenção de marcadores aromáticos voláteis importantes (por exemplo, 2-furanmetanol) por meio de microencapsulação rápida. Além disso, a SFD alcançou uma redução de 45% no tempo total de processamento, demonstrando maior eficiência operacional para a produção de café instantâneo de alta qualidade.
Termos para indexação:
Café coado; cromatografia gasosa-espectrometria de massa; microestrutura; café solúvel
Introduction
Coffee is one of the most widely consumed beverages worldwide and is valued for its distinctive flavor and aroma. Its unique sensory profile develops during roasting through high-temperature chemical reactions, primarily the Maillard reaction, Strecker degradation, and the pyrolysis of polysaccharides and lipids (Sunarharum et al., 2014). Yeretzian et al. (2019) reported that the concentration of precursor compounds significantly dictates the final aroma intensity. Light roasting preserves thermolabile acids and volatile esters, which contribute to the floral and fruity notes often associated with enzymatic properties. As roasting progresses to medium levels, sucrose degradation and the formation of heterocyclic compounds, such as pyrazines and furans, produce nutty and chocolaty notes (Moon & Shibamoto, 2009). In dark roasting, extensive pyrolysis of the cellular matrix forms bitter compounds, such as phenylindanes and melanoidins, which can mask the acidity linked to the bean’s origin (Bhumiratana, Adhikari, & Chambers, 2011). Seninde and Chambers (Seninde, Chambers, & Chambers, 2020) also observed that antioxidant capacity decreases in dark-roasted coffee, attributed to the thermal degradation of phenolic compounds.
Some processing strategies can improve the use of lower-quality beans in instant coffee production. Kalschne et al. (2018) showed that instant coffee made with steam-processing defective beans received positive sensory acceptance, even when these beans represented 50% of the blend. Similarly, Reis et al. (2019) demonstrated that incorporating up to 50% steamed defective Robusta beans (processed at 2 bar for 3 min) to instant Arabica coffee blends produced products with favorable bioactive profiles and high sensory acceptance.
The global coffee market continues to grow, and soluble coffee maintains a substantial market share due to its convenience. Advances in food processing technologies have improved production methods and helped meet consumer demand for high-quality soluble coffee. A 2021 survey report by the International Trade Centre projected that the global specialty coffee market will reach a value of 120.54 billion USD by 2030 (Wienhold et al., 2025 ).
Conventional soluble coffee production primarily uses spray-drying (SD), a high-temperature technique in which liquid coffee is atomized into fine droplets and rapidly dried with hot air. SD offers high throughput and low production costs, but high temperatures can cause major losses of volatile flavor compounds and nutritional constituents (Mujumdar, 2007; Ishwarya & Anandharamakrishnan, 2015). SD coffee powder typically has a monomodal particle size distribution and smooth, spherical particles (Deotale et al., 2020; Ghirişan & Miclăuş, 2017).
In contrast, freeze-drying (FD) better retains flavor, aroma, and bioactive compounds, yielding powders with greater stability during storage and transport. For this reason, the food, pharmaceutical, and biotechnology industries widely use FD (Jadhav et al., 2024; Siddiqui et al., 2024). In coffee extracts (Shofinita et al., 2024) FD produces a porous, flake-like structure with a bimodal particle size distribution (Deotale et al., 2020) Although FD consumes more energy than SD, it better preserves the original sensory profile of coffee (Ghirişan & Miclăuş, 2017). Thus, while SD is more suitable for mass production, FD is generally preferred for specialty coffee applications (Al-Ghamdi et al., 2024).
Spray-freeze-drying (SFD) is an emerging hybrid technology that combines the rapid atomization used in SD with the low-temperature processing benefits of FD, which substantially reduces overall processing time. Although SFD was first developed for pharmaceutical applications, the food industry has increasingly adopted this technology. In soluble coffee production, SFD produces powders with higher porosity and improved rehydration properties than FD, while retaining aromatic compounds more effectively than SD (Ishwarya & Anandharamakrishnan, 2015). The SFD process comprises four main stages: atomization, droplet cooling, collection, and drying. Several atomization techniques can be used, including hydraulic, pneumatic, ultrasonic, and piezoelectric methods. Among them, ultrasonic atomizers are particularly effective because they generate highly uniform sprays. This uniformity, combined with rapid freezing, contributes to a consistent microstructure and enhances dissolution rates.
As SFD technology advances, process variations continue to diversify (Waghmare et al., 2021). One common rapid-cooling approach uses cryogenic fluids, such as liquid nitrogen or carbon dioxide. Cryogenic temperatures and the high specific surface area of the droplets allow near-instantaneous freezing (Adali et al., 2022) Research on the FD and SFD of soluble coffee has predominantly focused on concentrated coffee extracts produced by industrial extraction methods. These extracts are commonly used because standardized procedures and high solute concentrations allow more precise experimental analysis. However, few studies have examined hand-brewed (pour-over) coffee liquids, whose physicochemical properties remain largely unexplored.
Despite this gap, recent studies showed that sensory attributes of pour-over coffee, such as acidity, floral notes, and body, are highly sensitive to extraction conditions and subsequent processing (Sunarharum & Farhan, 2020; Pereira et al., 2023). Córdoba et al. (2021) investigated the extraction efficiency of hand-brewed coffee and showed that this method can fully extract volatile compounds and soluble solids. Comparative studies of SD and FD also showed that SD powders have lower bulk density and higher porosity, but lower antioxidant activity than FD powders (Ghirişan & Miclăuş, 2017). More recently, Deotale et al. (2022) compared FD, SD, and SFD in soluble coffee and reported that SFD retained sensory properties and chlorogenic acid (CGA) more effectively. Overall, sensory and chromatographic analyses have positioned SFD as a promising technology for producing high-quality soluble coffee.
In this study, coffee beans roasted to light, medium, and dark degrees were brewed using the pour-over method. The resulting infusions were subsequently dehydrated using FD and SFD. We evaluated the influence of roasting degrees and dehydration technologies on the physicochemical properties of pour-over coffee. We hypothesized that SFD would better preserve the soluble matrix and volatile profile than conventional FD, likely due to its cryogenic kinetics.
Material and Methods
Arabica coffee beans
Arabica green coffee beans used in this study were purchased from Green Beanery and originated from the Cerrado Coffee Region in Brazil. The coffee was harvested in 2019 from farms located mainly at elevations between 850 and 1,350 m. The beans were processed using the traditional Brazilian sun-drying method.
Coffee roasting machine
Coffee beans were roasted using an 801N roaster manufactured by Xilong Enterprise Co., Ltd. (Taiwan). This roaster allows programmable roasting curves and precise control of time and temperature, which drives the main physical and chemical transformations in coffee beans. The following parameters were monitored during roasting:
Roasting temperature (RT): Drum temperature before the green beans are introduced. This temperature influences sugar caramelization and pyrolysis, mainly sucrose. Higher temperatures promote more extensive chemical transformations.
Turning point (TP): The lowest drum temperature reached after the beans are introduced. At this stage, beans absorb heat and the drum temperature temporarily decreases before rising again.
First crack start (FCs): The beginning of the first audible cracking sound, which usually occurs at temperatures above 180 °C. Internal steam and gas pressure cause the beans to expand and crack.
First crack end (FCe): The point at which the first series of audible cracks ends.
Second crack start (SCs): The beginning of a second series of more subtle cracks, which usually occurs between 205-230 °C. At this stage, surface oils become visible, and bitterness increases markedly.
Drop: The moment when the beans reach the target roast degree (light, medium, or dark), and are immediately discharged from the roaster.
Cooling: Rapid cooling immediately after roasting stops further thermal reactions and helps prevent the degradation of aromatic compounds caused by residual internal heat.
Coffee roast degree analyzer
The CM-100 Coffee Roast Degree Analyzer was used to measure the roast degree of the coffee beans. Following Specialty Coffee Association of America (SCAA) standards, the analyzer employs near-infrared (NIR) spectroscopy to assess caramelization, reported as the Agtron value (from 0 to 100). Higher values indicate lighter roasts, lower caramelization, and lighter bean color, while lower values indicate darker roasts, higher caramelization, and darker bean color.
Electric coffee grinder
Coffee beans were ground using a BARATZA Sette-270Wi electric grinder (BARATZA, USA), which allows precise control over both target grind weight and grind size. The grinder has a dual adjustment system (macro and micro settings) to control particle size distribution. In this study, the grind size was set to 29-G, producing a coarse grind suitable for pour-over extraction.
Total dissolved solids (TDS) analyzer
A VST LAB Coffee III refractometer (VST, USA) was used to measure TDS content in brewed coffee. The instrument uses optical refraction to quantify dissolved compounds in the coffee solution. The resulting data were used to calculate the extraction yield and compare coffee concentration under different brewing conditions.
Freeze-drying equipment
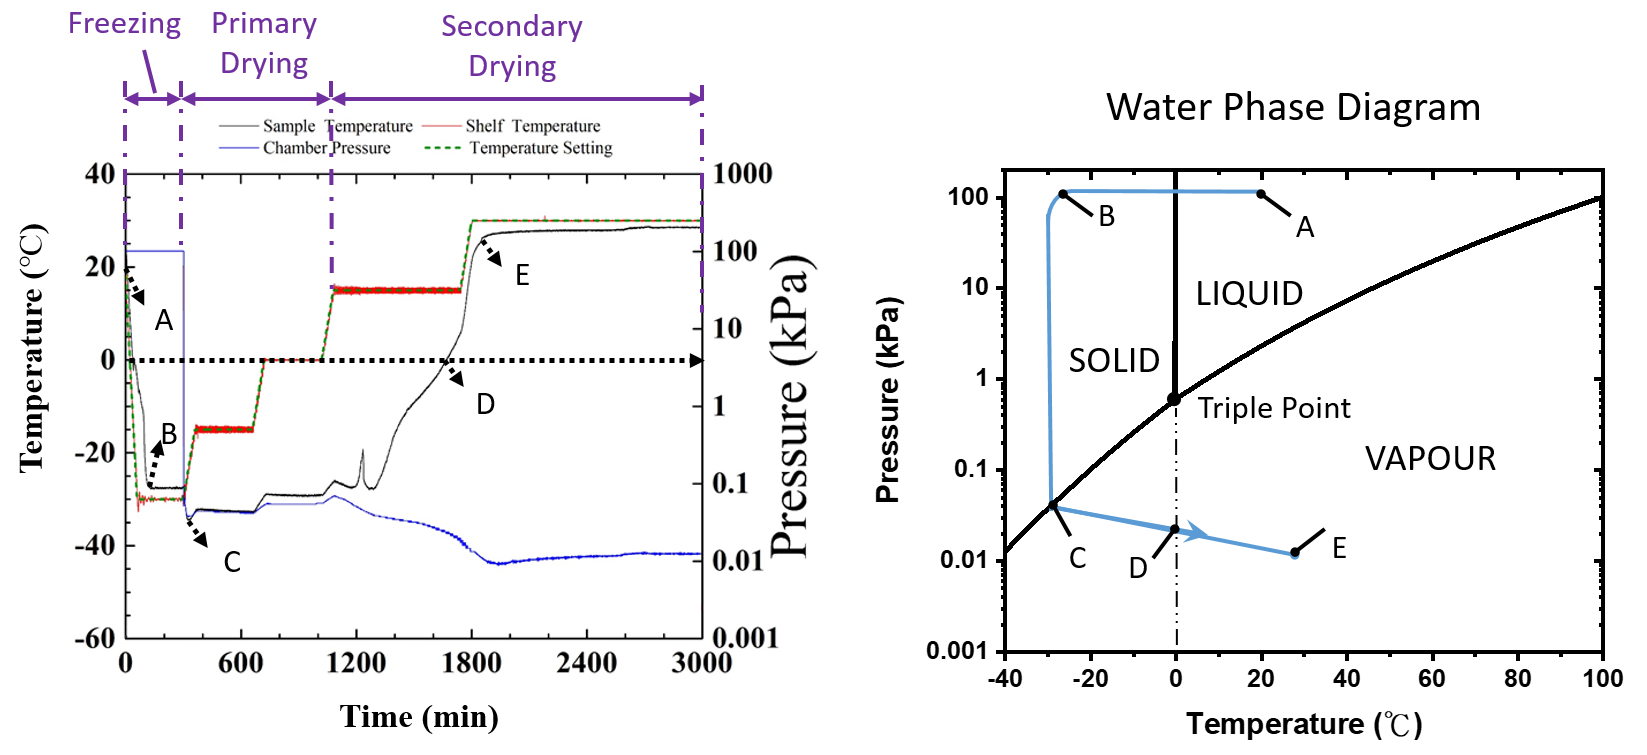
A shelf-type freeze-drying system (TYFD-50001, Tai Yiaeh, New Taipei City, Taiwan) was used to dehydrate the coffee samples. FD removes water from frozen samples by sublimation under reduced pressure. The process includes three main stages:
Freezing: The sample is rapidly frozen at or below its eutectic temperature, converting liquid water into solid ice crystals.
Primary drying or sublimation: Under vacuum, ice crystals sublime directly into vapor without passing through the liquid phase.
Secondary drying or desorption: After most of the ice has sublimated, the residual bound water is removed by slightly increasing the temperature. This step typically reduces the final moisture content to 1-4%.
Figure 1 illustrates the temperature and pressure changes throughout the FD process, together with a phase diagram showing the triple point of water.
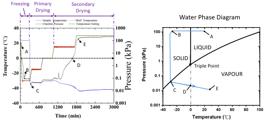
(a) Temperature and pressure profiles of the FD process. (b) Water phase diagram showing the triple point region.
Ultrasonic spray equipment
An ultrasonic spray system manufactured by Yongquan Industrial Co., Ltd. (Taiwan) was used in this study. A dedicated ultrasonic controller operates the system at a resonance frequency of 41.85 kHz. The atomizer nozzle employs ultrasonic vibrations to disperse liquid across its surface. When the vibration amplitude exceeds the liquid’s surface tension, the liquid is atomized into fine, uniform droplets. This method reduces droplet rebound and scattering, thereby minimizing material loss. It also enables precise and efficient atomization, making it suitable for applications requiring uniform droplet size distribution, such as SFD.
Continuous-wavelength microplate spectrophotometer
To evaluate the chemical composition of coffee samples processed via FD and SFD, total polyphenol content (TCP) was measured using a continuous-wavelength microplate spectrophotometer (SpectraMax M190, Molecular Devices, USA). TCP was determined using a colorimetric assay, with gallic acid (GA) as the standard. The sample preparation and assay steps were as follows:
Standard preparation: GA (0.01g) was dissolved in 1mL of deionized water (ddH₂O) to prepare a 10,000 ppm stock solution, which was then diluted to 100, 80, 60, 40, 20, and 0 ppm.
Reaction: Each standard or sample (0.05 mL) was mixed with 0.05 mL of Folin-Ciocalteu reagent in 1.5 mL tubes. The mixture was incubated in the dark at room temperature for 5 min.
Neutralization: Then, 0.1 mL of 20% Na2CO3 and 0.8mL of ddH2O were added. The mixture was mixed well and incubated in the dark at room temperature for 25 min.
Centrifugation: The mixture was centrifuged at 5,000 rpm for 10 min.
Measurement: Supernatant was transferred to a 96-well plate, and absorbance was measured at 730 nm using a microplate reader.
The standard curve equation was: Optical density = 0.0987 ×Galic acid - 0.0522, with R2 = 0.9981.
Fourier transform infrared (FTIR) spectroscopy
FTIR spectroscopy was performed using a Spectrum Two Educational System (PerkinElmer, USA). FTIR measures the absorption of infrared radiation by molecular bonds in a sample. This technique can identify functional groups, detect chemical changes, and characterize the molecular structure of organic compounds. In this study, FTIR was used to evaluate potential alterations in the chemical composition of coffee samples subjected to different drying treatments. Spectra were recorded using a Universal ATR (UATR) accessory. Data were collected at a resolution of 4 cm-1, with 16 scans per spectrum, covering the range of 4,000-450 cm-1.
Gas chromatography-mass spectrometry (GC-MS)
Volatile organic compounds were analyzed using a high-resolution gas chromatograph-mass spectrometer (AccuTOF GCX, JEOL, Japan) equipped with a DB-5MS capillary column (30 m × 0.25 mm i.d., 0.25 μm film thickness). Helium (99.999% purity) was used as the carrier gas at a constant flow rate of 1.0 mL/min. The oven temperature program was initially set at 40℃ and held for 2 min. It was then increased to 250℃ at 5℃/min and held for 5 min. The injector temperature was maintained at 250℃, with a split ratio of 10:1. Compounds were identified by comparing mass spectra with the NIST 17 library.
Scanning electron microscopy (SEM)
A cold field-emission scanning electron microscope (FE-SEM) (Regulus-8100, HITACHI, Japan) was used to observe the microstructure of FD and SFD coffee samples. This high-resolution technique shows surface morphology and structural integrity from the micrometer to the nanometer scale. It also helps evaluate changes in sample porosity and cell wall collapse resulting from different drying methods.
Brewing parameters for coffee extraction
Brewing parameters were selected based on preliminary optimization trials to achieve the target TDS range and an extraction yield (EY) of 18-22%, consistent with the Specialty Coffee Association (SCA) “Golden Cup” standard (Córdoba et al., 2021). A coffee-to-water ratio of 1:15 was used to obtain an infusion concentrated enough for dehydration while maintaining a balanced flavor profile.
The total brewing time was 7 min, including a 3 min pouring phase and a 4 min drawdown phase. This longer brewing time was required because the sample scale was increased to 45 g of coffee and 675 g of water for FD and SFD. Compared with standard single-cup protocols (e.g., 15 g coffee), the higher bed depth in the 45 g batch required a longer contact time to ensure uniform saturation and efficient extraction of soluble solids without over-extraction or excessive bitterness.
The final coffee liquid mass was 600 g. The infusion was divided into three equal 200 g aliquots. One aliquot was processed via FD, and another was dehydrated using SFD. For reconstitution, deionized water was added to the resulting powders to restore the final mass to the original 200 g.
Freeze-drying of brewed coffee
Figure 2 illustrates the process flow used to produce FD coffee powder in this experiment. The process begins with pour-over coffee liquid, which was poured into shallow trays to maximize the surface area for sublimation. The trays were then placed in a freeze dryer, where the samples dried under controlled temperature and pressure conditions. The resulting dried product formed a tray-shaped structure with a porous, sheet-like, and mesh-like morphology before structural collapse and grinding. Table 1 shows the operating parameters of the FD process, including pre-freezing and multiple staged drying settings. The total process time was 51 h.

Before dehydration, the coffee extract was pre-frozen at -40 °C. This step fully solidified the coffee matrix and formed a stable ice crystal network. The pre-freezing temperature was kept at -40 °C, well below the sample’s glass transition temperature (T’g) and eutectic point (Te), to prevent structural collapse, “melt-back,” and solute migration during primary drying.
The multi-stage heating profile for FD was optimized to balance sublimation efficiency and structural integrity. Primary drying was conducted at -20°C and 0°C under high vacuum (<50 Pa) to ensure ice sublimation occurred below the product collapse temperature (Tc). This vacuum level created a strong vapor pressure gradient for sublimation, preserved the porous, sheet-like matrix, and prevented melting.
Secondary drying was then conducted at 20°C and 40°C to remove bound water by desorption. The final shelf temperature was limited to 40°C to minimize the thermal degradation of volatile aromatic compounds and heat-sensitive polyphenols, as determined by preliminary trials.
Spray-freeze-drying of brewed coffee
Figure 3 illustrates the SFD process used in this experiment. First, the coffee liquid was atomized using an ultrasonic nozzle operated at a controlled oscillation frequency by an ultrasonic generator. The ultrasonic vibrations dispersed the liquid into fine droplets, which were immediately sprayed into liquid nitrogen. Upon contact, the droplets froze rapidly and formed solid spherical coffee particles.

These frozen particles were then carefully transferred to a pre-frozen shallow tray and placed in a freeze dryer for subsequent vacuum drying. The final product consisted primarily of small, spherical coffee powder particles. Table 2 lists the detailed parameters of the SFD process. The total processing time was 28 h, more than 45% shorter than the traditional FD method, likely because the high specific surface area of the atomized spherical droplets promoted faster heat and mass transfer. This contributes to significant energy savings.
The pressure was maintained below 50 Pa to provide a sufficient driving force for sublimation. The temperature stages were optimized based on residual moisture analysis, ensuring the final powder to reach a stable moisture content while taking advantage of the faster sublimation kinetics of SFD microparticles.
Retention efficiency
The retention efficiency of TDS and polyphenols was calculated according to Equation (1):
where Cpost-drying is the concentration after reconstitution, and Coriginal is the initial concentration before drying.
Statistical analysis
Experimental data were subjected to two-way analysis of variance (ANOVA) using a completely randomized design with factorial arrangements of 3×2 for roast degree and bean form, and 3×3 for roast degree and processing method. Roast degree and TDS were measured with 10 and 5 replicates, respectively. Data were expressed as mean ± standard deviation (SD). ANOVA was used to evaluate the main effects of roast degree, processing method or bean form, and their interactions. When significant effects were detected (p < 0.05), means were compared using Tukey’s Honestly Significant Difference (HSD) test at a 95% confidence level. For high-cost analytical techniques performed as single measurements (GC-MS, FTIR, and SEM), the results were treated as representative qualitative fingerprints. These data were used to identify general trends and compare them with statistically validated physical parameters. All statistical analyses were performed using Microsoft Excel 2016 with the Data Analysis ToolPak.
Results and Discussion
Coffee bean roasting parameters
Raw coffee beans (454 g) were roasted using a single continuous roasting protocol. The roasting chamber was preheated to 201 °C, and the roasting time was recorded from the initial bean charge. To obtain roast degrees from the same batch, samples were discharged at specific time-temperature intervals. Light roast samples were collected at 13 min 13 s, when the bean temperature reached 210 °C. Medium roast samples were collected at 15 min 35 s, at 227.7 °C, and dark roast samples were collected at 16 min 19 s, at 231 °C. Immediately after discharge, all samples were rapidly air-cooled to stop further roasting caused by residual heat. Table 3 summarizes the key roasting parameters, including the time and temperature endpoints for light, medium, and dark roasts.
Measurement of the roast degree of coffee beans and powders
Table 4 summarizes the Agtron roast values for whole beans and ground powders across the three degrees. Two-way ANOVA followed by Tukey’s HSD test at α= 0.05 showed that roast degree, sample form, and their interaction significantly affected the Agtron values (p < 0.05). As expected, Agtron values decreased significantly as roast degree increased from light to dark. This decrease reflects the formation of dark-colored melanoidins through Maillard reactions and sugar caramelization. Sample form (whole bean vs. ground powder) also affected Agtron values, but this effect depended on roast degree. In light roasts, ground powders had significantly higher Agtron value (73.37 ± 0.53) than whole beans (67.28 ± 0.35), suggesting that the internal structure of the bean was less charred than its surface. Conversely, medium and dark roast powders had significantly lower Agtron values than their corresponding whole beans (p < 0.05). This reversal indicates that, in more intense roasts, the internal core of the bean undergoes greater thermal degradation. Grinding homogenizes this dark interior, resulting in lower Agtron values for the powder. These findings show that standardized sample preparation is important when classifying specialty coffee roast profiles.
SEM analysis
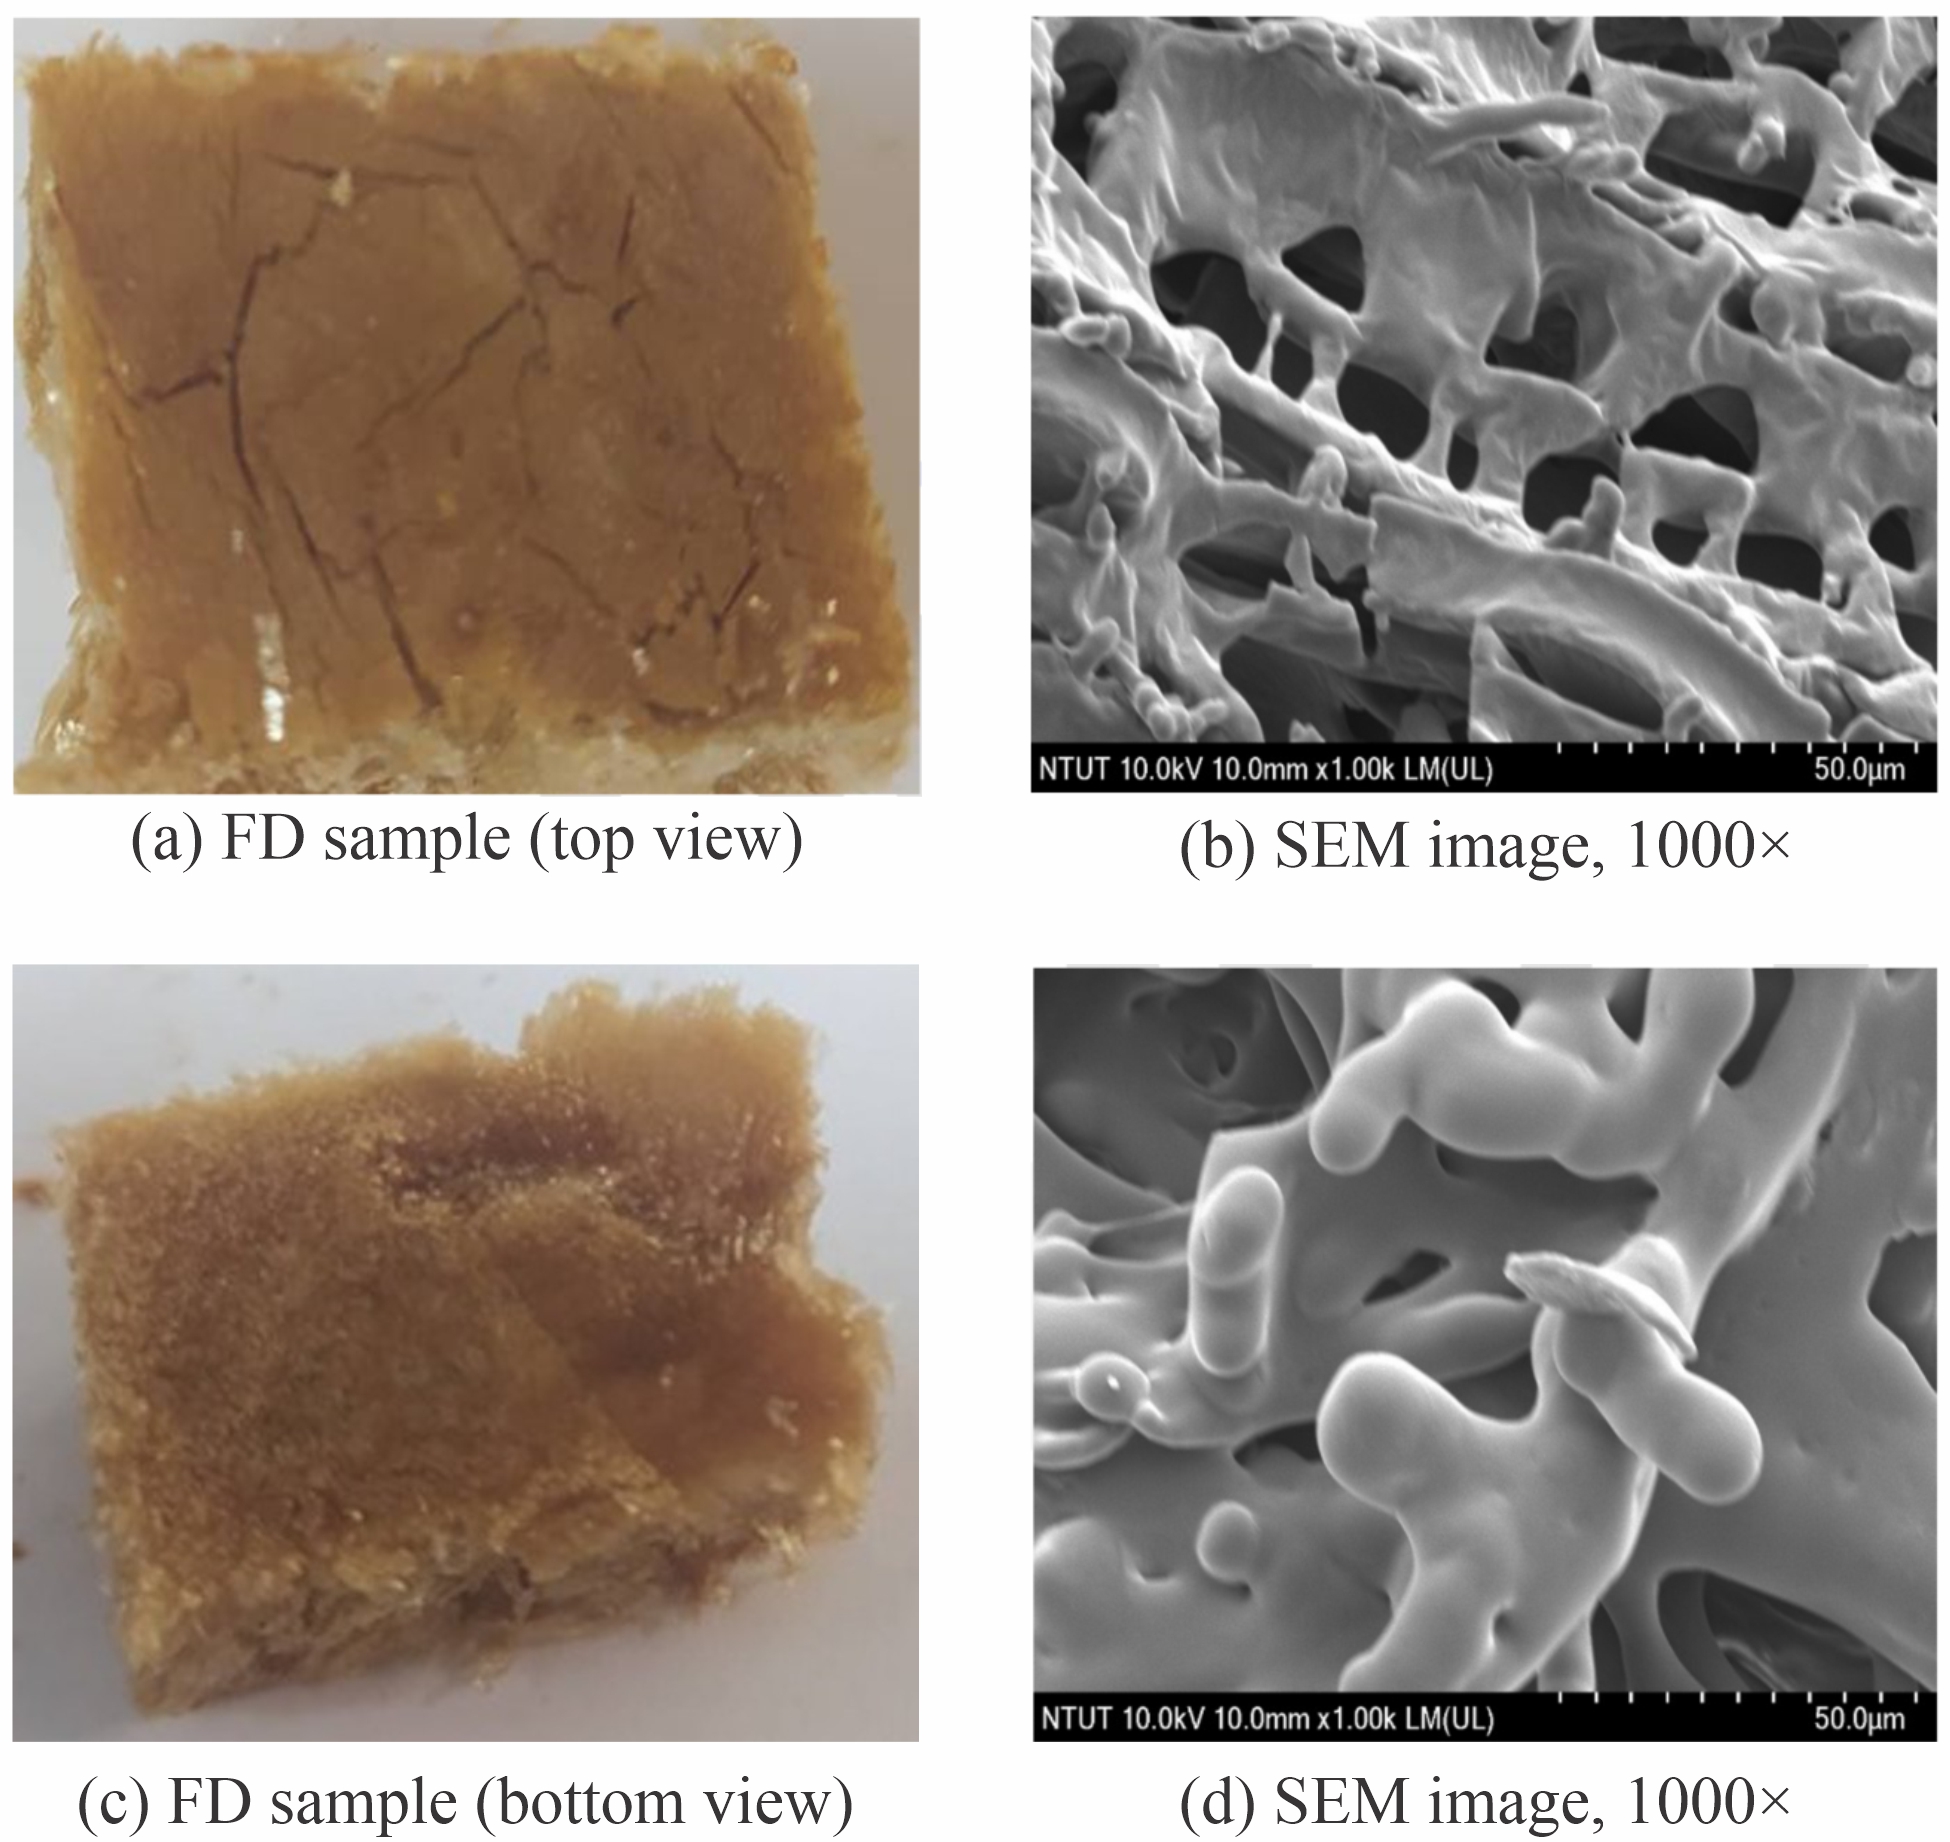
Figure 4 shows the physical appearance and surface microstructure of FD coffee samples prepared in trays. Figure 4a shows the top view of an FD coffee sample in a shallow tray, where surface cracks are clearly visible. The SEM image in Figure 4b, taken at 1000× magnification, shows stacked, sheet-like lamellae separated by porous gaps. These gaps formed during the sublimation of ice crystals within the coffee matrix. Figure 4c shows the bottom view of the same sample. This surface appears denser and more compact than the top surface, likely because gravitational pressure during freezing reduced crack formation. The SEM image in Figure 4d, also taken at 1000× magnification, shows that the bottom microstructure consists of interconnected reticular networks. The voids within these networks remained after ice crystals sublimated during drying, following solidification during pre-freezing. Overall, FD produced block-shaped samples, with slight morphological variations among tray regions.

Figure 5 shows the physical appearance and microstructure of SFD coffee samples. Figure 5a shows the top view of SFD powder prepared from light-roasted coffee liquid. The powder consisted of spherical particles of different sizes. Particle size analysis showed a maximum diameter of 38.6 μm, a minimum diameter of 17.1 μm, and an average diameter of 27.85 μm. Figure 5b shows an SEM image of a single SFD particle at 2000× magnification. The particle had a spherical shape and a wrinkled surface, likely caused by ice crystal formation during rapid freezing. As water sublimated from the solid to the vapor phase, the particle structure collapsed inward, producing characteristic surface wrinkles and internal pores.

Comparison of TDS concentration and retention efficiency
Table 5 summarizes the TDS concentrations of specialty coffee infusions before dehydration and after reconstitution of FD and SFD powders. Two-way ANOVA followed by Tukey’s HSD test at α= 0.05 showed that roast degree (p < 0.001) and drying method (p < 0.001) significantly affected TDS. However, their interaction was not significant (p = 0.309), indicating that dehydration affected TDS similarly across all roast degrees. TDS increased significantly as roast degree increased from light to dark, regardless of processing stage. In the control group, average TDS increased from 1.356% in light-roasted coffee to 1.496% in dark-roasted coffee. This increase was likely caused by the thermal degradation of high-molecular-weight polysaccharides into smaller, more soluble carbohydrate fragments, alongside the formation of soluble melanoidins during advanced stages of the Maillard reaction. FD samples had TDS values of 1.354-1.494%, which remained close to those of the original infusions. This result suggests that conventional freeze-drying caused little loss of the soluble matrix. In contrast, SFD samples showed a slight but statistically significant decrease in TDS across all roast degrees (1.322% to 1.446%). This decrease may be linked to the rapid atomization and cryogenic freezing, which could alter the solubility of certain complex macromolecules or cause minor physical entrapment within porous microgranules.
Processing efficiency showed that both dehydration methods maintained high retention levels (above 95%). Conventional FD showed high stability (98.45-99.87%), suggesting that the gradual freezing and sublimation steps effectively immobilized the soluble matrix formed during roasting. SFD showed slightly lower retention (95.48-97.49%), likely due to the atomization step. The high surface area-to-volume ratio of the droplets increases exposure at the gas-liquid interface, which may promote transient oxidation or physical entrainment of solutes before cryogenic freezing. Nevertheless, SFD preserved the soluble characteristics of specialty pour-over coffee while providing a useful balance between processing speed and quality retention.
Comparison of TPC
Figure 6 compares TPC among the three roast degrees in the original coffee liquids and in reconstituted FD and SFD coffee powders. TPC decreased as the roast degree increased. Light- roasted coffee had the highest TPC, followed by medium-roasted coffee, while dark-roasted coffee had the lowest TPC. These results agree with previous reported findings in the literature, which attributed the decrease in polyphenols to thermal degradation during roasting (Moon & Shibamoto, 2009). Both drying methods further reduced TPC. Across all roast degrees, FD showed higher TPC retention (65.6-85.5%) compared to SFD (55.0-73.8%). Light-roasted samples showed the highest retention, whereas retention decreased markedly as the roast degree increased. This decrease was particularly evident in SFD samples from medium- and dark roasted coffee, where retention reached approximately 55%. SFD caused greater TCP loss compared to conventional FD. This may be attributed to the atomization step, in which the coffee liquid is ultrasonically nebulized into fine droplets. Atomization greatly increases the surface area exposed to air, potentially leading to oxidative degradation of phenolic compounds.

Total polyphenol content of coffee liquids at different roast degrees and after different drying methods.
Infrared spectroscopic analysis of light-roasted pour-over coffee
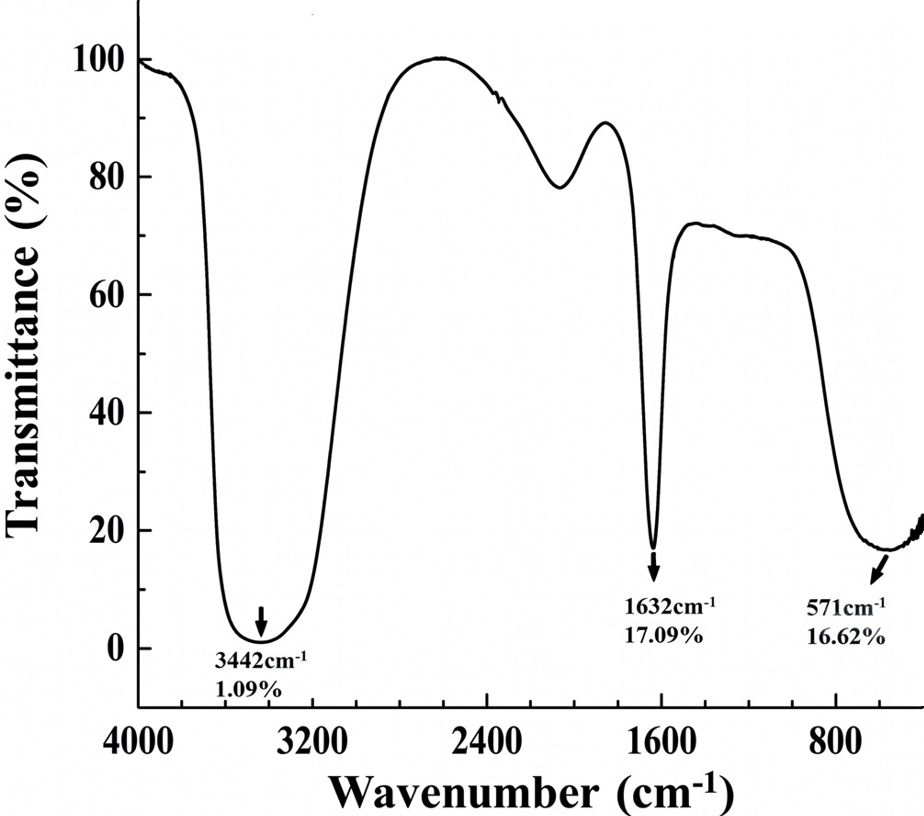
FTIR spectroscopy was used to analyze the molecular composition and functional groups of light-roasted pour-over coffee. Figure 7 shows the resulting spectrum, where the x-axis represents wavenumber (cm⁻¹) and the y-axis represents transmittance (%). Lower transmittance indicates higher absorbance and a higher relative abundance of the corresponding functional groups.

Three main absorption peaks were identified and assigned based on the coffee chemistry literature:
3442 cm⁻¹: The broad, intense peak in the 3200-3600 cm⁻¹ region corresponds to O-H stretching vibrations. This peak indicates hydroxyl groups associated with residual moisture, carbohydrates (e.g., cellulose and hemicellulose), and phenolic compounds (e.g., chlorogenic acids).
1632 cm⁻¹: The sharp peak in the 1600-1700 cm⁻¹ region is attributed to C=O stretching vibrations of carbonyl groups. This region typically includes overlapping signals from the amide I band of proteins, carbonyl groups in caffeine, and ester or acid groups in chlorogenic acids. It may also include contributions from the O-H bending vibrations of water.
571 cm⁻¹: This peak, located in the fingerprint region below 1000 cm⁻¹, is attributed to skeletal bending vibrations and ring deformation modes. These signals are characteristic of the cyclic structures in the coffee matrix, particularly the purine ring of caffeine and the pyranose rings of polysaccharides. This peak suggests that the dried powder retained fundamental alkaloid and carbohydrate structures.
Comparative analysis of FTIR spectra across drying methods and roast degrees
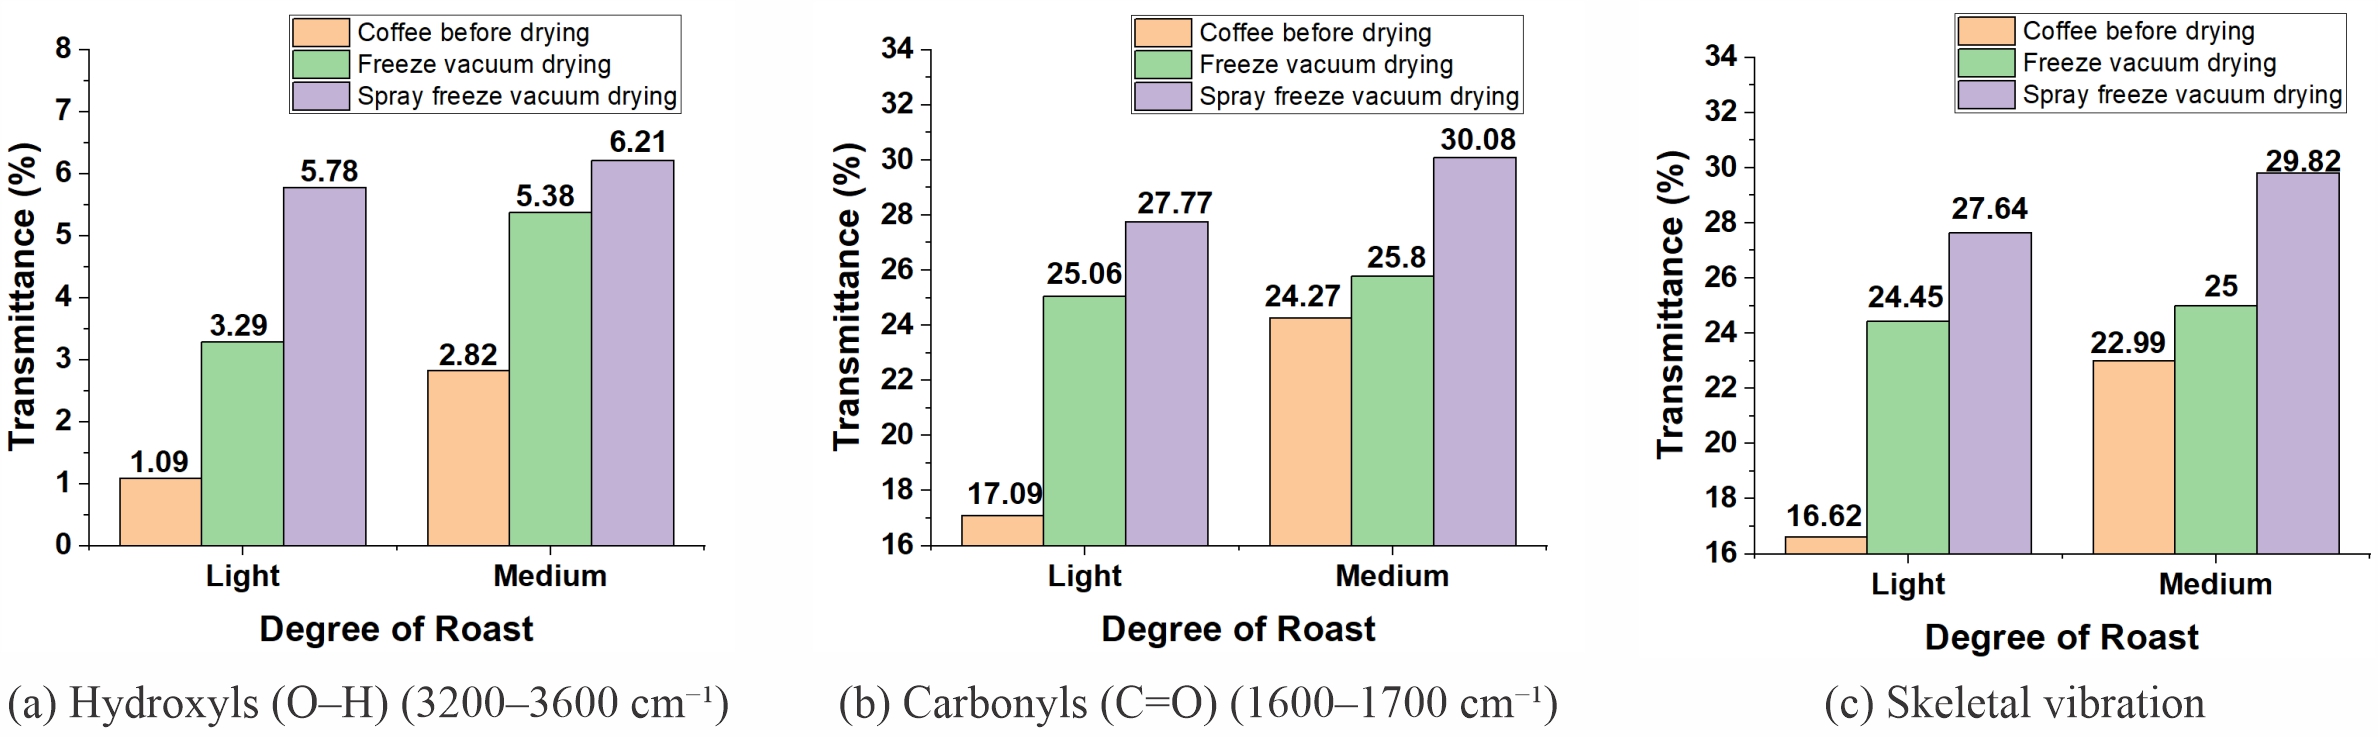
Figure 8 compares FTIR transmittance in selected wavenumber regions for original pour-over coffee and reconstituted FD and SFD coffee at different roast degrees. We focused on changes in the O-H, C=O, and fingerprint regions to assess how the drying method and roast degree affected the chemical stability of the coffee matrix. Regarding the effect of drying method, light- and medium-roasted samples showed higher transmittance after drying than in the original liquid, indicating lower absorbance intensity. SFD samples showed higher transmittance than FD samples, particularly in the O-H (3200-3600 cm⁻¹) and C=O (1600-1700 cm⁻¹) stretching regions. These changes suggest a reduction in hydroxyl- and carbonyl-containing compounds after SFD likely related to the ultrasonic atomization step. During SFD, the coffee extract is dispersed into microdroplets, increasing the surface area exposed to air. This exposure may promote oxidation of labile bioactive compounds, most notably CGAs, which contain phenolic hydroxyl groups and ester carbonyl groups. Oxidation may convert polyphenols into quinones or other degradation products, reducing O-H and C=O absorption intensities. Furthermore, proteins may undergo minor denaturing changes under ultrasonic shear, affecting the amide I region that overlaps with the C=O region. These FTIR results agree with the decrease in TCP in Section 3.5. Overall, while SFD preserved volatiles more effectively, its atomization stage imposes a higher oxidative cost on non-volatile antioxidants compared to the bulk freezing in FD.

Comparison of FTIR transmittance in selected wavenumber regions of coffee samples at different roast degrees and drying methods.
Regarding the effect of roast degree, medium-roasted samples generally showed higher transmittance than light-roasted samples. This lower absorbance intensity likely reflects the thermal degradation of polysaccharides and phenolic compounds (such as the hydrolysis of chlorogenic acids) that occurs during extended roasting. These results align with established coffee chemistry, in which higher thermal loads promote the breakdown of complex organic structures (Shofinita et al., 2024; Deotale et al., 2021).
GC-MS analysis of volatile compounds in medium-roasted coffee
Gas chromatography (GC) was used to analyze the volatile and semi-volatile compounds in medium-roasted coffee samples, including the coffee liquid before drying, the reconstituted FD coffee, and the reconstituted SFD coffee. In the chromatograms, the x-axis represents the retention time and the y-axis represents the relative abundance of detected compounds (Figure 9). The main peaks were observed at retention times of 12.65, 15.33, and 41.36 min, corresponding to acetic acid (C2H4O2), 2-furanmethanol (C5H6O2), and caffeine (C₈H₁₀N₄O₂), respectively.

Gas chromatogram of medium roasted of (a) Coffee liquid before drying. (b) Reconstituted FD coffee. (c) Reconstituted SFD coffee.
Acetic acid and 2-furanmethanol were the main characteristic peaks in the original coffee liquid (Figure 9a) (Gao et al., 2025; Xiao et al., 2022). The latter is an important Maillard-derived marker associated with roasted, sweet, and caramel-like notes (Xiao et al., 2022). The FD sample retained acetic acid, but the 2-furanmethanol peak was markedly reduced or absent (Figure 9b). This loss is presumably attributed to the slow freezing step in conventional FD. During ice crystal growth, solute exclusion can concentrate volatile compounds near the surface, increasing their loss during the prolonged vacuum drying phase. Conversely, the SFD sample preserved the 2-furanmethanol peak at RT 15.32 min (Figure 9c), indicating better retention of this aroma compound. This improved retention is related to the rapid atomization and flash-freezing steps in SFD. Through rapid cooling, aroma compounds can become entrapped within the solid matrix before extensive phase separation occurs. This microencapsulation-like effect may reduce volatile loss during vacuum drying. Overall, these results show that SFD technology preserves semi-volatile roasted aroma compounds in medium-roasted coffee more effectively than conventional FD. Medium-roasted coffee was selected for volatile profiling because it provides a balanced aroma profile in specialty Arabica coffee, making it suitable for comparing the aroma retention capacity of FD and SFD.
Comparative mechanism of FD and SFD processing
The different outcomes of FD and SFD result from differences in their freezing and dehydration mechanisms. In FD, slow freezing promotes the growth of large, directional ice crystals, producing the lamellar and sheet-like microstructure observed in Figure 4. However, this gradual process can drive solute exclusion. As ice crystals grow, volatile compounds may be displaced toward the ice crystal surface and then lost during the prolonged 51 h sublimation. By contrast, SFD uses ultrasonic atomization to generate microdroplets that freeze almost instantly in liquid nitrogen. This rapid solidification reduces molecular mobility and can trap volatile markers, such as 2-furanmethanol, within a fine, spherical matrix through a microencapsulation-like effect. This architecture helps SFD preserve roasted aroma compounds more effectively than FD. However, atomization also greatly increases the surface area-to-volume ratio of the droplets. This larger exposed surface may increase oxidative stress and accelerate the degradation of non-volatile polyphenols compared to the bulk-frozen FD samples. Therefore, the choice between FD and SFD involves a trade-off between preserving antioxidant capacity and retaining aromatic complexity.
Conclusions
This study integrated GC-MS, SEM, and FTIR to evaluate FD and SFD on specialty pour-over coffee. Roast degree influenced composition; darker roasts increased TDS but decreased TPC. FD preserved non-volatile compounds, while SFD improved aroma retention and efficiency. SFD is an alternative for high-quality instant coffee. However, results apply to specialty coffee, not mass-market extracts. Future research should include sensory analysis, multiple origins, and scale-up conditions to assess industrial feasibility and consistency.
Data Availability Statement
Data available upon request to authors.
References
- Adali, M. B. et al. (2022). Ultrasonic spray freeze-drying of sucrose and mannitol-based formulations: Impact of the atomization conditions on the particle morphology and drying performance. Drying Technology, 41(2):251-261.
- Al-Ghamdi, S. et al. (2024). Advancements in coffee manufacturing: From dehydration techniques to quality control. Food Engineering Reviews, 16:513-539.
- Bhumiratana, N., Adhikari, K., & Chambers, E. (2011). Evolution of sensory aroma attributes from coffee beans to brewed coffee. LWT - Food Science and Technology, 44(10):2185-2192.
- Córdoba, N. et al. (2021). Specialty and regular coffee bean quality for cold and hot brewing: Evaluation of sensory profile and physicochemical characteristics. LWT - Food Science and Technology, 145:111363.
- Deotale, S. M. et al. (2020). Stability of instant coffee foam by nanobubbles using spray-freeze drying technique. Food and Bioprocess Technology, 13:1866-1877.
- Deotale, S. M. et al. (2022). Influence of drying techniques on sensory profile and chlorogenic acid content of instant coffee powders. Measurement: Food, 6:100030.
- Wienhold, K., & Roberts, P. W. (2025). Is the rising tide of specialty coffee lifting all boats? World Development, 195:107103.
- Gao, Y. et al. (2025). Characterizing and decoding the effects of co-culture fermentation on dark tea infusion flavor development: Elucidating microbial succession and metabolic dynamics mediated by Eurotium cristatum and water kefir. Food Chemistry: X, 30:102876.
- Ghirişan, A. D., & Miclăuş, V. (2017). Comparative study of spray-drying and freeze-drying on the soluble coffee properties. Studia Universitatis Babes-Bolyai Chemia, 62(4):309-316.
- Ishwarya, S. P., & Anandharamakrishnan, C. (2015). Spray-freeze-drying approach for soluble coffee processing and its effect on quality characteristics. Journal of Food Engineering, 149:171-180.
- Jadhav, K. et al. (2024). A critical review on developments in drying technologies for enhanced stability and bioavailability of pharmaceuticals. Drying Technology, 42(9):1415-1441.
- Kalschne, D. L. et al. (2018). Steam pressure treatment of defective Coffea canephora beans improves the volatile profile and sensory acceptance of roasted coffee blends. Food Research International, 105:393-402.
- Moon, J. K., & Shibamoto, T. (2009). Role of roasting conditions in the profile of volatile flavor chemicals formed from coffee beans. Journal of Agricultural and Food Chemistry, 57(13):5823-5831.
- Mujumdar, A. S. (2007). An overview of innovation in industrial drying: Current status and R&D needs. Transport in Porous Media, 66:3-18.
- Pereira, L. L. et al. (2023). Impacts of brewing methods on sensory perception and organoleptic compounds of coffee. Food Chemistry Advances, 2:100185.
- Reis, T. A. D. et al. (2019). Instant coffee with steamed PVA beans: Physical-chemical and sensory aspects. Ciência e Agrotecnologia, 43:e026119.
- Seninde, D. R., Chambers, E. IV., & Chambers, D. (2020). Determining the impact of roasting degree, coffee to water ratio and brewing method on the sensory characteristics of cold brew Ugandan coffee. Food Research International, 137:109667.
- Shofinita, D. et al. (2024). Drying methods of coffee extracts and their effects on physicochemical properties: A review. Food and Bioprocess Technology, 17:47-72.
- Siddiqui, S. A. et al. (2024). Impact of drying on techno-functional and nutritional properties of food proteins and carbohydrates - A comprehensive review. Drying Technology, 42(4):592-611.
- Sunarharum, W. B. et al. (2014). Complexity of coffee flavor: A compositional and sensory perspective. Food Research International, 62:315-325.
- Sunarharum, W. B., & Farhan, M. (2020). Effect of manual brewing techniques on the sensory profiles of Arabica coffees (Aceh Gayo wine process and Bali Kintamani honey process). IOP Conference Series: Earth and Environmental Science, 454:012099.
- Waghmare, R. B. et al. (2021). 3.05 Recent developments in freeze drying of foods. In K. Knoerzer., & K. Muthukumarappan. Innovative food processing technologies: A comprehensive review Elsevier Inc. All rights reserved, (pp.82-99).
- Xiao, Y. et al. (2022). Characteristic fingerprints and change of volatile organic compounds of dark teas during solid-state fermentation with Eurotium cristatum by using HS-GC-IMS, HS-SPME-GC-MS, E-nose and sensory evaluation. LWT, 169:113925.
- Yeretzian, C. et al. (2019). Coffee volatile and aroma compounds - From the green bean to the cup. In A. Farah (Ed.), Coffee: Production, quality and chemistry Royal Society of Chemistry. (pp.726-770).
-
Editor de seção:
Renato Paiva http://orcid.org/0000-0001-5107-0285

 Thumbnail
 Thumbnail
 Thumbnail