 Genetic evaluation of longevity in Brown Swiss dairy cows using survival models with simulated data
Abstract
The longevity of Brown Swiss dairy cows was evaluated using the non-parametric Kaplan-Meier estimator and the Cox and Weibull proportional hazards models through computer simulation. A dataset comprising 10,000 records was generated to simulate cow longevity, defined as the time until the occurrence of five consecutive calvings (event). Age at first calving, herd, and sire (the cow’s father) were analyzed as covariates. The starting point of the study was set at 2,196 days (72 months of age), and the maximum time to failure was 2,562 days (84 months of age). The Kaplan-Meier survival function was used to estimate the survival and hazard rate curves associated with female longevity, identifying the influence of each covariate on the time until the event. Analyses using the Cox and Weibull models were also performed. All covariates significantly influenced cow longevity, according to the Log-Rank and Wilcoxon tests. The mean and median times until the occurrence of the event were approximately 2,435 days. It was observed that sires with superior breeding values presented a greater risk of having daughters reaching five consecutive calvings until 84 months of age, indicating that the event can occur in a shorter average time. In this case, such sires may be used as fathers of future generations as a strategy to enhance the longevity of their offspring.
Keywords:
censored data; cow stayability in the herd; Cox and Weibull models; product-limit estimator
Resumo
A longevidade de vacas leiteiras da raça Pardo-Suíça foi avaliada utilizando o estimador não paramétrico de Kaplan-Meier e os modelos de riscos proporcionais de Cox e Weibull, por meio de simulação computacional. O conjunto de dados era composto de 10.000 registros simulados referentes à longevidade das vacas, definida como o tempo até a ocorrência de cinco partos consecutivos (evento). A idade ao primeiro parto, o rebanho e o touro (pai da vaca) foram analisados como covariáveis. O ponto inicial do estudo foi estabelecido em 2.196 dias (72 meses de idade) e o tempo máximo até a falha foi de 2.562 dias (84 meses de idade). A função de sobrevivência de Kaplan-Meier foi utilizada para estimar as curvas de sobrevivência e de taxa de risco associadas à longevidade das fêmeas, identificando a influência de cada covariável sobre o tempo até o evento. Análises utilizando os modelos de Cox e Weibull também foram realizadas. Todas as covariáveis influenciaram significativamente a longevidade das vacas, de acordo com os testes de Log-Rank e Wilcoxon. Os tempos médio e mediano até a ocorrência do evento foram de, aproximadamente, 2.435 dias. Observou-se que touros com valores genéticos mais elevados apresentaram um risco maior de terem filhas que alcançam os cinco partos consecutivos até os 84 meses de idade, indicando que o evento pode ocorrer em um tempo médio mais curto. Nesse caso, tais reprodutores podem ser utilizados como pais de futuras gerações, como estratégia para aumentar a longevidade de suas progênies.
Palavras-chave:
dados censurados; estimador produto-limite; modelos de Cox e Weibull; permanência da vaca no rebanho
1. Introduction
In Brazil, Brown Swiss cattle are reared as a dual-purpose breed (for both milk and meat production) and are recognized for their notable longevity, which is attributed to their remarkable adaptability to tropical climates, rusticity, and sound structural conformation, including good feet and legs (1). Dairy cow longevity can be defined in different ways, including stayability in the herd, length of productive lifespan, age, and/or the number of lactations and calvings (2). Alternatively, longevity can be quantified as the number of days from the first calving until death, culling, or censoring of the cow (3, 4).
Currently, longevity is considered a highly desirable trait because of its substantial impact on the economic profitability of dairy cattle herds, contributing towards a more sustainable milk production (5), particularly by reducing greenhouse gas emissions associated with young stock rearing (6, 7). Increased longevity leads to higher average milk yield and reduces the need for replacement heifers to substitute culled cows, which are generally removed due to functional problems, reproductive inefficiency, or diseases. Consequently, production costs are reduced because cows remain longer in higher-producing age groups (6, 8), contributing to an additional three to four lactations and increasing annual earnings by approximately 11 % to 13 % (9, 10). Healthy and mature cows are known to produce more milk than younger females (11), while methane emissions per animal do not increase with advancing age (12), thereby contributing to a lower carbon footprint associated with milk production (11) and longevity.
In dairy cattle, real longevity measurements are only obtained when a cow is slaughtered, culled, or removed following selection decision-making processes (8, 9), which are primarily driven by economic purposes (6). However, during genetic evaluations, some cows may still be in the reproductive phase, when only the lower limit of their phenotypic value is known (13). In these situations, the records are treated as censored data. Excluding such records from the analysis or incorrectly treating them as uncensored data may result in biased estimates.
The presence of censoring is one of the main characteristics that distinguishes survival analysis from other statistical approaches, as it enables the inclusion of censored or incomplete observations and accommodates the non-normal distribution of survival times (14-16). This methodology has provided higher heritability estimates for longevity trait (0.15 to 0.20) compared with linear models (0.05 to 0.10) (4, 17). Consequently, several countries have replaced linear models with survival models in the genetic evaluation of dairy bulls (18-20).
In survival analysis, several parametric and non-parametric statistical methods are available for handling censored data. The Kaplan-Meier non-parametric estimator, also known as the product-limit estimator (21), is the most widely used method for estimating survival functions (22), as it does not require assumptions regarding the probability distribution of failure times, thus providing considerable flexibility (23, 24). The Cox (semi-parametric) and Weibull (parametric) models are classified as proportional hazards models (25) because they describe the risk of an animal being culled or slaughtered at a given time as the product of a baseline hazard function, h0(t), and a positive term. In addition, these models may include random effects, such as ‘frailty’ term, becoming known as survival mixed models or frailty models (25, 26).
Therefore, this study aimed to evaluate the longevity of Brown Swiss dairy cows, using simulated data, employing both the Kaplan-Meier estimator and the proportional hazards models of Cox and Weibull.
2. Material and methods
For this study, ten thousand records simulating the longevity trait of Brown Swiss dairy cows were generated using the ‘simul.exe’ tool, which is part of “The Survival Kit v.6.1” software (27). These records included the respective times until the occurrence of five consecutive calvings, taken as an event indicative of a long-lived cow. The covariates considered in this simulation were the heifer’s age at first calving (AFC), the herd, and the sire (the cow’s father).
The time in days until the event (fifth calving) was calculated under the assumption that heifers were artificially inseminated throughout the year. This approach ensured that the time variable followed a continuous distribution (24). Artificial insemination commenced from the age of 458 days (approximately 15 months). The gestation period for cows was set at 280 days (roughly 9.2 months), with the AFC for heifers ranging between 24 and 36 months. According to the Brazilian Association of Brown Swiss Cattle Breeders (1), the average AFC for Brown Swiss females reared in Brazil is 29 months, with a service period (time between calving and subsequent pregnancy) varying from 90 to 100 days. To mirror the reality of the Brazilian dairy production systems, heifers were categorized into three AFC classes: Class 1 included heifers that first calved between 24 and 28 months of age; Class 2 comprised those calving between 29 and 32 months of age; and Class 3 encompassed heifers that first calved between 33 and 36 months of age. Therefore, in our simulation, females aged 24 to 36 months were considered capable of first-time calving. Guedes et al (28) reported an average AFC of 987 days when applying survival analysis to the genetic evaluation of this trait in a small real dataset of Brown Swiss dairy cows reared in Brazil's Semiarid region. They established 1,098 days (36 months from birth) as the maximum time for AFC occurrence, considering the European origin of the Brown Swiss breed, which typically has later maturation. The AFC observed in their study ranged from 736 to 2,365 days (28).
The pedigree file used in this study contained information on 50 bulls (sires), each generating the same number of daughters through artificial insemination. Specifically, each bull sired 200 daughters, which were evenly distributed across four different herds, resulting in an average of 2,500 heifers per herd and 50 daughters per bull within each herd. In addition, the pedigree file included information on ten paternal grandfathers. Each grandsire produced five sons (bulls) and contributed to a total of 1,000 granddaughters (heifers).
The starting point of the study was established at 2,196 days (72 months), corresponding to the age at which Brown Swiss cows are generally expected to have reached their fifth calving, including dry periods. The median failure time was set at 2,440 days (80 months), while the maximum failure time was established at 2,562 days (84 months). This upper limit was adopted because females that had not achieved at least five consecutive calvings by 84 months of age were considered late-maturing or unproductive cows and were therefore culled from the herd at the end of the study period.
Since, by definition, the fifth calving could not occur before 2,196 days, the time scale for cow stayability in the herd was adjusted to exclude this initial period without event occurrence. Consequently, the beginning of the study period (2,196 days) was redefined as day 0, whereas the end of the study period (2,562 days) was redefined as day 366, with a median time of 244 days (equivalent to 2,440 days on the original scale). Therefore, 2,196 days should be added to the reported results to recover the original time scale.
In the simulation, all times between 0 and 366 days were classified as failure times and assigned a score of 1, indicating that the event (fifth calving) occurred within the predetermined study period. Conversely, time records exactly equal to 366 days were classified as censored times and assigned a score of 0, indicating that the event occurred at an unknown time after the study period. Thus, censored heifers would have reached their fifth calving sometime after the censoring point, representing a typical case of right censoring and Type I censoring (26).
2.1 Non-parametric method
The Kaplan-Meier estimator is defined by the following formula (22):
Where is the survival function value at time t; tj are j distinct and ordered failure times; dj is the number of animals that failed at tj; and nj is the number of animals at risk in tj, that is, the females that had neither failed nor been censored up to the instant immediately before time tj.
The SAS LIFETEST procedure (29) was employed to obtain the Kaplan-Meier estimator of the survival function (). This was done to estimate the survival curves and hazard rates associated with the longevity of cows, as well as to determine the influence of each covariate on the time until the event. The estimate plays a key role in assessing whether the time variable's density aligns with a specific parametric family (30). Furthermore, the adequacy of the Weibull model (31) can be evaluated by plotting . The resulting curve should be approximately linear, as observed in this study.
The non-parametric tests used to verify the equality of stayability probabilities among the different covariate strata were the Multivariate Log-Rank and Multivariate Wilcoxon tests. The test statistics for both tests approximately follow a chi-square distribution with p degrees of freedom, where p corresponds to the number of groups within each covariate minus one.
2.2 Parametric models
The paternal grandsire effect was generated from a normal distribution, (25, 32). The variance between bulls (sires) was set at 0.04, a value derived from heritability estimates for the longevity trait of the Brown Swiss breed reported in the literature (from 0.10 to 0.15) under linear mixed models. This variance value of 0.04 was calculated using the effective heritability formula: , as proposed by Yazdi et al (32). This formula was specifically developed for Weibull proportional hazards survival models and is comparable to conventional linear mixed-model analyses.
During the simulation, the variances between bulls and between paternal grandsires were combined. Consequently, the overall variance applied in the simulation was 0.05. This value was derived by adding the variance between the paternal grandsires to the variance between bulls , which was 0.04. Therefore, the combined variance was .
All analyses utilizing the parametric Weibull model and the semi-parametric Cox model were conducted using the “The Survival Kit v.6.1” software (27). This software employs an empirical Bayesian approach for parameters estimation.
2.3 Weibull model
The Weibull proportional hazards model employed in this study is represented as:
Where hikjl(t is the risk of a cow “l”, bull daughter “j”, with AFC class “k” and belonging to the herd “i”, in relation to time “t”, reaching the fifth calving; h0 (t) represents the Weibull baseline hazard (λρ(λt)ρ−1), where “λ” is the scale parameter and “ρ” is the shape parameter of the distribution; idk is the fixed effect of the time-independent covariate class of heifer AFC “k” (1, 2 or 3); rebi is the fixed effect of the time-independent covariate herd “i” (1 to 4); and tj is the time-independent random effect of the sire (cow's father), such that zj = exp{tj} represents the frailty value (hazard rate). A multivariate normal distribution was assumed to have mean zero and variance of , where is the variance among bulls, and "A" is the additive genetic relationship matrix between the bulls. For simplicity, paternal grandsires were not included in this matrix; therefore, sires were considered unrelated to each other.
According to Colosimo & Giolo (26), the parameter “λ” has the same measurement unit as “t” and “ρ” is dimensionless. In addition, “ρ < 1” indicates that the risk decreases with time; “ρ > 1” means that the risk increases with time; and “ρ = 1” indicates that the risk is constant. In this study, the parameter "ρ" of the Weibull hazard function was set at a fixed value of 2.5, indicating an increasing risk for the occurrence of the event of interest in females over time. This is consistent with common practice in cattle longevity analysis, where a value of “ρ ≥ 2” is often utilized (32).
The heritability (h2) of the longevity trait, analyzed under the Weibull model, was estimated using the effective h2 formula proposed by Yazdi et al (32): .
2.4 Cox model
In this study, the Cox proportional hazards model was fitted using the method of partial maximum likelihood. The regression coefficients estimated by this model can be interpreted as effects that either accelerate or decelerate the hazard function. The Cox model was expressed as:
Where hikjl(t) is the risk of a cow “l”, bull daughter “j”, from AFC class “k” and belonging to the herd “i”, at the time “t”, reaching the fifth calving; h0(t) is an unspecified or unknown baseline hazard function; idk is the fixed effect of the time-independent covariate class of heifer AFC “k” (1, 2 or 3); rebi is the fixed effect of the time-independent herd covariate “i” (1 to 4); and tj is the time-independent random effect of the sire (cow's father), with zj = exp{tj} representing the frailty value (hazard rate).
The time-independent fixed covariates included in the model were the AFC class of the heifer (1 to 3), and herd (1 to 4). The sire (cow's father) information was included as random covariate, following a multivariate normal distribution with mean zero and variance of .
The h2 of the longevity trait, using the Cox model, was calculated based on the logarithmic h2 formula proposed by Ducrocq & Casella (25): , where is the residual variance in an extreme value distribution.
3. Results and discussion
Based on the results obtained by Kaplan-Meier estimator of the survival function, it was possible to determine the total number of cows that experienced the event (failed) within the predefined period, as well as the number of censored observations (Table 1). Among the 10,000 Brown Swiss cows included in this study, 8,144 successfully achieved five consecutive calvings up to 366 days (2,562 days on the original scale), corresponding to 81.44 % of the sample, whereas the remaining 18.56 % represented censored observations.
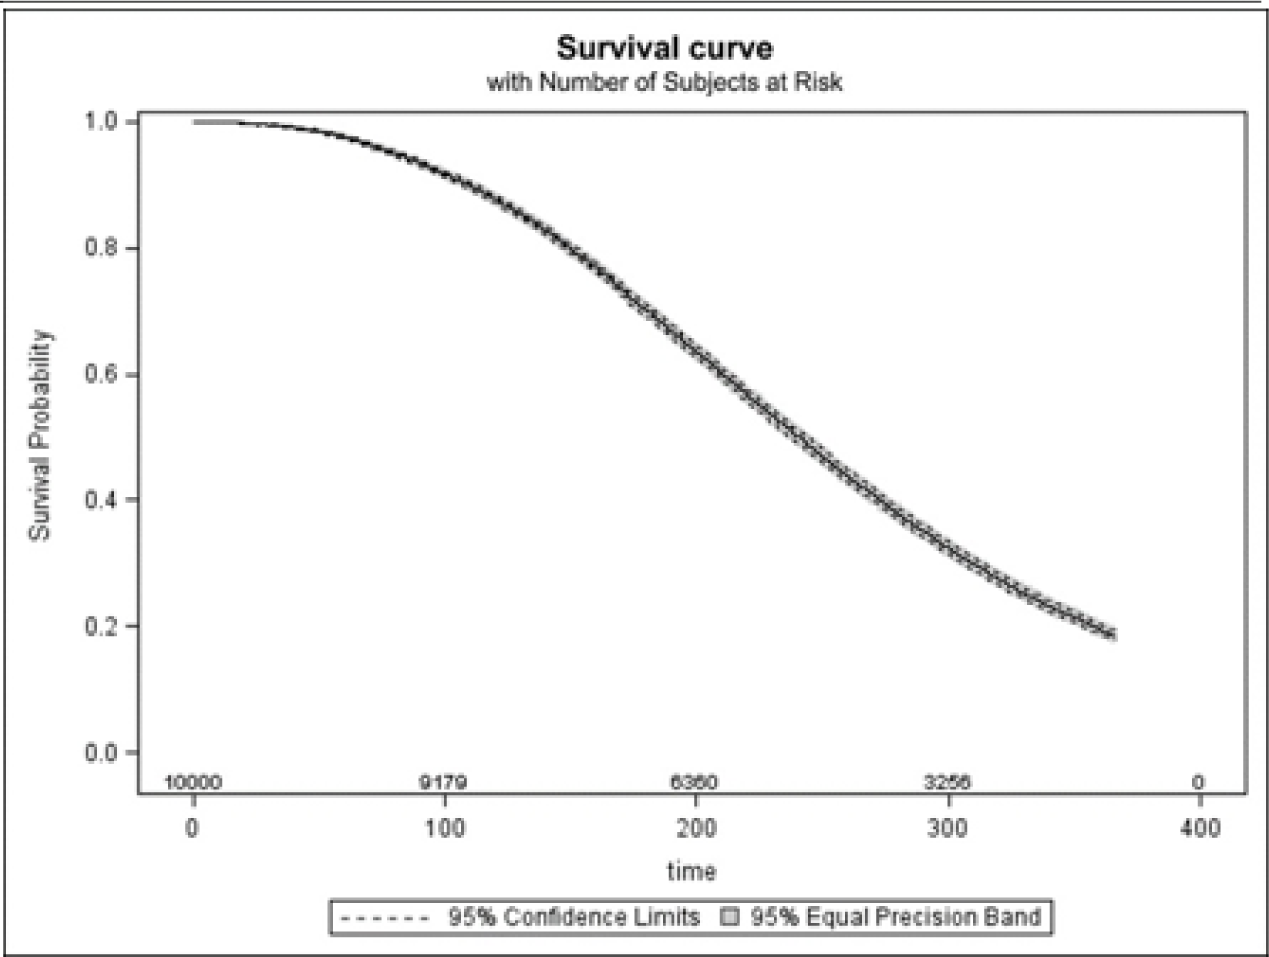
The mean age of the cows was 240.28 days (2,436.28 days on the original scale), whereas the median age was 241 (2,437) days. The survival curve showed a progressive decline from 0 to 366 (2,196 to 2,562) days, corresponding to a decrease in survival probability from 1.0 to 0.186 throughout the study period (Figure 1). After 366 (2,562) days, all animals were censored. This represents a typical example of right censoring (Type I censoring) since no additional information on the cows was available after the end of the study period (22, 26). Therefore, the curve was extended only until day 366.

Survival curve, including the number of survivors (above the x-axis) over time, with a 95 % confidence limit for the longevity of Brown Swiss cows from 0 to 366 days.
The hazard function, which represents the instantaneous failure rate of the event of interest occurring at time “t”, conditional on survival up to “t”, exhibited an increasing trend up to 366 (2,562) days (Figure 2). This increase was also reflected in the widening of the hazard function values (gray area in the graph corresponding to the 95 % confidence limit). The hazard rate peaked at approximately 0.009 at the end of the study period, indicating that the risk of cows achieving five consecutive calvings was highest at 366 (2,562) days, close to 84 months of age.

Epanechnikov Kernel–Smoothed hazard function for the occurrence of five consecutive calvings in Brown Swiss cows.
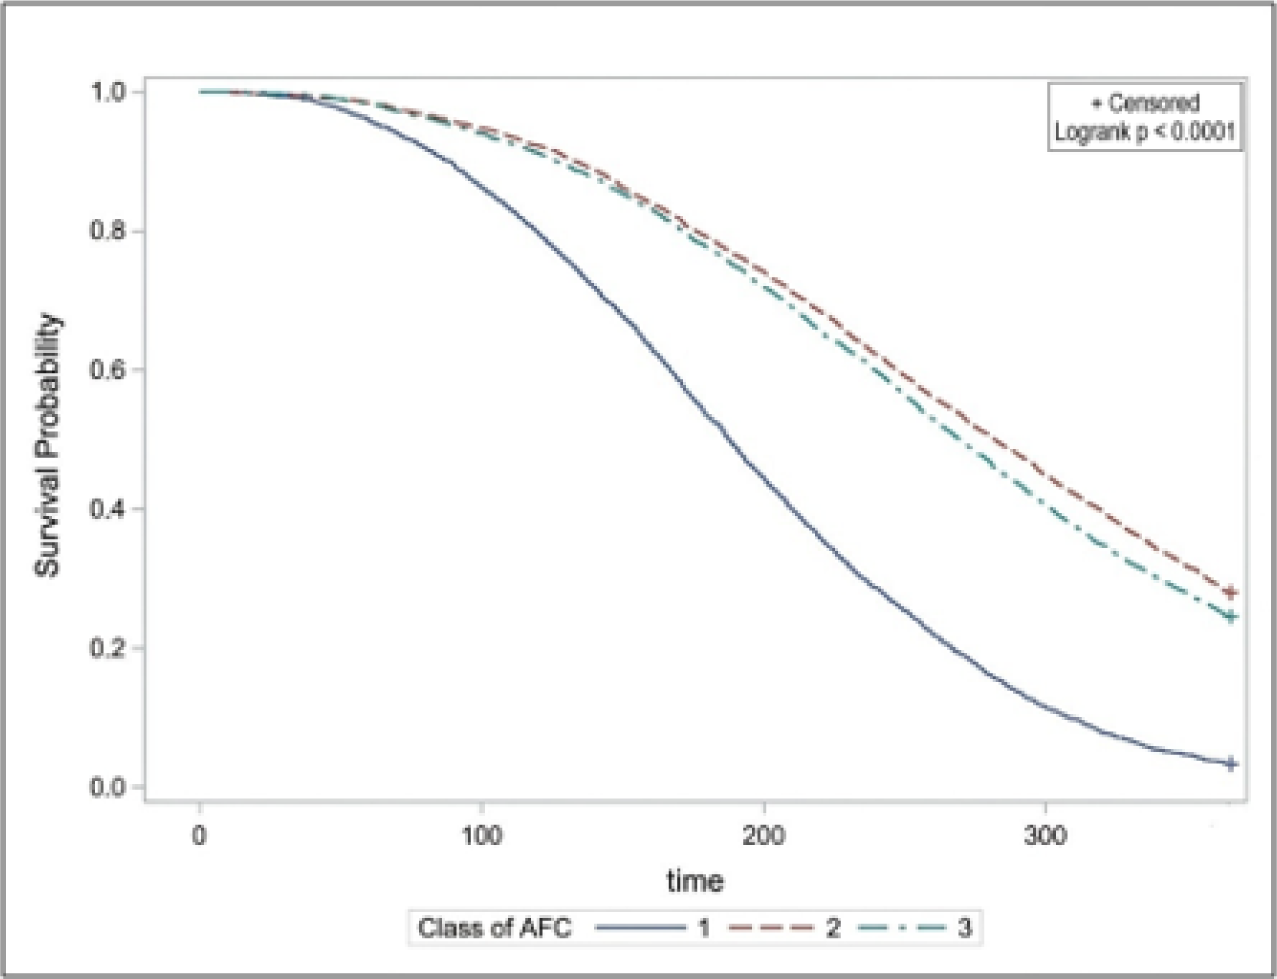
Regarding the AFC covariate (Table 2), the distribution of animals among AFC classes was approximately uniform. However, clear differences were observed in the percentages of uncensored (failed) and censored (surviving) animals among these classes. AFC Class 2 contained the largest percentage of animals (33.47 %) as also the highest percentage of censored (surviving) animals (27.97 %) (Figure 3). In contrast, AFC Class 1 exhibited the highest percentage of failed cows (96.73 %) and, consequently, the lowest percentage of censored cows (3.27 %). Significant differences (p < 0.0001) among AFC classes were detected by both the Log-Rank and Wilcoxon tests, with chi-square statistics of: χ2 = 1,713.16 and χ2 = 1,462.05, respectively, both with 2 degrees of freedom (df).
Total number (N) of animals, uncensored animals, censored animals, and their respective percentages according to AFC class and herd.
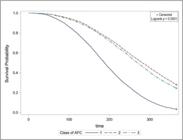
Survival probability curve for five consecutive calvings in Brown Swiss cows considering AFC class as a covariate.
The influence of AFC on length of productive lifespan may be significant (33, 34), corroborating the findings of the present study. In Holstein breed dairy cows, Amirpour Najafabadi et al (34) also reported that the proportional culling risk among heifers with the first calving after 34 months of age was approximately twice that observed for heifers calving for the first time between 20 and 22 months. Moreover, elevated AFC in heifers has been associated with future reproductive problems or diseases incidence, contributing to higher culling rates (2,35). Contrarily, some studies (14,35) reported no significant effect of AFC on longevity.
In the Cox model (Table 3), the AFC covariate indicated that Class 2 presented the lowest regression coefficient estimate, whereas Class 1, used as the reference group by having a hazard rate of 1.0, had the highest coefficient. Similarly, in the Weibull model (Table 3), the same covariate showed the lowest value for Class 2 and the highest value for Class 1 that remained the reference group with a hazard rate of 1.0. In both models, AFC Class 2 had the lowest hazard rate for the event, indicating a greater survival for its cows (Figure 3). This suggests that cows in Class 2 were less likely to achieve five consecutive calvings within the study period and, consequently, were more likely to be culled at the end of the experiment to avoid negatively impacting reproductive efficiency.
Regression coefficients estimated by the Cox and Weibull models, standard error (Std-error), χ2 statistics, and hazard rate for the occurrence of five consecutive calvings according to AFC class and herd.
A linear increase in the relative risk of culling was observed with increasing AFC (33) indicating that heifers calving at younger ages tend to have a lower culling risk than those calving later. In the present study, heifers from AFC Class 1 showed a lower survival to the event, meaning they were more likely to achieve five consecutive calvings. This, in turn, indicates a lower culling risk, which aligns with the results of M’hamdi et al (33). It is worth noting that a greater survival to the event is undesirable, as it means that cows will not reach five consecutive calvings within the study period and therefore will face a greater risk of culling. Thus, cows in AFC Classes 2 and 3 were more susceptible to culling.
Herds exhibiting a more rapid decline in their survival curve are of particular interest because their cows tend to achieve five consecutive calvings (the event) within a shorter period, which is economically advantageous. According to Table 2, Herd 1 contained the largest number of animals and the greatest number of censored (surviving) animals, whereas Herd 3 had the lowest number of animals and censored cows, indicating that it had the highest number of failed cows.
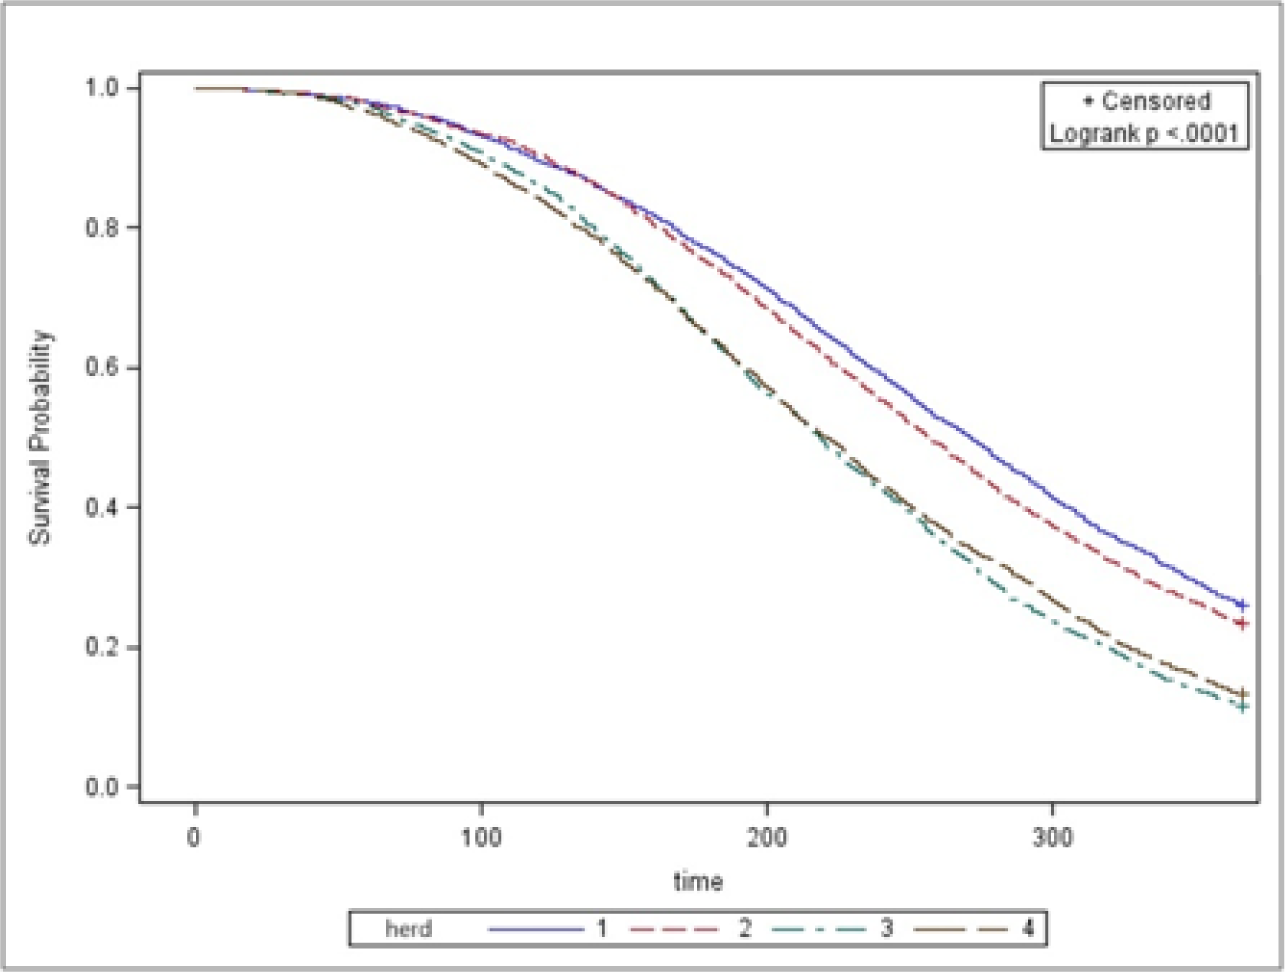
Throughout most of the study period, Herd 1 maintained higher survival compared with the other herds (Figure 4), whereas Herd 3 exhibited the lowest survival starting from approximately 200 days (2,396 days on the original scale). To evaluate equality among herds, the Log-Rank and Wilcoxon tests were applied. Significant differences (p < 0.0001) were observed among herds for both tests, with chi-square statistics of χ2 = 348.20 (3 df) for the Log-Rank test and χ2 = 310.15 (3 df) for the Wilcoxon test. In actual production systems, such differences among herds may reflect distinct environmental conditions that can positively or negatively affect the genetic potential of cows for reproductive (24) and productive (36, 37) performance.

Survival probability curve for five consecutive calvings in Brown Swiss cows considering herd as a covariate.
The regression coefficient estimates for the herd covariate under the Cox and Weibull models are shown in Table 3. In the Cox model, Herd 3 was taken as the reference group, with a regression coefficient of zero and a hazard rate of 1.0. Herd 1 exhibited the lowest regression coefficient and, consequently, the lowest hazard rate. Similarly, in the Weibull model, Herd 3 was also considered the reference group, whereas Herd 1 showed the lowest regression coefficient and the lowest hazard rate for achieving five consecutive calvings.
Although the regression coefficients estimated for AFC and herd covariates were similar in both models, Hu et al (2) affirmed that the Weibull regression model may be more accurate than the Cox proportional hazards model, despite its greater complexity. This is because the Weibull model is a fully parametric method based on the Weibull distribution, whereas the Cox model is semi-parametric and does not require specification of the baseline hazard function. In addition, the Weibull model may offer greater flexibility for handling censored data, time-dependent covariates, screening procedures (2) and variable selection.
Grzesiak et al (16) highlighted a significant association between longevity and culling reasons with milk production traits and the reproductive performance of cows under different management conditions, such as herd size and culling season. Therefore, understanding the environmental factors or other non-genetic sources of variation affecting traits related to the growth, reproduction and development of the herds is crucial. This knowledge allows us to improve decision-making, enhance the economic profitability of dairy production systems, and facilitate the implementation of breeding programs tailored to diverse environmental conditions (38).
On the other hand, to simplify the simulated scenarios, we assumed that all possible non-genetic effects, that could influence the risk of a cow being culled from the herd, were indirectly accounted for through the inclusion of “herd” as a fixed covariate in both survival models. In this way, factors such as nutritional management (quality and composition of forage and concentrate, level of energy intake, and feeding behavior), reproductive management (artificial insemination practices, breeding season, or animal replacement strategies), health status, lactation stage, body condition score of cows, or even systematic differences in herd culling policies were assumed to be incorporated into the herd effect. Therefore, differences among herds reflected different management practices or environmental conditions. For instance, regarding nutritional factors, several authors (19, 39-41) did not explicitly include any specific nutritional covariates in their survival models when analyzing real datasets of dairy cows and goats. At most, they highlighted that feeding effects were embedded in the covariates associated with the herd, evaluated in their studies.
Nevertheless, Grandl et al (7), studying the length of productive lifespan in Brown Swiss dairy cows fed diets with or without concentrate supplementation, observed lower enteric methane emissions from cows receiving concentrate. This reduction in greenhouse gas emissions could decrease the negative climate impact, especially if associated with the increased longevity of these animals. However, those authors employed a linear parametric regression model rather than survival analysis.
Furthermore, other authors (11,36) reviewed additional nutritional factors that may directly or indirectly affect milk yield and length of productive lifespan, including early-life nutrition of female calves destined to become replacement heifers, negative energy balance and increased risk of ketosis during the transition period around calving, hypocalcemia (milk fever) in the peripartum period, and feeding management systems (pasture-based versus indoor housing). Indoor housing systems, in particular, may increase the incidence of clinical mastitis and lameness in indoor-housed cows, reducing dry matter intake and consequently decreasing milk production.
Among the 50 evaluated bulls, Table 4 presents the five superior bulls with the highest numbers of uncensored daughters (upper section), and the five worst bulls with the highest numbers of censored daughters (lower section). The five top-ranked bulls (best classified sires) produced the greatest number of daughters that achieved five consecutive calvings and the fewest censored daughters. Considering the worst bulls, Bull 43 had the highest number of daughters failing to achieve five consecutive calvings (censored daughters) and the smallest number of successful daughters (uncensored daughters). Significant differences (p < 0.0001) were observed among bulls, with chi-square statistics of χ2 = 301.71 for the Log-Rank test and χ2 = 263.48 for the Wilcoxon test. To improve herd genetics, bulls whose daughters remain productive in the herd for longer periods should be selected, as indicated by a rapid decline in their survival curve over time.
Top five bulls with the highest numbers (and percentage) of uncensored (above) and censored (below) daughters.
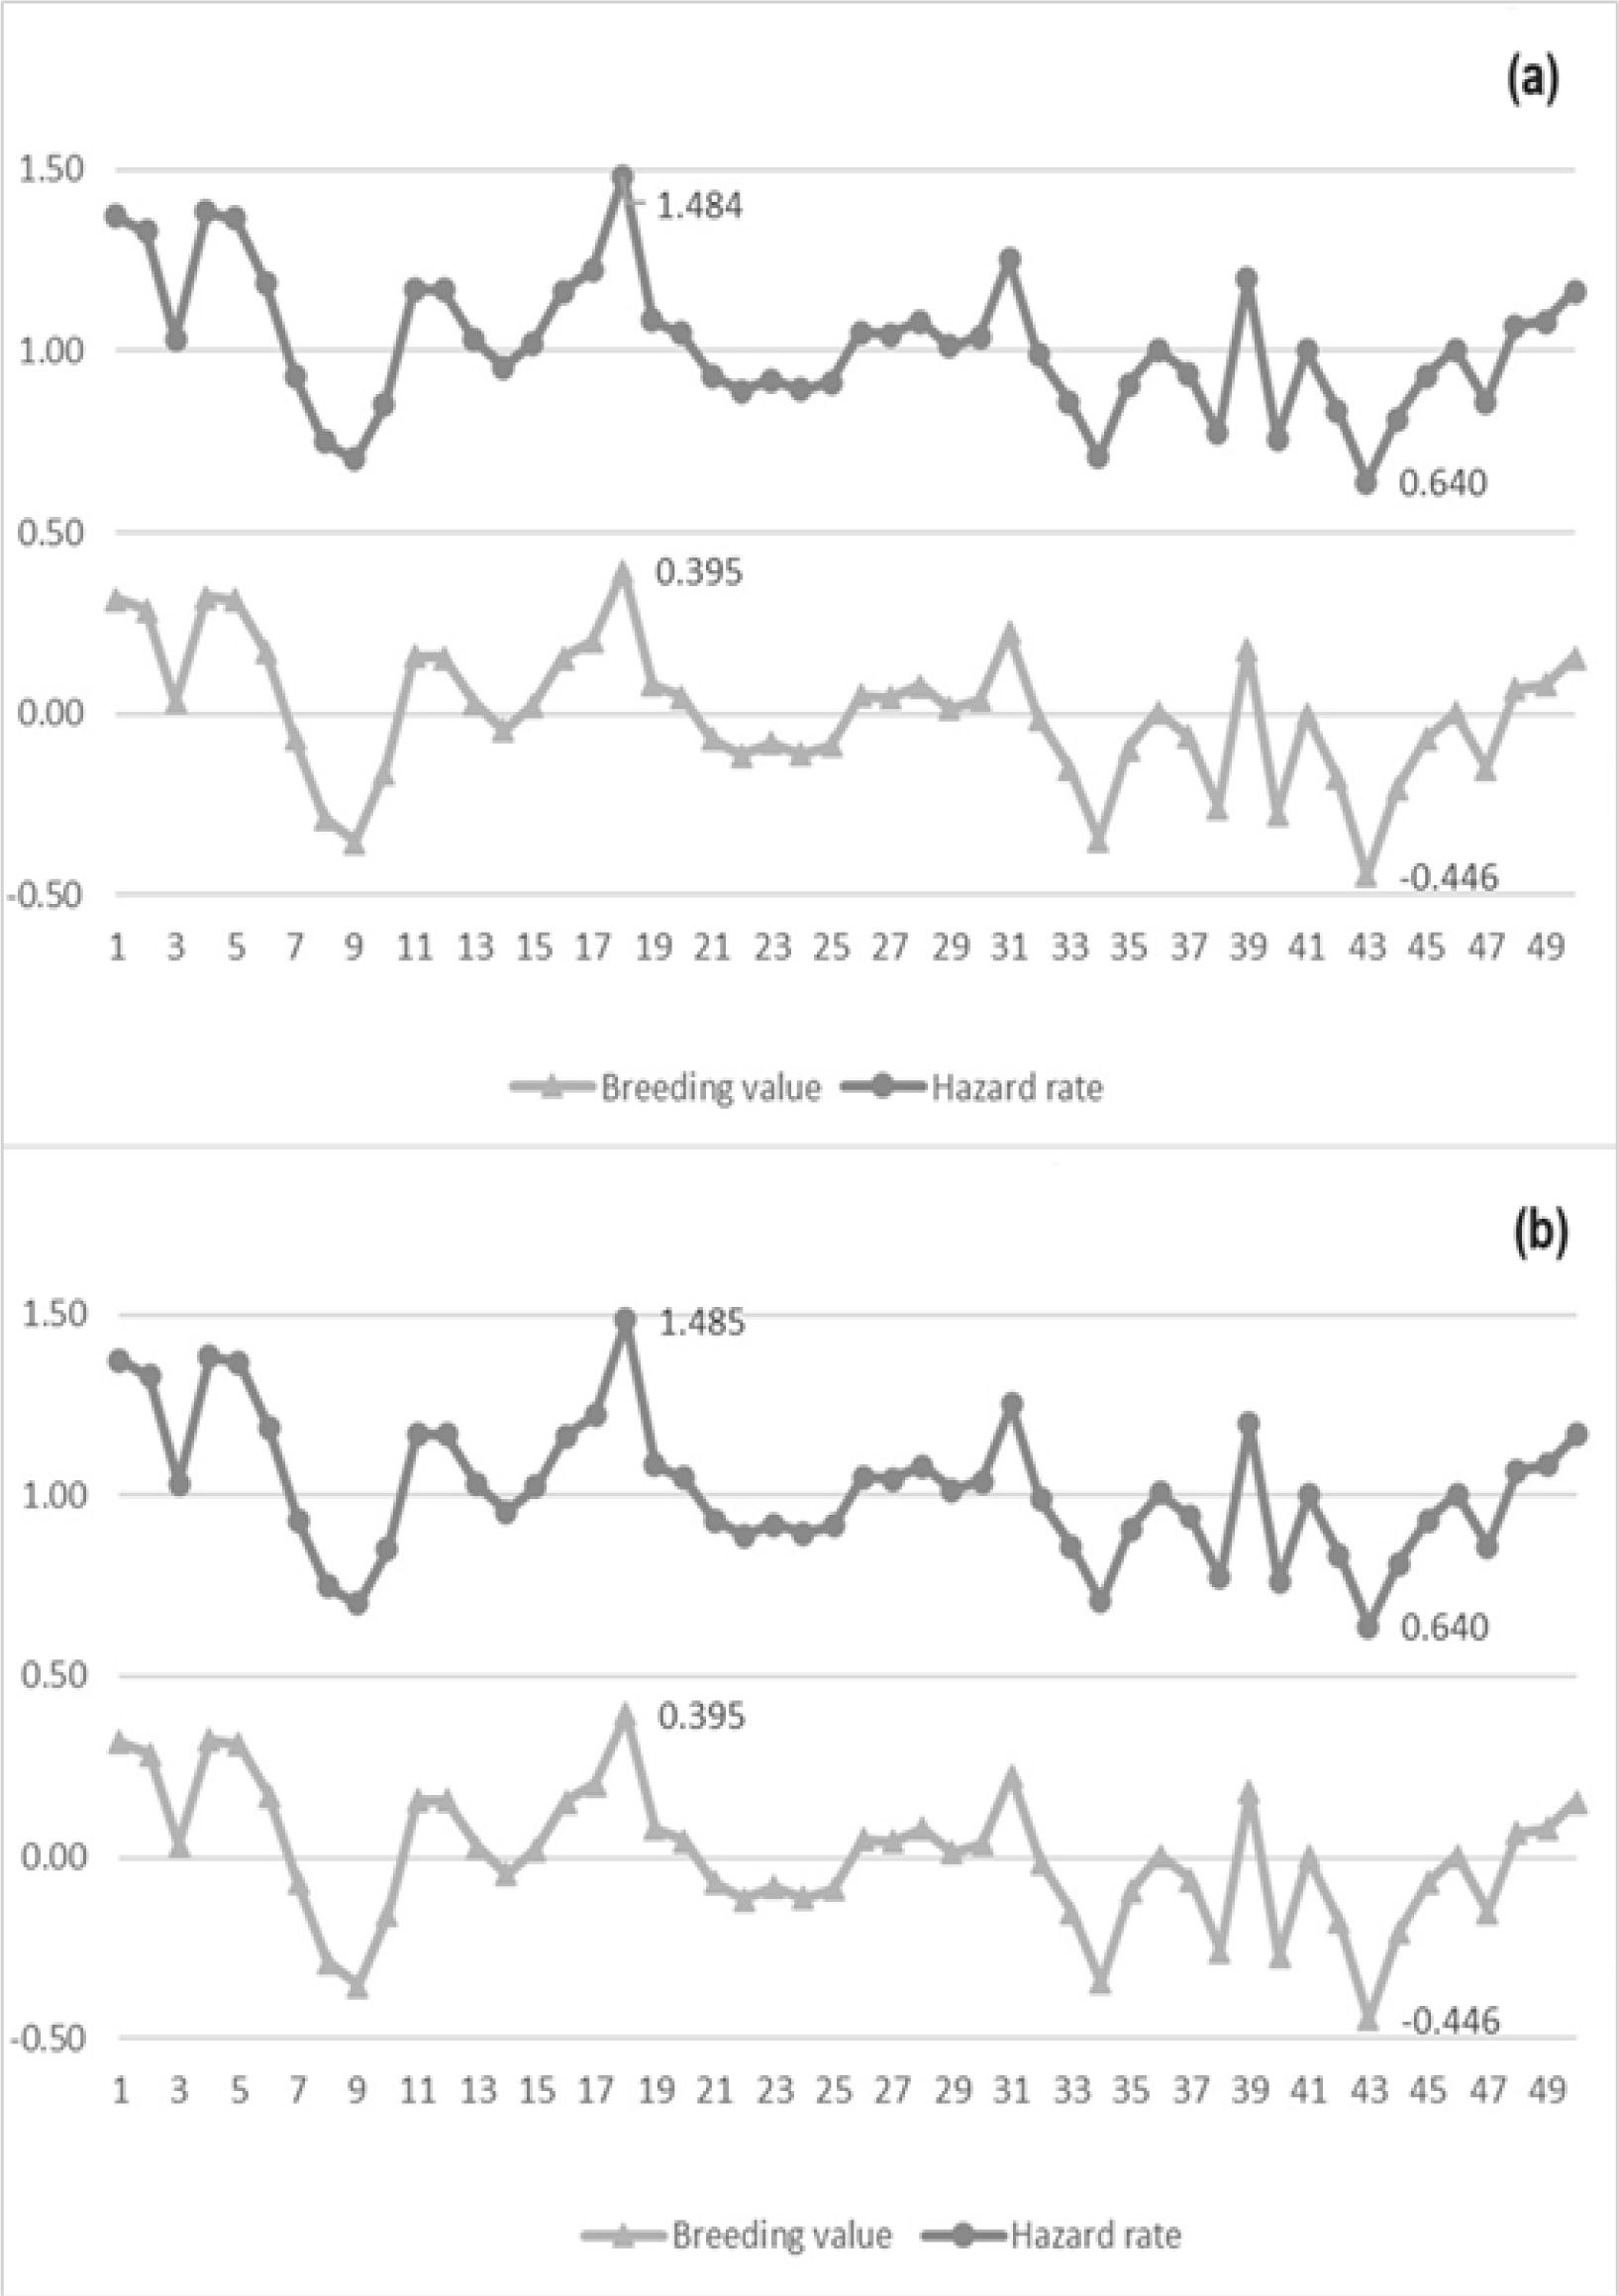
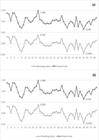
The predicted breeding values () for the bull covariate varied from 0.395 (Bull 18) to -0.446 (Bull 43) under both the Cox (Figure 5a) and Weibull (Figure 5b) models. The corresponding hazard rates () for the daughters of Bulls 18 and 43 reaching five consecutive calvings, thereby indicating a greater stayability in the herd, were 1.484 and 0.640, respectively, under the Cox model; and 1.485 and 0.640, respectively, under the Weibull model. Consequently, the risk of event occurrence for the daughters of Bull 18 was approximately 2.32 times greater than that observed for the daughters of Bull 43 under both models. The frailty term related to the bulls was significant (p < 0.05), demonstrating a notable association among the time until the event for the daughters from a same bull. This result indicates that bulls had a significant influence on the stayability of their daughters in the herd.
According to Carvalho et al (42), the inclusion in the model of the frailty for each individual leads to more consistent estimates of covariate effects. Positive breeding values are associated with hazard rates greater than one (> 1.0), indicating that the higher the genetic value of a bull, the greater is the hazard rate (frailty) for its daughters, and consequently, the greater is their probability of achieving five consecutive calvings. Conversely, negative breeding values correspond to frailty values below one (< 1.0). Since frailty acts multiplicatively on the hazard function, daughters of bulls with frailty values above 1.0 are at a greater risk of experiencing the event, making them more likely to have a longer productive lifespan (24).
The regression coefficients estimated for AFC class and herd covariates (Table 3) were very similar under both the Cox and Weibull models. Furthermore, in both models, Bulls 18 and 43 stood out for having presented the highest and lowest predicted breeding values, respectively. Consequently, the hazard rates estimated for the daughters of these bulls were also very similar, making it difficult to determine which model provided the best fit estimates. Some authors have compared survival analysis with other methodologies. Caraviello et al (4) compared predicted breeding values of bulls using a Weibull frailty model with those estimated by a linear animal model for survival up to the second, third, fourth, and fifth lactations. Although neither model was consistently superior, the Weibull model demonstrated a slightly better performance. Similarly, Jamrozik et al (3), using simulated data, reported that the Weibull model was more effective than random regression model and linear model in predicting the herd functional survival independent of production level.
The heritability estimates for longevity obtained under the Cox and Weibull models (Table 5) were relatively low. These estimates indicate that 9 % and 15 % of the phenotypic variation in longevity among cows could be attributed to additive genetic variation, in those respective models.
Estimates of genetic parameters for longevity of Brown Swiss cows using the Cox and Weibull models.
Ducrocq & Sölkner (43) obtained heritability estimates for longevity ranging from 0.15 to 0.20, values similar to that obtained under the Weibull model in the present study. Besides, Potočnik et al (44) and Samoré et al (45) found heritability estimates of 0.14 and 0.04, respectively. Forabosco et al (46), analyzing only uncensored data for longevity in Chianina beef cattle, estimated heritability at 0.09, which is similar to our estimate using the Cox model. Guedes et al (28), evaluating AFC in Brown Swiss cows using a gamma shared frailty model, estimated the logarithmic heritability at 0.27.
Djedović et al (17) estimated genetic parameters for three longevity traits in Serbian Holstein cattle – length of productive life (LPL), lifetime milk yield (LMY), and the number of achieved lactations (NL) – using a Weibull proportional hazards model and the traditional linear methods. Length of productive lifespan was defined as the number of days from the first calving until culling or censoring. The heritability estimates obtained with the Weibull model were 0.10, 0.09, and 0.08 for LPL, LMY, and NL, respectively. These estimates were slightly higher than the corresponding estimates obtained with linear models (0.06, 0.06, and 0.07).The relevance of heritability lies inits predictive capacity, which provides reliability when using phenotypic value of an animal as an indicator of its genetic value. In other words, heritability quantifies the degree of correspondence between phenotypic and genetic values for predicting the response to selection (30, 47).
Sasaki et al (48) obtained estimates for the shape (ρ) and scale (λ) parameters of 1.76 and 0.00097, respectively, which were lower than those from this study (2.5 and 0.005, respectively). The ρ value used in our simulation study was close to the estimate by Djedović et al (17) for the longevity evaluated as length of productive life (LPL), ρ = 2.35. Furthermore, our values of ρ and the intercept were similar to those found by Chirinos et al (31) in herds reared in Andalusia, the Basque Country, and Catalonia, which were 2.06/−13.43, 2.28/−15.24, and 1.69/−11.27, respectively. Considering that a ρ value greater than 1.0 indicates an increasing hazard rate over time, the choice of 2.5 in our simulation mirrors the real-world of dairy scenarios. This was based on the observation that the culling rate tends to rise as cows age and become more susceptible to the degenerative effects of aging (49).
4. Conclusion
Survival analysis methodology is highly suitable for studying longevity traits because it allows the inclusion of records from cows that are still present in the herd and accommodates non-normal data distributions, thereby improving the consistency and reliability of longevity studies over time. Age at first calving and herd covariates significantly influenced cow longevity. Notably, cows from AFC Class 1 (first calving between 24 and 28 months of age) exhibited lower survival rates for the event, which was associated with a greater stayability in the herd compared with cows from the other AFC classes. The daughters of bulls with superior breeding values showed higher hazard rates for reaching five consecutive calvings up to 84 months of age. Consequently, these bulls represent promising candidates for future genetic breeding programs, potentially contributing to improvements in the longevity of their daughters. For analyses involving real dairy cattle datasets, it is important to incorporate additional management-related factors into survival models, even if initially their effects have been proven to significantly impact cow longevity using linear regression models.
-
Generative AI use statement
The authors did not use any Generative Artificial Intelligence tools or technologies in the preparation or editing of this manuscript.
Data availability statement
Data will be provided upon request to the corresponding author.
References
-
1 ABCGPS - Associação Brasileira de Criadores de Gado Pardo-Suíço. Pardo-Suíço: Características [Internet]. 2025 [citado em 30 Jul 2025]. Available from: https://pardo-suico.com.br/?page_id=5732
» https://pardo-suico.com.br/?page_id=5732 -
2 Hu H, Mu T, Ma Y, Wang X, Ma Y. Analysis of longevity traits in Holstein cattle: a review. Front Genet. 2021;12:1-15. Available from: https://doi.org/10.3389/fgene.2021.695543
» https://doi.org/10.3389/fgene.2021.695543 -
3 Jamrozik J, Fatehi J, Schaeffer LR. Comparison of models for genetic evaluation of survival traits in dairy cattle: a simulation study. J Anim Breed Genet. 2008;125:75-83. Available from: https://doi.org/10.1111/j.1439-0388.2007.00712.x
» https://doi.org/10.1111/j.1439-0388.2007.00712.x -
4 Caraviello DZ, Weigel KA, Gianola D. Prediction of Longevity Breeding Values for US Holstein Sires Using Survival Analysis Methodology. J Dairy Sci. 2004;87(10):3518–3525. Available from: https://doi.org/10.3168/jds.S0022-0302(04)73488-8
» https://doi.org/10.3168/jds.S0022-0302(04)73488-8 -
5 Han R, Kok A, Mourits M, Hogeveen H. Effects of extending dairy cow longevity by adjusted reproduction management decisions on partial net return and greenhouse gas emissions: A dynamic stochastic herd simulation study. J Dairy Sci. 2024;107(9):6902-6912. Available from: https://doi.org/10.3168/jds.2023-24089
» https://doi.org/10.3168/jds.2023-24089 -
6 Han R, Mourits M, Hogeveen H. The association of dairy cattle longevity with farm level technical inefficiency. Front Vet Sci. 2022;9:1001015. Available from: https://doi.org/10.3389/fvets.2022.1001015
» https://doi.org/10.3389/fvets.2022.1001015 -
7 Grandl F, Furger M, Kreuzer M, Zehetmeier M. Impact of longevity on greenhouse gas emissions and profitability of individual dairy cows analysed with different system boundaries. Animal. 2019;13(1):198-208. Available from: https://doi.org/10.1017/S175173111800112X
» https://doi.org/10.1017/S175173111800112X -
8 Vredenberg I, Han R, Mourits M, Hogeveen H, Steeneveld W. An Empirical Analysis on the Longevity of Dairy Cows in Relation to Economic Herd Performance. Front Vet Sci. 2021;8:646672. Available from: https://doi.org/10.3389/fvets.2021.646672
» https://doi.org/10.3389/fvets.2021.646672 -
9 Shrestha B, Paudyal S, Kaniyamattam K, Grohn YT. Graduate Student Literature Review: Organic dairy cattle longevity and economic implications—Contemporary perspectives. J Dairy Sci. 2025;108(4):3734-3745. Available from: https://doi.org/10.3168/jds.2024-25767
» https://doi.org/10.3168/jds.2024-25767 -
10 Vukasinovic N, Moll J, Künzi N. Analysis of productive life in Swiss Brown cattle. J Dairy Sci. 1997;80(10):2572-2579. Available from: https://doi.org/10.3168/jds.S0022-0302(97)76213-1
» https://doi.org/10.3168/jds.S0022-0302(97)76213-1 -
11 Dallago GM, Wade KM, Cue RI, McClure JT, Lacroix R, Pellerin D, Vasseur E. Keeping Dairy Cows for Longer: A Critical Literature Review on Dairy Cow Longevity in High Milk-Producing Countries. Animals. 2021;11(3):808. Available from: https://doi.org/10.3390/ani11030808
» https://doi.org/10.3390/ani11030808 -
12 Grandl F, Amelchanka SL, Furger M, Clauss M, Zeitz JO, Kreuzer M, et al. Biological implications of longevity in dairy cows: 2. Changes in methane emissions and efficiency with age. J Dairy Sci. 2016;99(5):3472-3485. Available from: http://dx.doi.org/10.3168/jds.2015-10262
» http://dx.doi.org/10.3168/jds.2015-10262 -
13 Cardoso FF, Rosa GJ, Tempelman RJ, Torres Junior RA. Modelos hierárquicos bayesianos para estimação robusta e análise de dados censurados em melhoramento animal. R Bras Zootec. 2009;38(spe):72–80. Available from: https://doi.org/10.1590/S1516-35982009001300009
» https://doi.org/10.1590/S1516-35982009001300009 -
14 Ducrocq V, Quaas RL, Pollak EJ, Casella G. Length of Productive Life of Dairy Cows. 1. Justification of a Weibull Model. J Dairy Sci. 1988;71(11):3061-3070. Available from: https://doi.org/10.3168/jds.S0022-0302(88)79906-3
» https://doi.org/10.3168/jds.S0022-0302(88)79906-3 -
15 Schneider MP, Strandberg E, Ducrocq V, Roth A. Survival analysis applied to genetic evaluation for female fertility in dairy cattle. J Dairy Sci. 2005; 88(6):2253-2259. Available from: https://doi.org/10.3168/jds.S0022-0302(05)72901-5
» https://doi.org/10.3168/jds.S0022-0302(05)72901-5 -
16 Grzesiak W, Adamczyk K, Zaborski D, Wójcik J. Estimation of Dairy Cow Survival in the First Three Lactations for Different Culling Reasons Using the Kaplan–Meier Method. Animals. 2022;12(15):1942. Available from: https://doi.org/10.3390/ani12151942
» https://doi.org/10.3390/ani12151942 -
17 Djedović R, Vukasinovic N, Stanojević D, Bogdanović V, Ismael H, Janković D, et al. Genetic Parameters for Functional Longevity, Type Traits, and Production in the Serbian Holstein. Animals. 2023;13(3):534. Available from: https://doi.org/10.3390/ani13030534
» https://doi.org/10.3390/ani13030534 -
18 Roxström A, Ducrocq V, Strandberg E. Survival analysis of longevity in dairy cattle on a lactation basis. Genet Sel Evol. 2003;35:305-18. Available from: https://doi.org/10.1186/1297-9686-35-3-305
» https://doi.org/10.1186/1297-9686-35-3-305 -
19 Ducrocq V. An improved model for the French genetic evaluation of dairy bulls on length of productive life of their daughters. Anim Sci. 2005;80(3):249–256. Available from: https://doi.org/10.1079/ASC41720249
» https://doi.org/10.1079/ASC41720249 -
20 Kern EL, Cobuci JA, Costa CN, Ducrocq V. Survival analysis of productive life in Brazilian Holstein using a piecewise Weibull proportional hazard model. Livest Sci. 2016;185:89-96. Available from: https://doi.org/10.1016/j.livsci.2016.01.019
» https://doi.org/10.1016/j.livsci.2016.01.019 -
21 Kaplan EL, Meier P. Nonparametric estimation from incomplete observation. J Am Stat Assoc. 1958;53(282):457-481. Available from: https://doi.org/10.2307/2281868
» https://doi.org/10.2307/2281868 - 22 Allison PD. 2010. Survival Analysis Using SAS: A Practical Guide. 2nd ed. Cary: SAS Institute; 2010. 324 p. Inglês.
-
23 Wienke A. Frailty models in survival analysis. 1st ed. New York: Chapman & Hall/CR; 2010. 324 p. Available from: https://doi.org/10.1201/9781420073911
» https://doi.org/10.1201/9781420073911 -
24 Cunha EE, Melo TP. Análise de sobrevivência não-paramétrica da idade ao primeiro parto em fêmeas Nelore: um estudo de simulação. R Bras Biom. 2012;30(3):305-325. Available from: https://biometria.ufla.br/antigos/fasciculos/v30/v30_n3/A1_Elisangela.pdf
» https://biometria.ufla.br/antigos/fasciculos/v30/v30_n3/A1_Elisangela.pdf -
25 Ducrocq V, Casella G. A Bayesian analysis of mixed survival models. Genet Sel Evol. 1996;28(6):505-529. Available from: https://doi.org/10.1186/1297-9686-28-6-505
» https://doi.org/10.1186/1297-9686-28-6-505 - 26 Colosimo EA, Giolo SR. Análise de sobrevivência aplicada. 1st ed. São Paulo: Blücher; 2006. 392p. Português.
- 27 Ducrocq V; Sölkner J, Mészáros G. The Survival Kit v6.1: User's manual. [S.I.: s.n.]; 2012. 83p. Inglês.
-
28 Guedes DG, Cunha EE, Lima GF. Genetic evaluation of age at first calving from Brown Swiss cows through survival analysis. Arch de Zootec. 2017;66(254):247-255. Available from: https://www.redalyc.org/pdf/495/49553570013.pdf
» https://www.redalyc.org/pdf/495/49553570013.pdf -
29 Sas Institute Inc. SAS/STAT® 9.2 User’s guide [CD-ROM]. 2nd ed. Cary: SAS Institute Inc; 2009. 7886p. Available from: https://support.sas.com/documentation//cdl/en/statug/63033/HTML/default/viewer.htm#titlepage.htm
» https://support.sas.com/documentation//cdl/en/statug/63033/HTML/default/viewer.htm#titlepage.htm -
30 Caetano SL, Rosa GJ, Savegnago RP, Ramos SB, Bezerra LA, Lôbo RB, et al. Characterization of the variable cow’s age at last calving as a measurement of longevity by using the Kaplan–Meier estimator and the Cox model. Animal. 2013;7(4):540-546. Available from: https://doi.org/10.1017/S1751731112001826
» https://doi.org/10.1017/S1751731112001826 -
31 Chirinos Z, Carabaño MJ, Hernández D. Genetic evaluation of length of productive life in the Spanish Holstein-Friesian population. Model validation and genetic parameters estimation. Livest Sci. 2007;106(2-3):120-131. Available from: https://doi.org/10.1016/j.livsci.2006.07.006
» https://doi.org/10.1016/j.livsci.2006.07.006 -
32 Yazdi MH, Visscher PM, Ducrocq V, Thompson R. Heritability, reliability of genetic evaluations and response to selection in proportional hazard models. J Dairy Sci. 2002;85(6):1563-1577. Available from: https://doi.org/10.3168/jds.S0022-0302(02)74226-4
» https://doi.org/10.3168/jds.S0022-0302(02)74226-4 -
33 M’hamdi N, Aloulou R, Bouallegue M, Brar SK, Hamouda MB. Study on functional longevity of Tunisian Holstein dairy cattle using a Weibull proportional hazard model. Livest Sci. 2010;132(1-3):173-176. Available from: https://doi.org/10.1016/j.livsci.2010.05.011
» https://doi.org/10.1016/j.livsci.2010.05.011 -
34 Amirpour Najafabadi H, Ansari Mahyari S, Edriss MA, Strapakova E. Genetic analysis of productive life length in Holstein dairy cows using Weibull proportional risk model. Arch Anim Breed. 2016;59(3):387-393. Available from: https://doi.org/10.5194/aab-59-387-2016
» https://doi.org/10.5194/aab-59-387-2016 -
35 Vukasinovic N, Moll J, Casanova L. Implementation of a routine genetic evaluation for longevity based on survival analysis techniques in dairy cattle populations in Switzerland. J Dairy Sci. 2001;84(9):2073-2080. Available from: https://doi.org/10.3168/jds.S0022-0302(01)74652-8
» https://doi.org/10.3168/jds.S0022-0302(01)74652-8 -
36 De Vries A, Marcondes MI. Review: Overview of factors affecting productive lifespan of dairy cows. Animal. 2020;14(S1):s155–s164. Available from: https://doi.org/10.1017/S1751731119003264
» https://doi.org/10.1017/S1751731119003264 -
37 Saleh AA, Hassan TG, EL-Hedainy DK, El-Barbary AS, Sharaby MA, Rashad AM. Comprehensive assessment of lifetime performance traits and their genetic background in Holstein cows under semi-arid conditions. Trop Anim Health Prod. 2026;58(36):1-20. Available from: https://doi.org/10.1007/s11250-025-04806-9
» https://doi.org/10.1007/s11250-025-04806-9 -
38 Santos GC, Lira TS, Pereira LS, Lopes FB, Ferreira JL. Efeitos não genéticos sobre características produtivas em rebanhos Nelore criados na região Norte do Brasil. Acta Vet Bras. 2011;5(4):385-392. Available from: https://periodicos.ufersa.edu.br/acta/article/view/2356/5028
» https://periodicos.ufersa.edu.br/acta/article/view/2356/5028 -
39 Jenko J, V. Ducrocq, M. Kovač. Comparison of piecewise Weibull baseline survival models for estimation of true and functional longevity in Brown cattle raised in small herds. Animal. 2013;7(10):1583–91. Available from: https://doi.org/10.1017/S1751731113001055
» https://doi.org/10.1017/S1751731113001055 -
40 Ziadi C, Sánchez JP, Sánchez M, Molina A. Risk factors and genetic parameters of longevity in Spanish dairy goat breeds using a Weibull proportional hazards model. Ital J Anim Sci. 2024;23(1):33–41. Available from: https://doi.org/10.1080/1828051X.2023.2288624
» https://doi.org/10.1080/1828051X.2023.2288624 -
41 Ziadi C, Sánchez JP, Sánchez M, Morales R, Molina A. Survival analysis of productive life in Florida dairy goats using a Cox proportional hazards model. J Anim Breed Genet. 2023;140:431–439. Available from: https://doi.org/10.1111/jbg.12769
» https://doi.org/10.1111/jbg.12769 - 42 Carvalho MS, Andreozzi VL, Codeço CT, Campos DP, Barbosa MT, Shimakura SE. Análise de sobrevivência: teoria e aplicações em saúde. 2nd ed. Rio de Janeiro: Editora Fiocruz. 2011. 432 p. Português.
- 43 Ducrocq V, Sölkner J. “The Survival Kit - v3.0”, a package for large analysis of survival data. In: Proceedings of the 6th World Congress on Genetics Applied to Livestock Production; 1998 Jan 11-16; Armidale, Australia. New South Wales: University of New England, 1998, 447-448.
-
44 Potočnik K, Gantner V, Krsnik J, Štepec M, Logar B, Gorjanc G. Analysis of longevity in Slovenian Holstein cattle. Acta Agric Slov. 2011;98(2):93-100. Available from: https://doi.org/10.2478/v10014-011-0025-5
» https://doi.org/10.2478/v10014-011-0025-5 -
45 Samoré AB, Rizzi R, Rossoni A, Bagnato A. Genetic parameters for functional longevity, type traits, somatic cell scores, milk flow and production in the Italian Brown Swiss. Ital J Anim Sci. 2010;9(2):145-152. Available from: https://www.tandfonline.com/doi/epdf/10.4081/ijas.2010.e28
» https://www.tandfonline.com/doi/epdf/10.4081/ijas.2010.e28 -
46 Forabosco F, Bozzi R, Filippini F, Boettcher P, Van Arendonk JA, Bijma P. Linear model vs. survival analysis for genetic evaluation of sires for longevity in Chianina beef cattle. Livest Sci. 2006;101(1-3):191-198. Available from: https://doi.org/10.1016/j.livprodsci.2005.11.010
» https://doi.org/10.1016/j.livprodsci.2005.11.010 - 47 Van Vleck LD, Pollak EJ, Oltenacu EA. Genetics for the animal sciences. New York: W.H. Freeman. 1987. 391p. Inglês.
-
48 Sasaki O, Aihara M, Hagiya K, Nishiura A, Ishii K, Satoh M. Genetic evaluation of the longevity of the Holstein population in Japan using a Weibull proportional hazard model. Animal Sci J. 2012;83(2):95-102. Available from: https://doi.org/10.1111/j.1740-0929.2011.00943.x
» https://doi.org/10.1111/j.1740-0929.2011.00943.x -
49 Boettcher PJ, Jairath LK, Dekkers JC. Comparison of Methods for Genetic Evaluation of Sires for Survival of Their Daughters in the First Three Lactations. J Dairy Sci. 1999;82(5):1034–44. Available from: https://doi.org/10.3168/jds.S0022-0302(99)75324-5
» https://doi.org/10.3168/jds.S0022-0302(99)75324-5
Edited by
-
Editor:
Rondineli P. Barbero