 Agreement analysis and predictive modeling using thermographic body surface temperatures to estimate rectal temperature in young and adult dairy goats
Abstract
The objective of this study was to evaluate the use of thermographic imaging to estimate and predict rectal temperature in dairy goats. A total of 98 goats, comprising 45 young and 53 adults, were used. Rectal temperature was measured using a digital thermometer, and a thermal image was captured immediately afterward. The anatomical regions evaluated in the thermographic images were the eye, subocular region, hindquarters, shoulder, and head. Data analysis included Pearson correlation and Bland-Altman agreement analyses. For prediction, simple linear regression and decision-tree models were applied. Low correlations (<0.40) were observed between rectal temperature and the surface temperatures of the eye, subocular region, hindquarters, shoulder, and head regions in both young and adult goats. In the agreement analysis, the subocular region showed the lowest bias, with values of 5.57°C and 4.89°C for young and adult goats, respectively. For prediction, the decision-tree models outperformed the simple linear regression models, achieving R2 values of 0.1441 and a mean absolute error of 0.2415 for young goats, and an R2 of 0.38 and a mean absolute error of 0.2513 for adult goats. It was concluded that thermal imaging can be used to estimate and predict rectal temperature following correction for systematic bias.
Keywords:
dairy goats; infrared thermography; precision livestock farming; animal welfare; body temperature.
Resumo
O objetivo deste estudo foi avaliar o uso da termografia para estimar ou predizer a temperatura corporal em caprinos leiteiros. Foram utilizados 98 animais, sendo 45 jovens e 53 adultos. A temperatura retal de cada animal foi medida com um termômetro digital. Imediatamente após a aferição, foi capturada uma imagem termográfica. As regiões corporais avaliadas nas imagens foram: olho (EY), subocular (SOC), garupa (HQ), espádua (SE) e cabeça (HD). A análise dos dados incluiu correlação de Pearson e gráficos de Bland-Altman. Para a predição, aplicaramse modelos de regressão linear e árvore de decisão. Observou-se baixa correlação (<0,40) entre as temperaturas superficiais das regiões EY, SOC, HQ, SE e HD e a temperatura retal, tanto em caprinos jovens quanto em adultos. Na análise de concordância, a região SOC apresentou o menor viés, com valores de 5,57 °C e 4,89 °C para jovens e adultos, respectivamente. Para a predição, os modelos de árvore de decisão superaram a regressão linear simples, com valores de R2 de 0,1441 e
MAE de 0,2415 para caprinos jovens, e R2 de 0,38 e MAE de 0,2513 para caprinos adultos leiteiros. Conclui-se que a termografia pode ser utilizada para estimar e predizer a temperatura retal, desde que seja realizada a correção do viés.
Palavras-chave:
caprinos leiteiros; termografia infravermelha; pecuária de precisão; bem-estar animal; temperatura corporal.
1. Introduction
The integration of digital technologies into livestock production systems is gaining attention in the context of animal welfare monitoring because of the association of these technologies with improved health, performance, and profitability (1). Among the key physiological indicators used for welfare assessment, body temperature is essential because of its sensitivity in detecting pathophysiological alterations associated with disease states or thermal discomfort (2). In goats, body temperature is conventionally measured using a rectal thermometer. However, this method carries a risk of cross-contamination if proper disinfection is not performed. Additionally, it requires animal restraint, increasing both labor demands and the complexity of routine management.
As a digital alternative, thermographic cameras can capture images in the long-infrared range of the electromagnetic spectrum, producing thermal images known as thermograms. These devices enable the detection of temperature variations because increased body temperature results in higher levels of emitted infrared radiation (3). A wide variety of thermographic cameras are available, differing in resolution, portability, accuracy, and price, ranging from approximately US$100 to over US$50,000. This diversity highlights the ongoing need for research evaluating their effectiveness for assessing body temperature in animals.
For meat goats, Marques et al. (4) reported strong correlations (r = 0.82-0.95) between rectal temperature and surface temperatures recorded at the eye, scapula, and croup using thermographic imaging. Similarly, a study of male Yichang goats evaluated thermographic measurements across different anatomical regions to predict rectal temperature, identifying groin surface temperature as the most reliable indicator, with a correlation coefficient of 0.48 (5). Infrared thermography has demonstrated potential for monitoring changes in body surface temperature to assess thermal status, detect heat stress, and track physiological changes during periods of water deprivation, thereby contributing to improved environmental management and enhanced animal welfare and productivity (6, 7).
As reported in the literature, infrared thermography is a promising tool for noninvasive, largescale body temperature assessment. Although previous studies have demonstrated the potential of thermographic imaging for evaluating body temperature in goats, knowledge gaps remain regarding its application in dairy goats, particularly across different physiological categories and anatomical regions of interest. Therefore, this study evaluated the use of surface thermographic imaging for estimating rectal temperature in both young and adult dairy goats.
2. Material and methods
2.1 Animals and management
The study was conducted at the Federal University of Viçosa (UFV), located in Viçosa, Minas Gerais, Brazil. All procedures were performed in accordance with the guidelines of the Ethics Committee on the Use of Farm Animals under approved protocol number 75/2025. During the experimental period, ambient temperatures ranged from a minimum of 15.9°C to a maximum of 29.5°C (INMET).
A total of 98 goats, both males and females, from the Saanen and Alpine breeds were used in the experiment. The animals were classified into two age groups: young (n = 45, under 1 year of age) and adult (n = 53, over 1 year of age), with no distinction made regarding sex or breed. The young goats were housed in suspended cage systems within a sheltered facility, while the adults were kept in group free-stall pens with access to a solarium. Feeding management followed the routine practices of the farm, and the diets consisted of corn silage and a concentrate mix (ground corn, soybean meal, wheat bran, and mineral supplement), with ad libitum access to water.
2.2 Data collection
Data collection was carried out during the autumn season on two nonconsecutive days, five days apart. The experimental period was intentionally restricted to a single season to ensure more standardized environmental conditions during data acquisition and to minimize the influence of broader climatic variation on the comparison between rectal and thermographic temperature measurements. Ambient temperature was monitored using a data logger (RC04; Elitech Technology Inc., San Jose, CA, USA) with an accuracy of ±0.5°C, programmed to record readings at 15-minute intervals. The animals were manually restrained in a handling alley and positioned laterally to ensure clear visualization of all regions of interest.
Following restraint, rectal temperature was measured using a digital thermometer (BIOPRESS; Belo Horizonte, Minas Gerais, Brazil), which was inserted into the rectum and remained in place for approximately 3 minutes until the final signal was emitted. The thermometer was sanitized with water and 70 % alcohol between measurements.
Immediately after the conventional measurement, thermal imaging was performed using a FLIR C5 thermal camera (FLIR Systems Inc., Wilsonville, OR, USA), positioned approximately 1 m from and 1 m above the animal at a 90° angle to the ground, with a measurement accuracy of ±3°C. A single image was captured per animal.
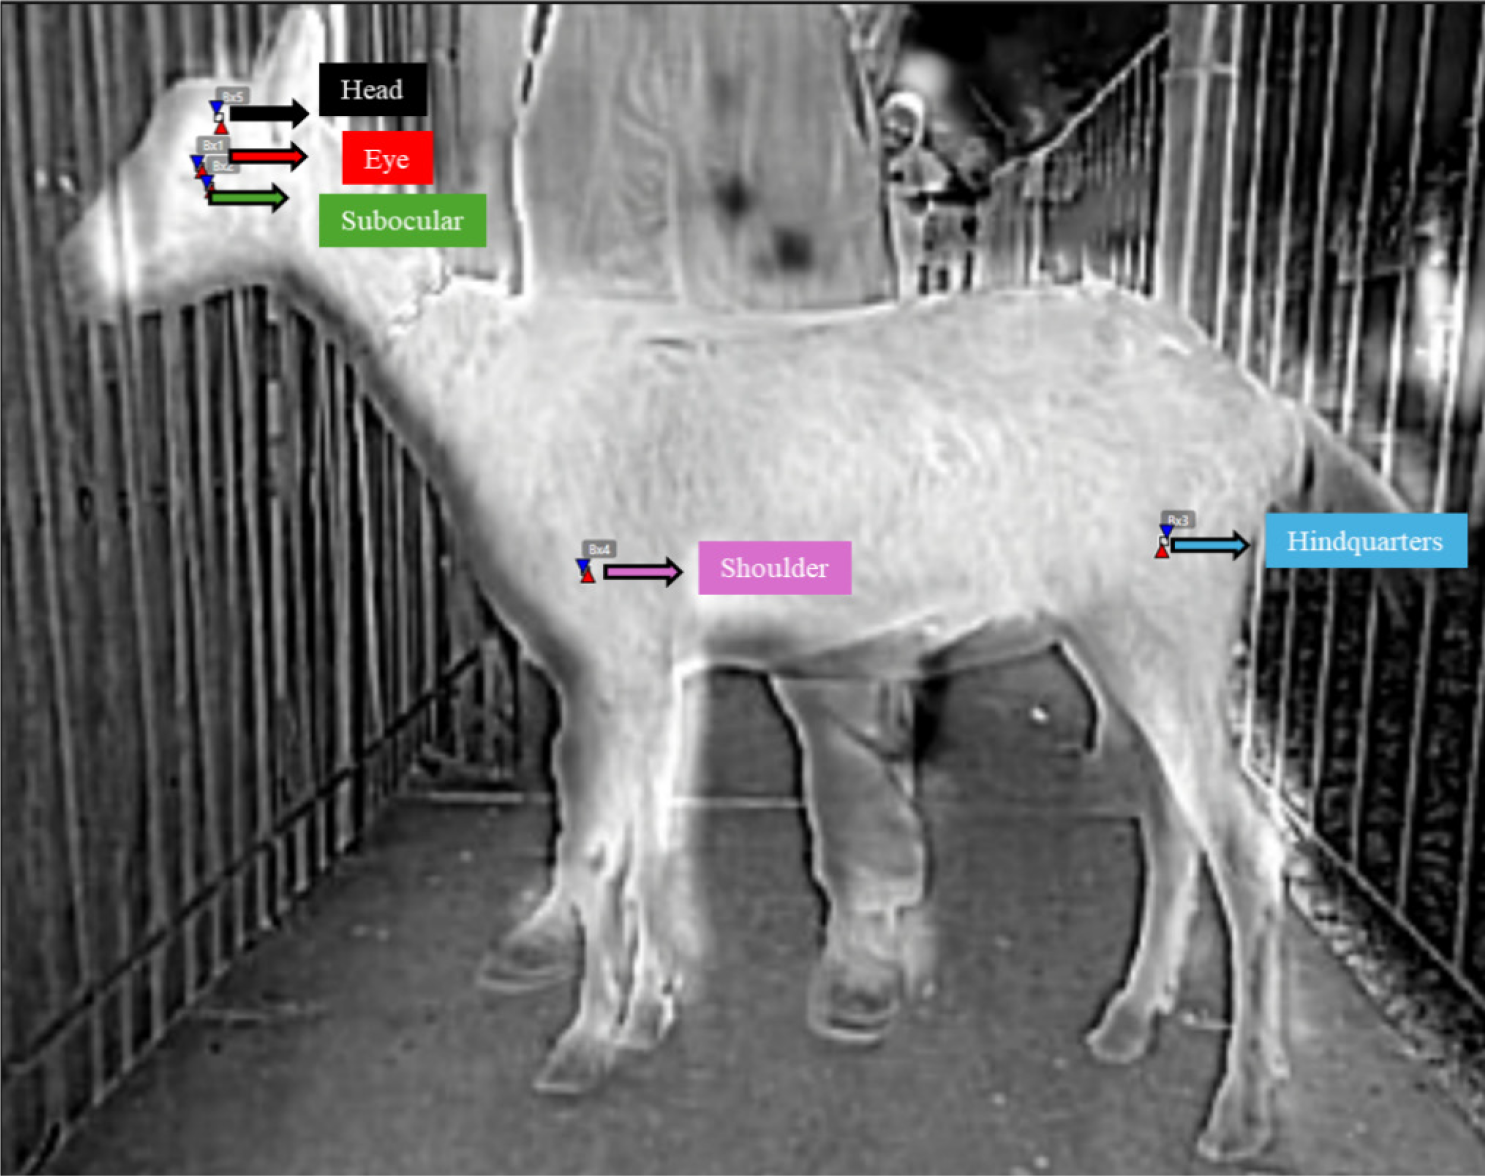
To optimize the subsequent analysis, three parameters were standardized after the images were transferred to a computer: anatomical region of interest, image filter, and temperature scale. Using FLIR Tools software, the mean surface temperature was extracted from the following regions: eye (EY), subocular region (SOC), hindquarters (HQ), shoulder (SE), and head (HD) (Figure 1). Each image was processed using the “Grey” color palette, with the temperature scale fixed between 36°C (minimum) and 42°C (maximum). The regions of interest were manually delineated while maintaining a consistent area size across all images.
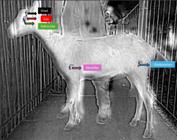
Representative thermographic image showing the anatomical regions used for surface temperature assessment: eye (EY), subocular region (SOC), hindquarters (HQ), shoulder (SE), and head (HD).
2.3 Statistical analysis
Descriptive analysis was performed by calculating the mean and standard deviation of all variables within each category. For exploratory analysis, Pearson’s correlation was applied at a 5 % significance level. To assess agreement between the traditional method and thermographic measurements within each category, Bland-Altman plots were used, with limits of agreement estimated as ±1.96 times the standard deviation of the differences.
For predictive analysis, a simple linear regression model was fitted for each category using individual image-derived features. Additionally, a decision-tree machine-learning model was implemented and optimized using leave-one-out cross-validation. Model performance was evaluated based on the coefficient of determination (R2), mean absolute error, root mean square error, and mean absolute percentage error.
3. Results
The mean surface temperatures obtained from thermal images and the rectal temperatures were similar across age categories (Table 1). There was a low positive correlation (<0.40) between rectal temperature and the surface temperatures of the EY, SOC, HQ, and SE regions in both young and adult goats. For the HD region, surface temperature showed a low negative correlation with rectal temperature in both categories (Table 1).
Descriptive statistics and Pearson correlations between rectal and surface temperatures stratified by age category.
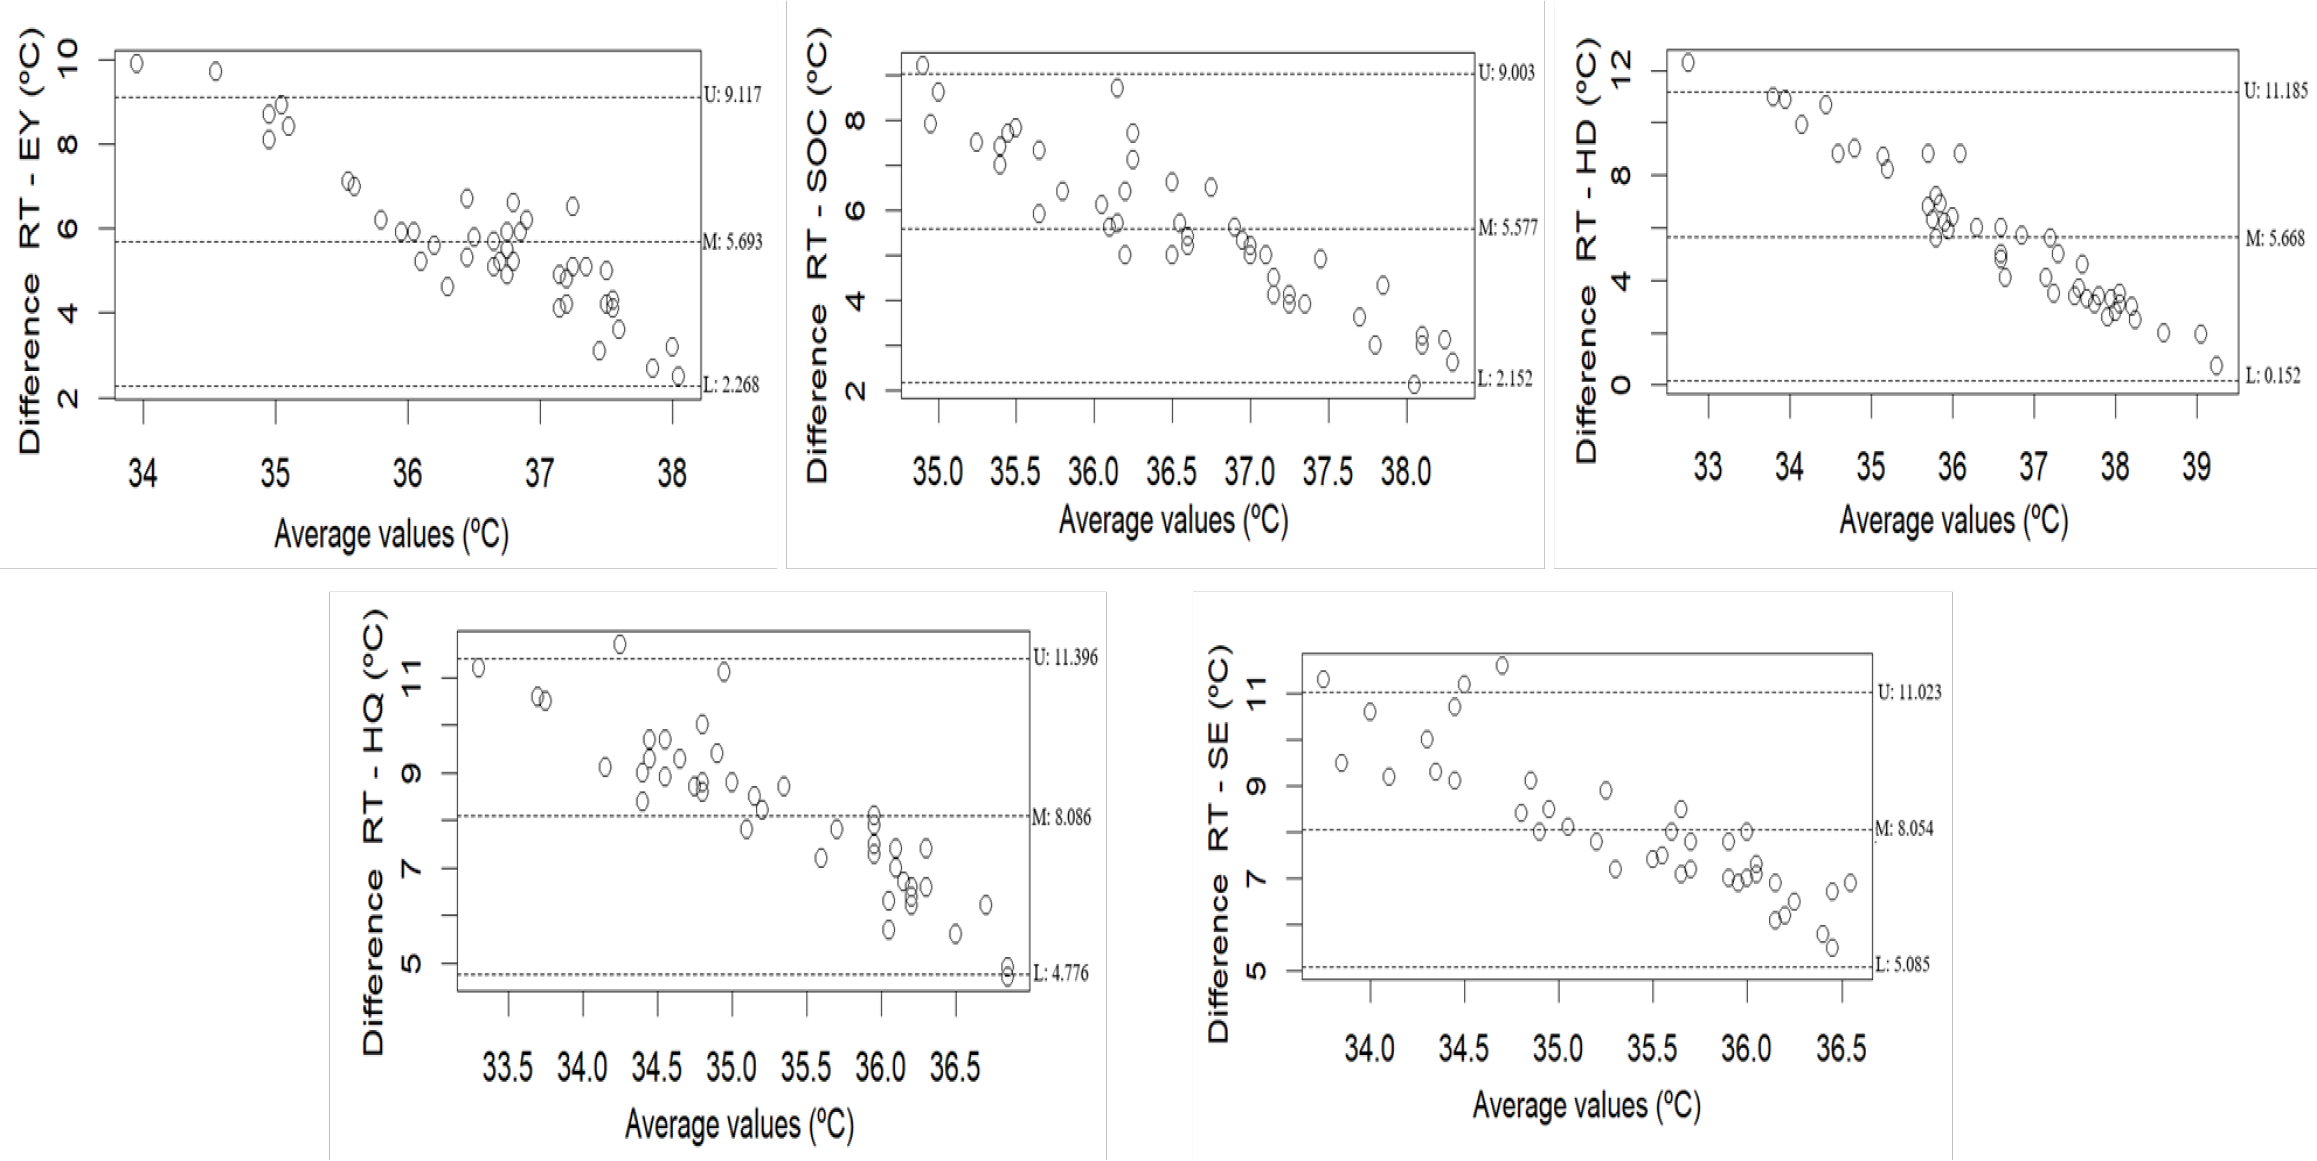
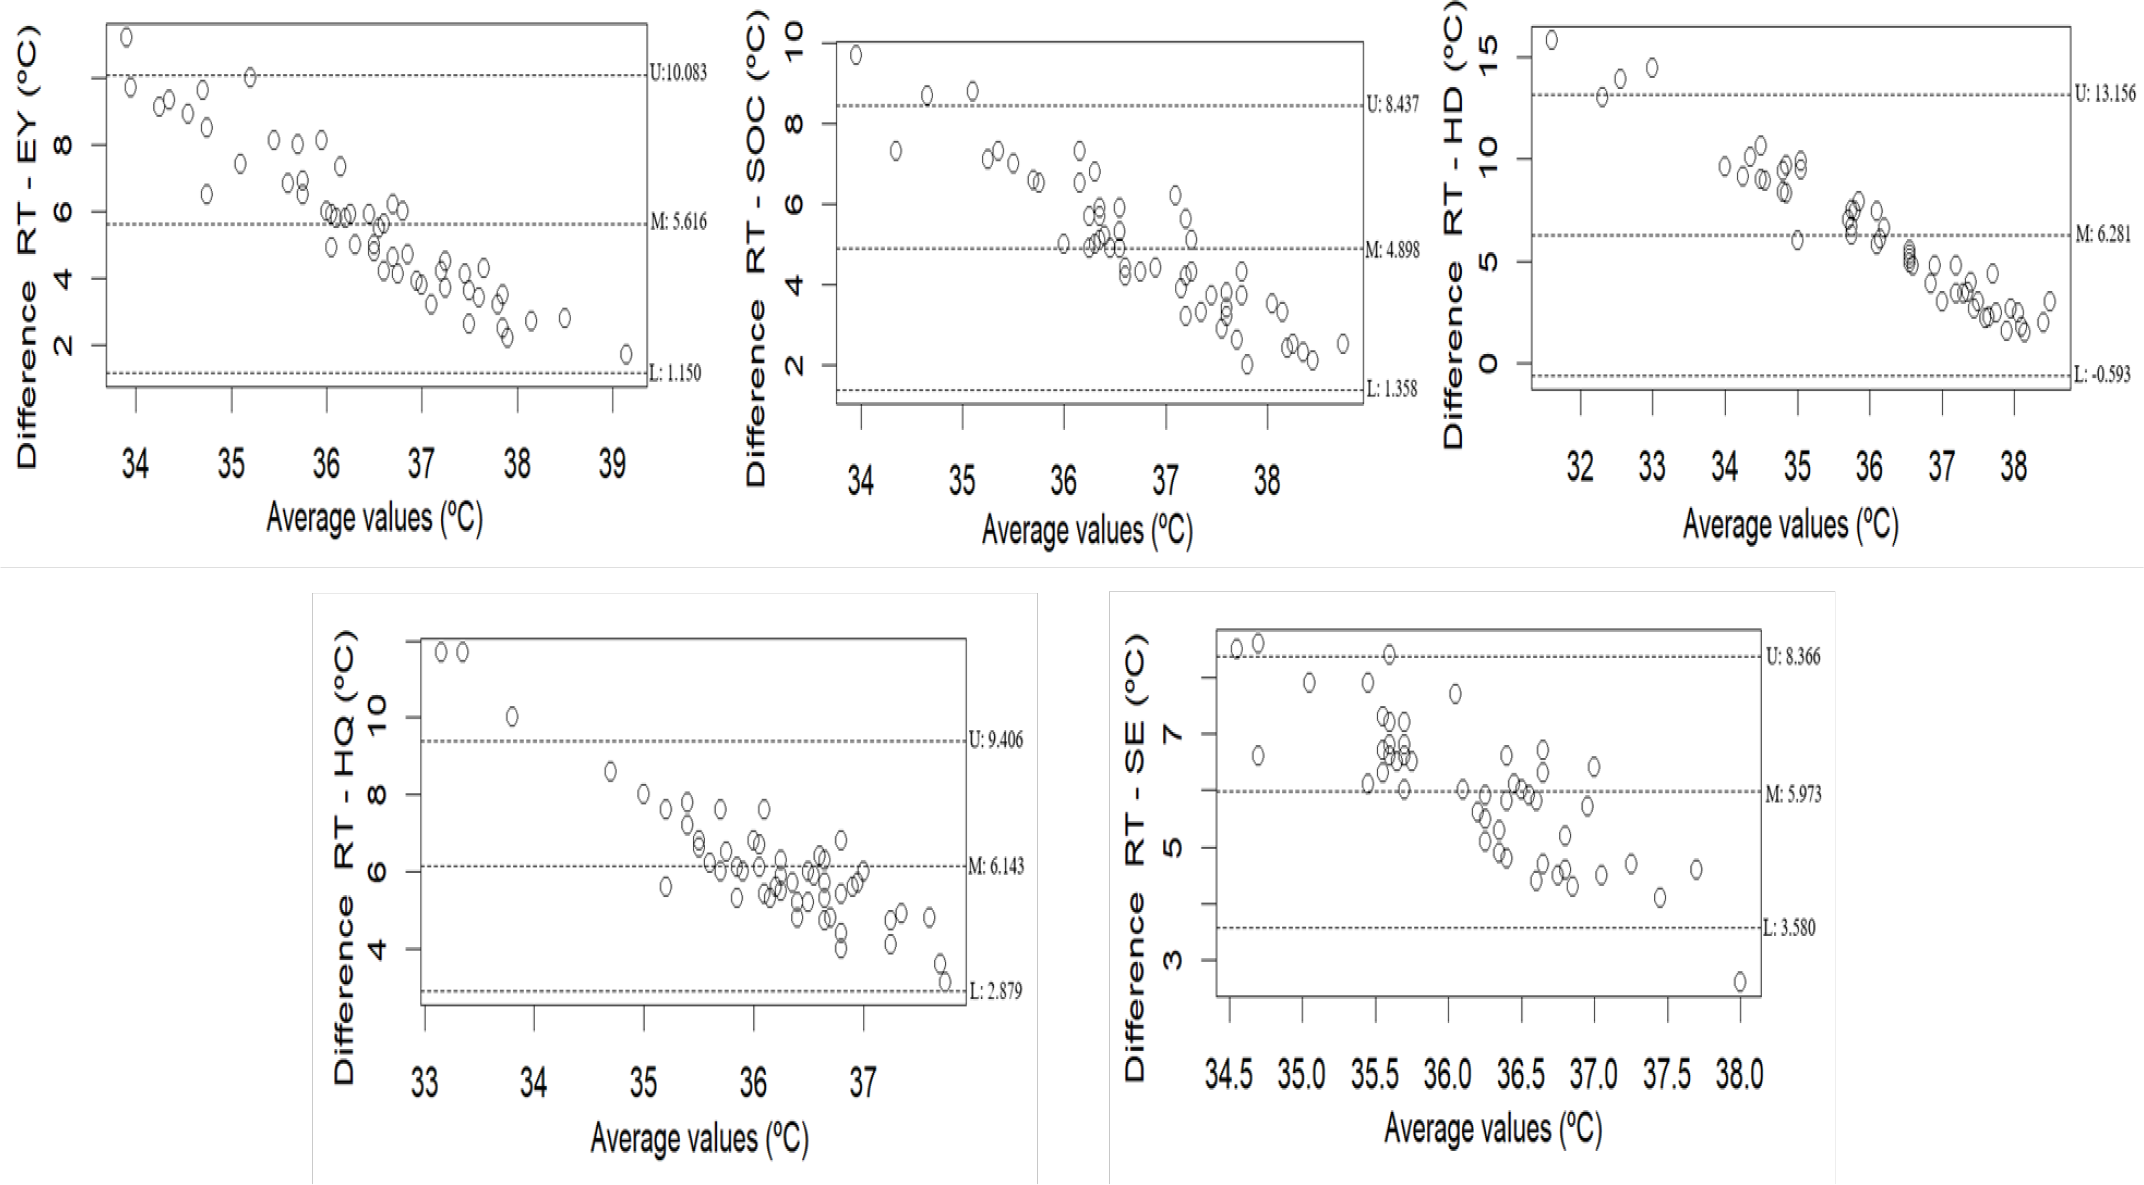
In the agreement analysis, regardless of the region evaluated, a proportional bias was observed, with the difference between methods decreasing as mean body temperature increased in both young and adult goats (Figures 2 and 3). The lowest biases were observed for the EY and SOC regions in both categories. The limits of agreement (±) for young goats were 3.425, 3.425, 5.516, 3.310, and 2.969 °C for EY, SOC, HD, HQ, and SE, respectively.
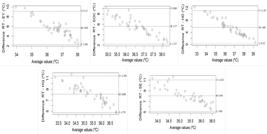
Bland-Altman plots showing the agreement between rectal temperature and surface temperatures measured at the EY, SOC, HQ, HD, and SE in young goats. M: mean bias, U: upper limit of agreement, L: lower limit of agreement, EY: eye, SOC: subocular region, HQ: hindquarters, SE: shoulder, HD: head.
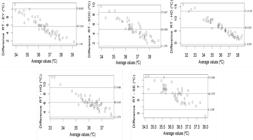
Bland-Altman plots showing the agreement between rectal temperature and surface temperatures measured at the EY, SOC, HD, HQ, and SE in adult goats. M: mean bias, U: upper limit of agreement, L: lower limit of agreement, EY: eye, SOC: subocular region, HQ: hindquarters, SE: shoulder, HD: head.
For adult goats, the corresponding limits of agreement (±) were 4.466, 3.540, 6.873, 3.264, and 2.393 °C for EY, SOC, HD, HQ, and SE, respectively (Figures 2 and 3).
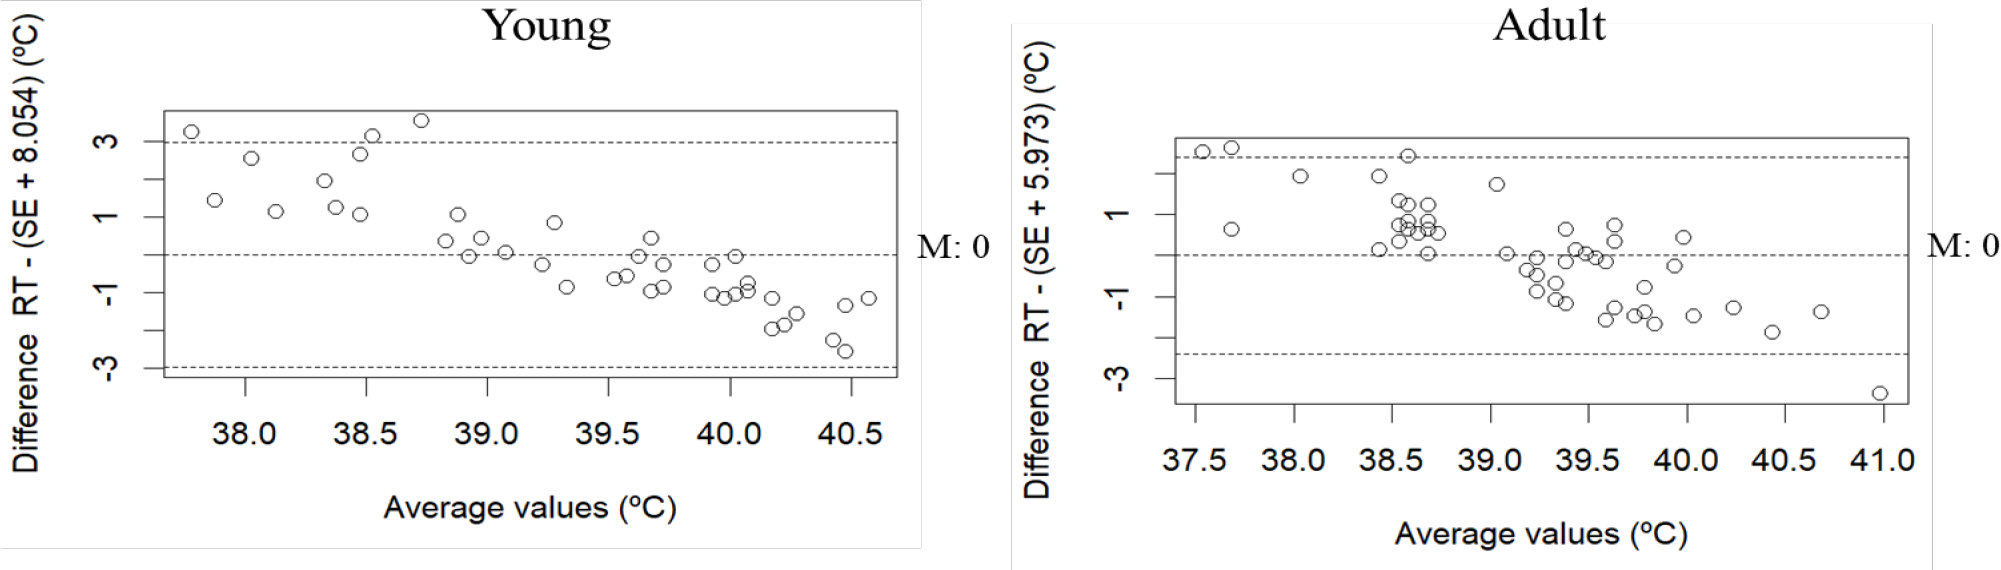
Considering that the SE region showed the narrowest limits of agreement between thermographic and rectal temperatures, the addition of the estimated systematic bias resulted in agreement between the methods, with the mean difference approaching zero (Figure 4).
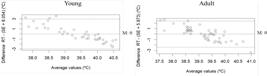
Bland-Altman plots showing the agreement between RT and SE after correction for the estimated systematic bias in young and adult goats. M: mean difference (bias), RT: rectal temperature, SE: shoulder surface temperature
In the attempt to use thermal image data to predict rectal temperature, the machinelearning model outperformed the linear models in both age categories, showing greater precision and accuracy (Table 2). For young goats, the most important predictor in the model was the EY region, accounting for 100 % of the decision tree. In adult goats, the most influential variables were the HQ (44.28 %), SOC (29.77 %), and HD (25.94 %) regions. Among the simple linear regression models, EY was the best predictor for young goats, whereas SOC was the most accurate predictor for adults (Table 2).
4. Discussion
Monitoring rectal temperature is essential for understanding changes in animal physiology under different environmental conditions, as well as for detecting fever, which may be an early sign of disease affecting health and welfare. In this study, rectal temperature values were within the range reported by Lima et al. (8), who, in a review investigating the relationship between thermal conditions and physiological responses, reported mean rectal temperatures of 38.98°C for the Alpine breed and 39.63°C for the Saanen breed in healthy animals.
Animal body surface temperature can be influenced by ambient temperature, hair coverage, and blood perfusion. The low correlations observed in both categories between rectal temperature and surface temperatures captured in the thermal images may be attributed to environmental temperature effects and, in the HQ, HD, and SE regions, to the presence of hair. Additionally, the thermal camera used in this study, which had relatively low spatial resolution, may have limited the accuracy of surface temperature detection, further contributing to the weak association with internal body temperature. This is supported by Marques et al. (4), who, in addition to removing hair from the evaluated regions, employed a thermal camera with higher resolution and accuracy and reported strong correlations (r > 0.80) between surface and rectal temperatures in the EY, HD, HQ, and SE regions of meat goats. By contrast, Sun et al. (5), using a lower-precision camera, reported correlations of 0.21 and 0.30 for the EY and HD regions, respectively.
The low biases observed in the EY and SOC regions may be explained by the fact that these regions and the surrounding skin can provide thermal images that reflect the animal’s sympathetic-vagal balance (9). Thus, under stress, increased blood flow to the ocular region raises eye temperature, even when core body temperature remains low. Bakker et al. (10) explained that the EY region can be used across different animal species as an ideal site for estimating changes in core body temperature because of the absence of fur, hair, or wool. Studies by Bartolomé et al. (11) and Vega et al. (12) further demonstrated that EY temperature is most strongly correlated with both environmental and core body temperature in goats and sheep, respectively. Although differences were observed between the gold-standard and thermal imaging measurements, the bias appeared to reflect a systematic error, indicating that thermal imaging could be a reproducible and reliable method for temperature assessment when mean-bias correction is applied.
The reduced limits of agreement observed in the SE region may be explained by the animal’s lateral positioning, which exposes a relatively larger and more uniform surface area near the scapula compared with the other evaluated regions. This anatomical advantage facilitates more accurate and consistent region selection, allowing for a more representative averaging of thermal pixels. Consequently, it minimizes the influence of image-resolution limitations and enhances the reliability and precision of surface temperature measurements in this area. This finding differs from the results reported by Marques et al. (4), who observed the narrowest limits of agreement in the EY region. Such discrepancies underscore the importance of considering variations associated with factors such as camera specifications and animal positioning during thermal imaging, as noted by Little et al. (13). Moreover, even within adjacent areas, variability can occur, as demonstrated by Bakker et al. (10), who reported distinct thermal responses across different micro-regions near the ocular area when assessing body temperature in sheep.
The predictive models demonstrated low precision, which can be attributed to the weak correlations between the predictor variables and rectal temperature. The performance of the simple regression models was consistent with the results reported by Sun et al. (5) for Chinese goats, with R2 values of 0.07 for HD and 0.04 for EY. The improved precision achieved with the machine-learning model is likely due to the ability of decision trees to effectively handle high variance and multicollinearity, thereby reducing prediction error (14).
Although the current approach relies on specialized thermal imaging equipment, manual image processing, and the use of a single thermal image per animal, which may limit measurement precision by not accounting for temporal variation, the findings establish an important proof of concept regarding the feasibility of infrared thermography for noninvasive body temperature assessment and the identification of the most suitable anatomical regions for this purpose. These results provide a scientific foundation for future studies aimed at developing automated workflows based on artificial intelligence for region detection and temperature extraction from multiple frames or continuous video streams, as well as real-time monitoring systems using direct thermal camera outputs, thereby enhancing the scalability, robustness, and practical application of this technology in precision dairy goat farming.
5. Conclusion
Thermal imaging can be used to estimate and predict rectal temperature in young and adult dairy goats. The EY and SOC regions showed the highest correlations with rectal temperature. The SE region exhibited the lowest temperature variation, indicating greater stability. With appropriate correction for systematic bias, any of the evaluated regions can be used to estimate rectal temperature through thermal imaging in both young and adult dairy goats. Moreover, the decision-tree model proved more effective than the simple linear regression models for predicting rectal temperature from thermal image features.
Generative AI use statement
The authors did not use generative artificial intelligence tools or technologies in creating or editing any part of this manuscript.
Data availability statement
The datasets analyzed during the current study are available from the corresponding author upon request.
References
-
1 Brito LF, Oliveira HR, McConn BR, Schinckel AP, Arrazola A, Marchant-Forde JN, et al. Large-scale phenotyping of livestock welfare in commercial production systems: a new frontier in animal breeding. Front Genet. 2020;11:793. https://doi.org/10.3389/fgene.2020.00793
» https://doi.org/10.3389/fgene.2020.00793 -
2 Mota-Rojas D, Wang D, Titto CG, Gómez-Prado J, Carvajal-de la Fuente V, Ghezzi M, et al. Pathophysiology of fever and application of infrared thermography (IRT) in the detection of sick domestic animals: Recent advances. Animals (Basel). 2021;11:2316. doi: https://doi.org/10.3390/ani11082316
» https://doi.org/10.3390/ani11082316 -
3 McManus R, Boden LA, Weir W, Viora L, Barker R, Kim Y, et al. Thermography for disease detection in livestock: A scoping review. Front Vet Sci. 2022;9:965622. https://doi.org/10.3389/fvets.2022.965622
» https://doi.org/10.3389/fvets.2022.965622 -
4 Marques JI, Leite PG, Lopes Neto JP, Furtado DA, Lopes FFDM. Estimation of rectal temperature of goats based on surface temperature. Eng Agric. 2021;41:591-8. Doi: https://doi.org/10.1590/1809-4430-Eng.Agric.v41n6p591-598/2021
» https://doi.org/10.1590/1809-4430-Eng.Agric.v41n6p591-598/2021 -
5 Sun L, Liu G, Jiang X. Relationships of infrared thermography temperature with core temperature in goats. Trop Anim Health Prod. 2024;56:138. doi: https://doi.org/10.1007/s11250-024-03995-z
» https://doi.org/10.1007/s11250-024-03995-z -
6 Costa EDO, Gordiano LA, Ferreira FG, Santos SA, Carvalho GGP, Araújo MLG, et al. Thermography as an indicator of goat welfare in an intensive production system. Trop Anim Health Prod. 2023;55:373. doi: https://doi.org/10.1007/s11250-023-03791-1?urlappend=%3Futm_source%3Dresearchgate.net%26utm_medium%3Darticle
» https://doi.org/10.1007/s11250-023-03791-1?urlappend=%3Futm_source%3Dresearchgate.net%26utm_medium%3Darticle -
7 Samara EM, Al-Badwi MA, Abdoun KA, Al-Haidary AA. Applicability of thermography as a potential non-invasive technique to assess the body-thermal status of heat-stressed and water-deprived goats (Capra hircus). J Therm Biol. 2024;119:103790. doi: https://doi.org/10.1016/j.jtherbio.2024.103790
» https://doi.org/10.1016/j.jtherbio.2024.103790 -
8 Lima ARC, Silveira RMF, Castro MSM, Vecchi LB, Rocha Fernandes MHM, Resende KT. Relationship between thermal environment, thermoregulatory responses and energy metabolism in goats: A comprehensive review. J Therm Biol. 2022;109:103324. doi: https://doi.org/10.1016/j.jtherbio.2022.103324
» https://doi.org/10.1016/j.jtherbio.2022.103324 -
9 Stewart M, Schaefer AL, Haley DB, Colyn J, Cook NJ, Stafford KJ, Webster JR. Infrared thermography as a noninvasive method for detecting fear-related responses of cattle to handling procedures. Anim Welf. 2008;17(4):387-93. doi: https://doi.org/10.1017/S0962728600027895
» https://doi.org/10.1017/S0962728600027895 -
10 Bakker ML, Milano GD, Fernandez J, Alvarado PI, Nadin LB. Lack of agreement among analysers of infrared thermal images in the temperature of eye regions in sheep. J Therm Biol. 2024;126:181-9. doi: https://doi.org/10.1016/j.jtherbio.2024.104021
» https://doi.org/10.1016/j.jtherbio.2024.104021 -
11 Bartolomé E, Azcona F, Cañete-Aranda M, Perdomo-González DI, Ribes-Pons J, Terán EM. Testing eye temperature assessed with infrared thermography to evaluate stress in meat goats raised in a semi-intensive farming system: A pilot study. Arch Anim Breed. 2019;62:199-204. doi: https://doi.org/10.5194/aab-62-199-2019
» https://doi.org/10.5194/aab-62-199-2019 -
12 Vega WHO, Silveira RMF, Freitas ACB, Quirino CR. Efficiency of infrared pyrometer and infrared thermography for assessing body surface temperature in hair sheep. Res Vet Sci. 2024;181:105450. doi: https://doi.org/10.1016/j.rvsc.2024.105450
» https://doi.org/10.1016/j.rvsc.2024.105450 -
13 Little MW, Weller JE, Buijs S. The impact of the dairy cow’s position on eye and udder temperatures obtained with infra-red thermography within a walk-through system. Animal. 2025;101523. doi: https://doi.org/10.1016/j.animal.2025.101523
» https://doi.org/10.1016/j.animal.2025.101523 -
14 Genuer R, Poggi JM. Random forests. In: Applied Mathematics for Data Science. Cham: Springer Int Publ; 2020. p.33-55. doi: https://doi.org/10.1007/978-3-030-56485-8_3
» https://doi.org/10.1007/978-3-030-56485-8_3
Edited by
-
Editor:
Rondineli P. Barbero