 Prospecting variability in full-sib families of Psidium guajava L. through phenotypic information and SNP markers
ABSTRACT
The species Psidium guajava L., commonly known as guava, is distinguished in the genus Psidium for its economic importance and medicinal properties. This study aimed to assess the population structures in 247 guava genotypes, which were organized into 11 full-sib families (FSF), and to explore the differentiation of these FSF based on phenotypic traits and single nucleotide polymorphism molecular markers. The study utilized a randomized block design to evaluate 10 phenotypic variables and 7,784 polymorphic markers, derived from leaf samples through genetic sequencing using DArTseq technology. The diversity among individuals was quantified using the Mahalanobis’ generalized distance. The UPGMA clustering method identified three homogenous clusters in the families. Excoffier’s analysis of molecular variance (AMOVA) demonstrated significant variability both between and in these clusters, with inter-group variability accounting for about 20% of the total variation. The genetic distance between individuals, calculated using molecular markers, was determined by the arithmetic complement of the unweighted similarity index. Ward’s method delineated five subpopulations. AMOVA further verified significant variability both between and in these subpopulations, attributing 89% of the total variation to differences between the groups formed. Eleven FSF could not be differentiated based on the analyzed data. Nevertheless, the analyses confirmed substantial genetic diversity, endorsing the continuity of the breeding program through selection and future crosses.
Key words
genetic diversity; genetic distance; full-sib families
INTRODUCTION
The guava (Psidium guajava L.) belongs to the family Myrtaceae and the subclass Rosidae. It is a perennial and monoecious species. This means pollination and fruiting can be done in the same individual plant, because it has separate male and female flowers. The leaves are simple, opposite, and aromatic. The flowers are white with numerous stamens; they are solitary or in small clusters in the leaf axils.
Originating from South America, the guava was spread across African and Asian territories by European explorers. Presently, this crop thrives in various tropical and subtropical zones worldwide, owing to its remarkable adaptability to the diverse soil and climatic conditions prevalent in these areas (Angulo-López et al. 2021).
India and Pakistan collectively account for nearly half of the global guava yield. Alongside these nations, Brazil, Mexico, and Venezuela significantly contribute to the production of the fruit on the American continent (Yousaf et al. 2021). In 2022, guava cultivation in Brazil encompassed an area of 22,684 hectares, yielding 564,764 t, with the state of Rio de Janeiro producing 16,657 t, ranking it as the seventh-largest guava producer in the country (IBGE 2023).
The favorable tropical climate and fertile soil in Rio de Janeiro provide optimal conditions for guava farming. The strategic location of the state near major urban centers, along with its developed port and export facilities, ensures the swift distribution of produce. Additionally, the economic diversity of Rio de Janeiro, spanning tourism to manufacturing, creates a supportive environment for investments in research and technological advancements to enhance guava production.
Guava is appreciated both fresh and in-processed products, with consumers often preferring seedless varieties or those with few, soft seeds. Additionally, traits such as sweetness, color, pulp consistency, appearance, skin thickness, and nutritional value are highly valued. Improving these qualities is the goal of various breeding programs. In Brazil and around the world, these programs also aim to enhance fruit uniformity, extend shelf life, and increase resistance to pests, such as guava decline, as well as to water stress (Thakur et al. 2021).
In this framework, plant breeding plays a fundamental role in agricultural production, enabling the enhancement of commercially valuable traits and the development of cultivars tailored to the specific conditions of the region.
Given the perennial nature of guava, breeding strategies must account for the variations observed in the lengthy production cycles, early yield among plants, and environmental influences. The integration of molecular markers with advancements in computational technology bridges traditional breeding methods, which rely solely on phenotypic observations, with contemporary molecular techniques, thereby refining the accuracy of genetic parameter estimation and prediction (Silva et al. 2022).
There is little scientific research evaluating genetic diversity in association with phenotypic variability in guava, using genetic markers for both geographic association studies and germplasm evaluation, in Brazil and abroad. This is partly due to the use of geographically close populations and the limitation of molecular markers, which are scarce and have low density across the genome, as in the case of RAPD markers (Diaz-Garcia and Padilla-Ramírez 2023).
There is also a significant limitation in studies on the evolution of guava and its genetic improvement potential due to the absence of a reference genome. However, efforts for chromosome-level analyses are underway. Feng et al. (2021), for example, presented a chromosome-level genome assembly of guava while investigating metabolic pathways related to fruit softening.
Among molecular markers, single nucleotide polymorphisms (SNPs) are distinguished for their precision, high resolution, and compatibility with automated processing on next-generation sequencing (NGS) platforms (Grossi et al. 2021). According to the scope of NGS platforms, DArTseq technology is particularly noted for its broad genomic coverage and efficiency, making it a preferred choice for diversity studies and offering considerable economic advantages (Koura et al. 2024).
This study aimed to assess the population structure in a group of 247 guava genotypes, organized into 11 full-sib families (FSF), utilizing phenotypic data and information from SNP molecular markers.
The studied population consists of individuals with phenotypic variability observed in the field. This article presents a multifaceted population analysis methodology to determine whether this variability is also reflected in the genetic markers, considering that the individuals analyzed have a high degree of relatedness and that the parents are relatively close geographically. Additionally, it is estimated that previous interventions, such as selection and controlled crossings carried out by the Universidade Estadual do Norte Fluminense Darcy Ribeiro (UENF) guava breeding program, may have significantly influenced the genotypic variability of the population.
MATERIAL AND METHODS
Plant material
The genotypes comprising the study population were obtained in 2008, with the beginning of the UENF genetic improvement program. During a pre-breeding stage, 20 accessions of P. guajava L. were selected from commercial orchards and open-pollinated plants in the municipalities of São João da Barra and Bom Jesus do Itabapoana, in the state of Rio de Janeiro, southeastern Brazil.
After cytogenetic and diversity studies using RAPD markers, conducted by Pessanha et al. (2011), individuals with a considerable degree of heterozygosity were selected for crossing. These crosses resulted in 17 full-sibling families. Characteristics related to fruit quality and productivity of this new segregating population were evaluated over three production periods by Quintal et al. (2017). In this study, the mixed model methodology was used to select the parents of 11 full-sibling families, which are the focus of the study presented in this article, as shown in Table 1.
Kinship information of the 11 full-sib families generated from selection by Quintal et al. (2017). The numbers separated by dots represent families and individuals respectively. Roman numerals represent the blocks of the experimental design. Campos dos Goytacazes (RJ), Brazil.
The research was conducted at the experimental site of UENF, situated in the Antônio Sarlo Agricultural School in Campos dos Goytacazes, RJ, Brazil (21°08’02’’S; 41°40’47’’W). The area is characterized by a sub-humid and dry tropical climate, with an average annual temperature fluctuating between 22 and 25°C, and annual precipitation ranging from 1,200 to 1,300 mm.
The guava plants were planted with a spacing of 1.2 m between each plant and 3.5 m between rows. All cultivation practices, including pruning, were performed following standard guava cultivation guidelines (Silva et al. 2016; Semiárido Ministério da Agricultura & Abastecimento, 2010).
A randomized block experimental design was adopted, comprising three replicates for each family. Each experimental unit included eight plants from the same family. The assessment was made on five randomly selected fruits per plant, specifically those with a yellowish-green skin indicative of the third stage of maturation, defined by a color angle ranging from 112 to 108°h (Azzolini et al. 2004).
Phenotypic variables
The evaluation of the plants involved analyzing five fruits for the following traits:
-
Individual fruit weight (FW): determined using a semi-analytical scale, with the weight expressed in g;
-
Fruit length (FL): measured along the longitudinal axis of the fruits with a digital caliper, with the length expressed in mm;
-
Fruit diameter (FD): assessed at the equatorial region of the fruits using a digital caliper, with the diameter expressed in mm;
-
Pulp weight (PPW): calculated as the weight of the fruit excluding the placenta, measured with a semi-analytical scale and expressed in g;
-
Placenta weight (PLW): focused on the seed-concentrated region, determined using a semi-analytical scale;
Endocarp thickness (ET): measured in the seed-concentrated region with a digital caliper, with the thickness expressed in mm;
-
Mesocarp thickness (MT): pertains to the area from the fruit peel to the beginning of the placenta, measured using a digital caliper and expressed in mm;
-
Peel thickness (PT): relates to the fruit peel region, measured with a digital caliper and expressed in mm;
-
Soluble solids content (BRIX): assessed using an Atago No. 1 digital refractometer, with results expressed in degrees Brix (°Brix);
-
Total production (PROD): calculated by summing the weights of all fruits produced by each evaluated plant, measured using an electronic scale and expressed in g.
Molecular variables
Genetic material from 247 guava specimens was collected for genotyping. The high cost of producing specific probes for guava makes it unfeasible to obtain detailed genotypic information for this species. However, considering that guava and eucalyptus belong to the same family, Myrtaceae, and share a relatively close taxonomic level, there is a moderately close relationship between these plants. This genetic proximity suggests that they share common characteristics due to their ancestry within the family. Given the availability of Brazilian Agricultural Research Corporation (Embrapa), SNP probes and the high probability of random and uniform hybridization across the guava genome, the Axiom 72K ESAI Eucalyptus SNP Array Initiative (Embrapa) was used to obtain the necessary genotypic information. Genomic DNA extraction was performed on young, fully matured leaves, adhering to the procedure described by Inglis et al. (2018). For molecular marker identification, samples underwent analysis utilizing the diversity arrays technology (DArTseq) sequencing genotyping approach, refined by DArT P/L in Canberra, Australia. The analysis resulted in the identification of 72,202 SNP markers within the population. These markers were subjected to four quality filters, that were excluded:
-
Markers with a minor allele frequency of 5% or less;
-
Markers with over 10% missing data;
-
Markers displaying zero variation (uniform across all evaluated individuals);
-
Duplicate markers.
Imputations of 2.75% of missing data were conducted by substituting with the allele most prevalent in the individual. After quantity filtering, a total of 7,874 markers remained for each individual (Cruz 2013, 2016).
Statistical approach
The genetic variability between and in the designated subpopulations (families or groups) was assessed using Excoffier’s molecular analysis of variance (AMOVA) (Excoffier et al. 1992, Cruz et al. 2020, Huang et al. 2021, Abbaszadeh et al. 2023). AMOVA employs a model that allocates variability contributions to the effects under investigation (Eq. 1):
where: Yij: variability observed between individual pair J in population i; μ: constant term; Pi: effect of subpopulation i; Dij: dissimilarity effect between individual pair j in subpopulation i.
The measure of proportionality, ΦST, was calculated from the ratio , in which σp2 represents the variance between groups, σi2 is the associated variance within groups; and σT2 = σp2 + σi2. Therefore, ΦST indicates the contribution of molecular variance between the subpopulations studied relative to the total molecular variance. A permutation test with 999 iterations was employed to establish confidence intervals for the analyzed statistics, aiming to test the null hypothesis that assumes no variance within and between the populations under study.
To quantify genetic distances between the FSF, Mahalanobis’ generalized distance was employed (Eq. 2) as the chosen measure of dissimilarity, based on data from the phenotypic variables examined:
where: Dii’2: Mahalanobis’ generalized distance between individual i and i’; δ’ = [d1, d2,…,dv], in which v is the number of phenotypic variables analyzed; δ’ = [d1, d2,…,dv]: the difference between the mean values of variable v for families i and i’; φ: g matrix of residual variances and covariances; ωjj’: element of the inverse matrix of residual variances and covariances at row j and column j.
Additionally, the S.j statistic proposed by Singh (1981) was computed to ascertain the relative contribution of each variable toward explaining the observed divergence (Eq. 3):
The analysis of molecular data included assessments of heterozygosity, inbreeding coefficients, and polymorphism information content (PIC). Observed heterozygosity is calculated as the ratio between the number of heterozygous individuals and the total number of individuals in the population. Expected heterozygosity, on the other hand, can be calculated from allele frequencies and is equal to twice the product of the frequencies of the reference and alternative alleles. Inbreeding is determined as the arithmetic complement of the ratio between observed and expected heterozygosity. The PIC calculation considers the allele frequencies at a given locus (p_i) to determine how informative that locus is (Eq. 4):
Dissimilarity between two individuals was quantified using the arithmetic complement of the unweighted similarity index (Eq. 5):
where: Sii’: similarity index between individuals i and i’; L: number of loci being studied; cj: number of alleles common between individuals i and i’ at loci j (Table 2).
The unweighted similarity index ranges from 0 to 1. A dissimilarity matrix was constructed, with each dij element representing the distance between individuals i and j (Eq. 6):
For clustering and analyzing subpopulations, the unweighted pair group method with arithmetic mean (UPGMA) and Ward’s method (D2) were employed. The UPGMA method was used due to the characteristics of the phenotypic data presented and its low sensitivity to the presence of outliers. Conversely, the Ward’s method was chosen because it provides greater internal homogeneity and has a tendency to combine groups with few elements, a desired characteristic given the low variability presented by the SNP information.
Data management, including the organization of phenotypic data and molecular markers, was facilitated by the ‘Tidyverse’ suite of packages for R, utilizing the ‘dplyr’ package. Plots were generated using the ggplot2 package (Wickham et al. 2019). Mahalanobis’ generalized distance calculations and clustering techniques were performed using the ‘Multivariate Analysis’ package, also for R (Azevedo 2021). Dendrogram creation was accomplished with the ‘Dendextend’ package (Galili 2015). Finally, AMOVA analyses were conducted using the ‘genetic diversity’ module of Genes software (Cruz 2013, 2016).
RESULTS AND DISCUSSION
Available variability based on phenotypic observations
A descriptive analysis was performed on the variables analyzed. Mean, maximum, and minimum data are available in Table 1. AMOVA analysis was implemented considering the 11 FSF and individuals in the FSF as hierarchical levels (Table 3).
The ΦST statistic calculated was 0.1868ns. The permutation test indicates that the variability between and in the 11 FSF was not statistically significant, leading to the conclusion that differentiation between the 11 FSF under investigation is not feasible.
In contrast, a study by Bernardes et al. (2022) reported a moderate yet significant level of differentiation between three populations of P. guajava L., sourced from five restinga regions (coastal plains covered by marine deposits) in Espírito Santo state, Brazil. It is important to note that the differences observed in the study by Bernardes et al. (2022) can be attributed, among other factors, to the greater geographic scope of their sampling locations, as opposed to the geographically very close origins of the 11 FSF examined in this study. The accessions that gave rise to the population studied here were collected in two sampling areas approximately 100 km apart. This proximity contributed to homogeneity and the resulting impossibility of distinguishing between families. The observed low genetic diversity in and between the 11 FSF can be linked to two cycles of selection. The first cycle phase was informed by data from producers in the orchards, while the subsequent phase involved multi-crop evaluations, a multivariate assessment index, and the application of mixed models (Paiva et al. 2016).
Moreover, the expected uniformity in commercial orchards simplifies management practices. Furthermore, the existence of kinship between families contributes significantly to the AMOVA analysis confirming the impossibility of differentiating the FSF based on the variables analyzed.
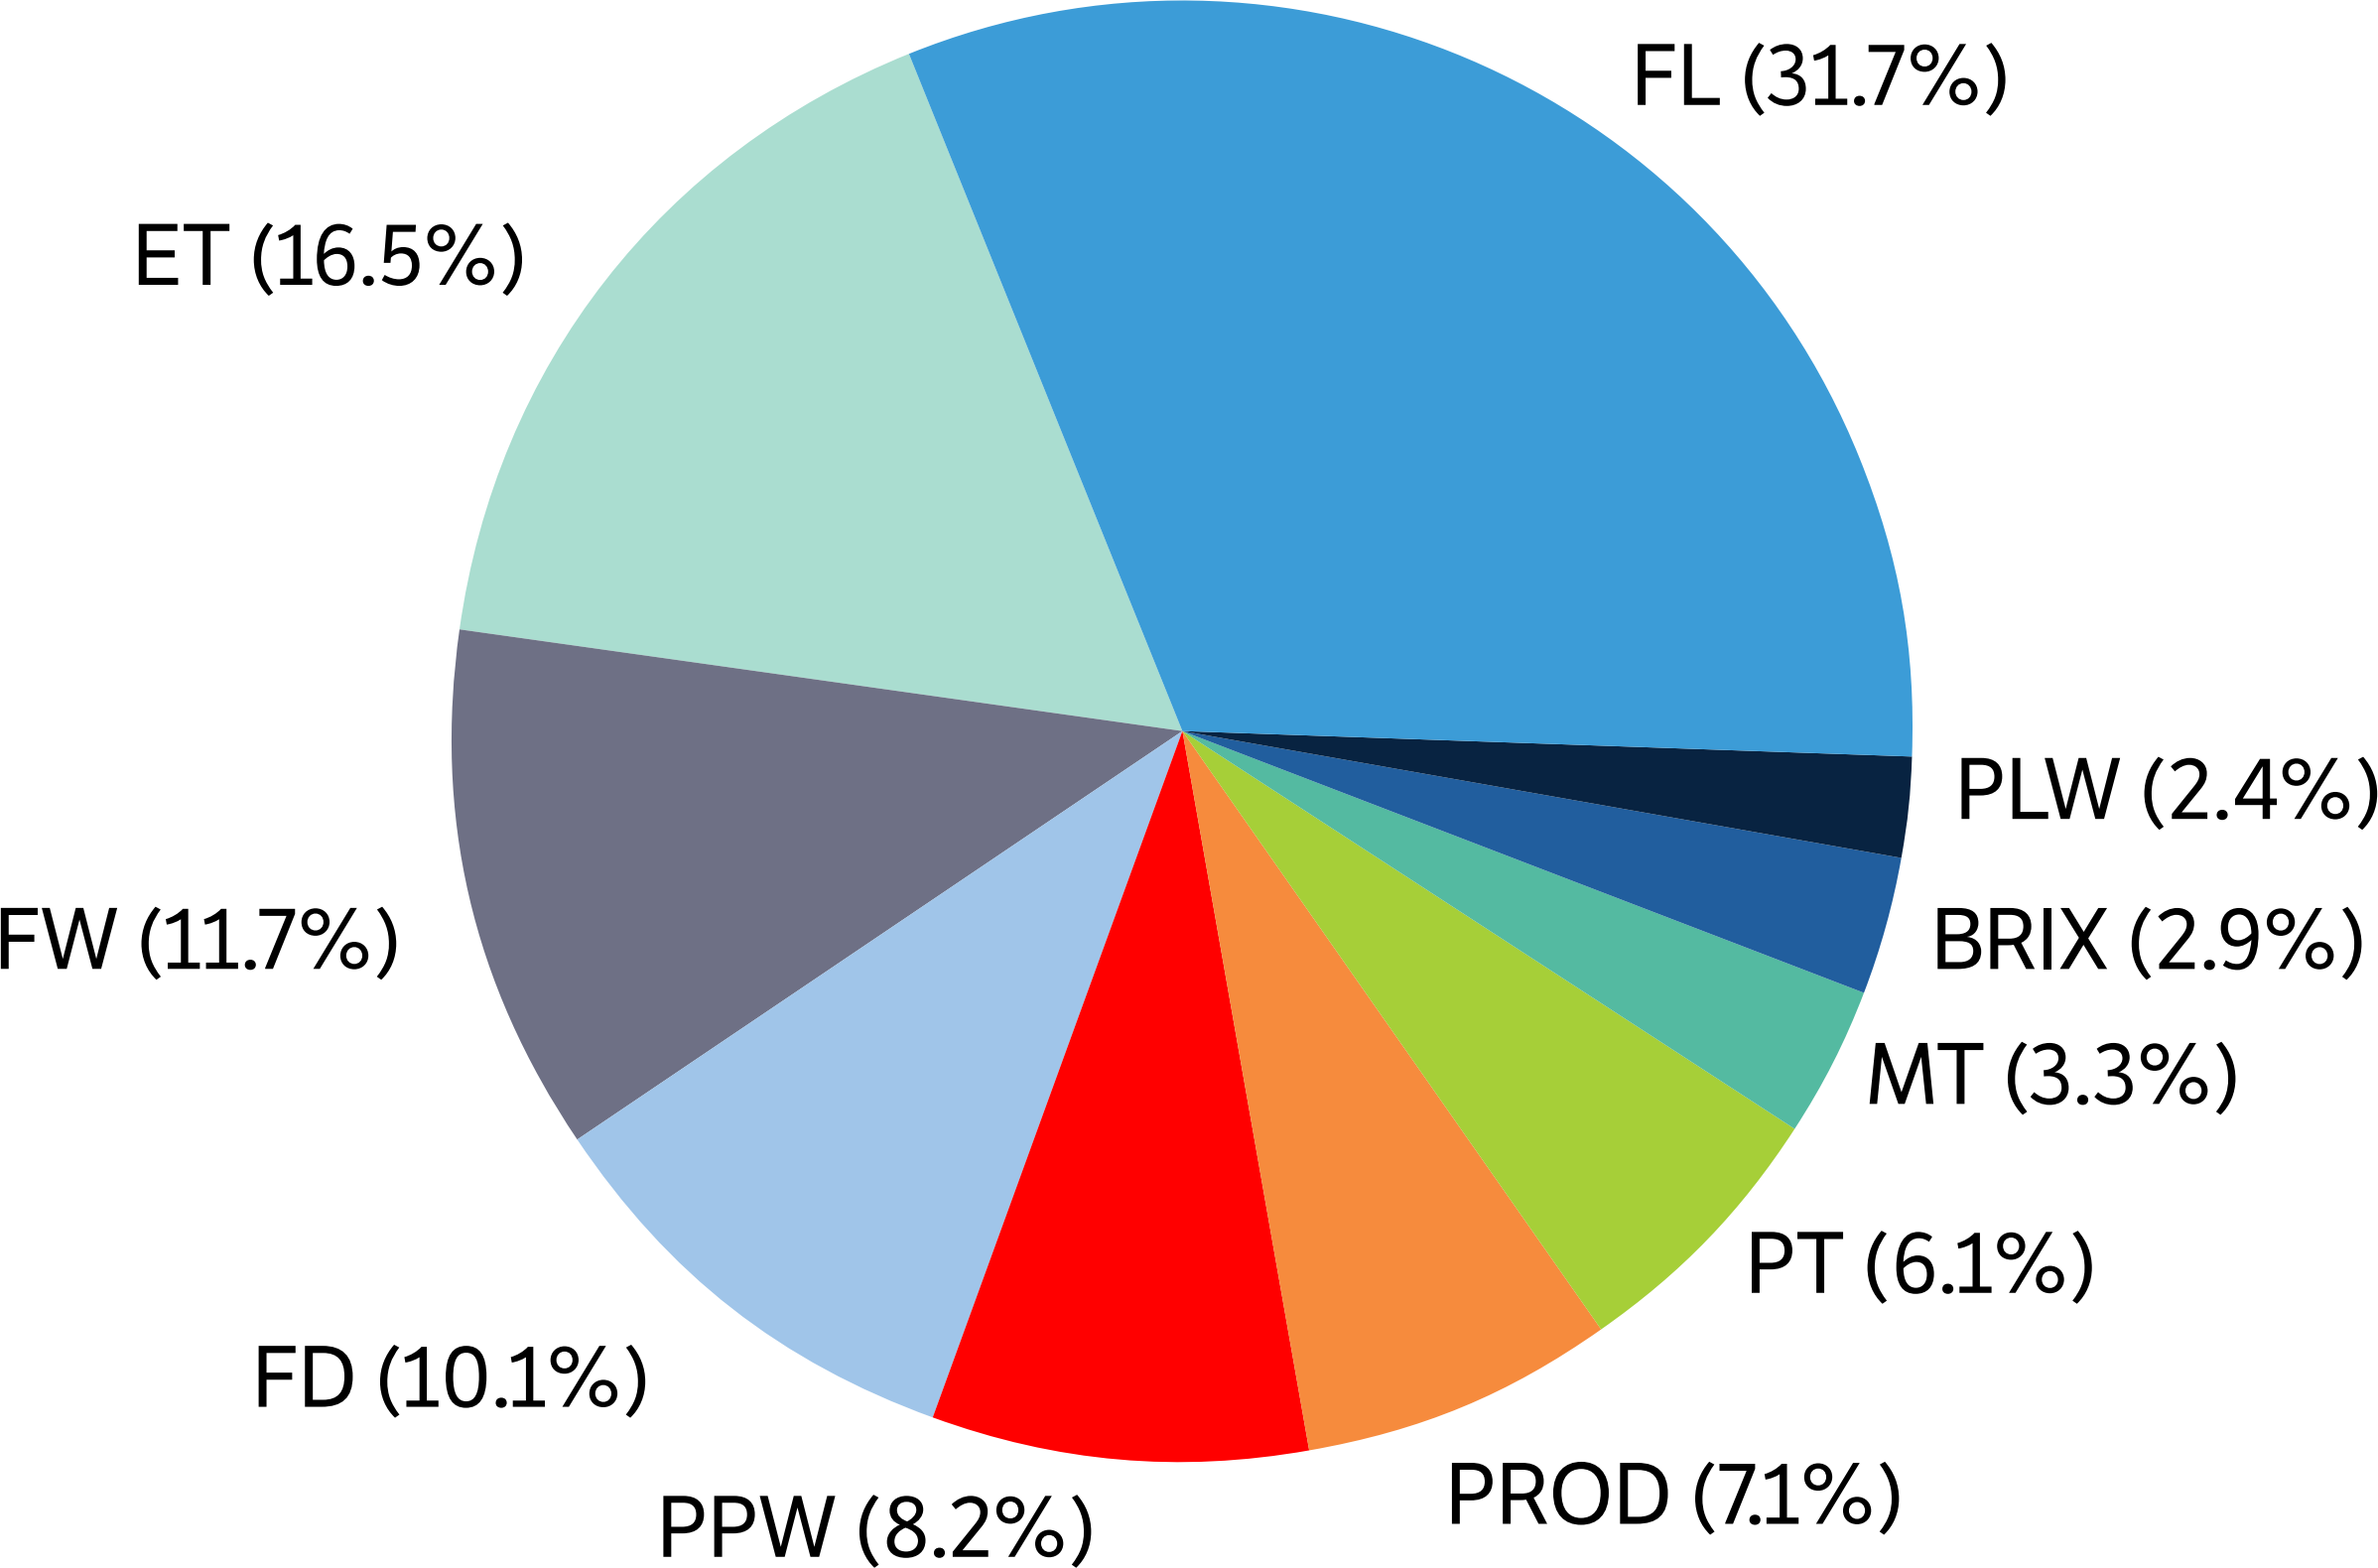
Still addressing genetic diversity analysis, the relative contribution of phenotypic variables to diversity was quantified using the statistical approach proposed by Singh (1981). Variables such as fruit length, weight, and diameter; endocarp thickness; pulp weight; and production accounted for over 85% of the observed variability (Fig. 1).

Contribution of the 10 variables studied to explain the diversity among the 11 guava full-sib families.
This finding aligned with results presented by Singh et al. (2015), who employed Mahalanobis’ generalized distance to assess genetic distances among 35 guava genotypes, highlighting the significant role of morphological traits of the fruit in the diversity observed.
These findings highlight the significance of morphological traits in the selection and breeding of guava genotypes, aiming at the development of better adapted and productive cultivars.
It is equally important to acknowledge that selection cycles and artificial crossings have varied impacts on the variables under study. Consequently, the contribution of guava fruit morphological traits to the observed diversity will differ across different phases of breeding programs.
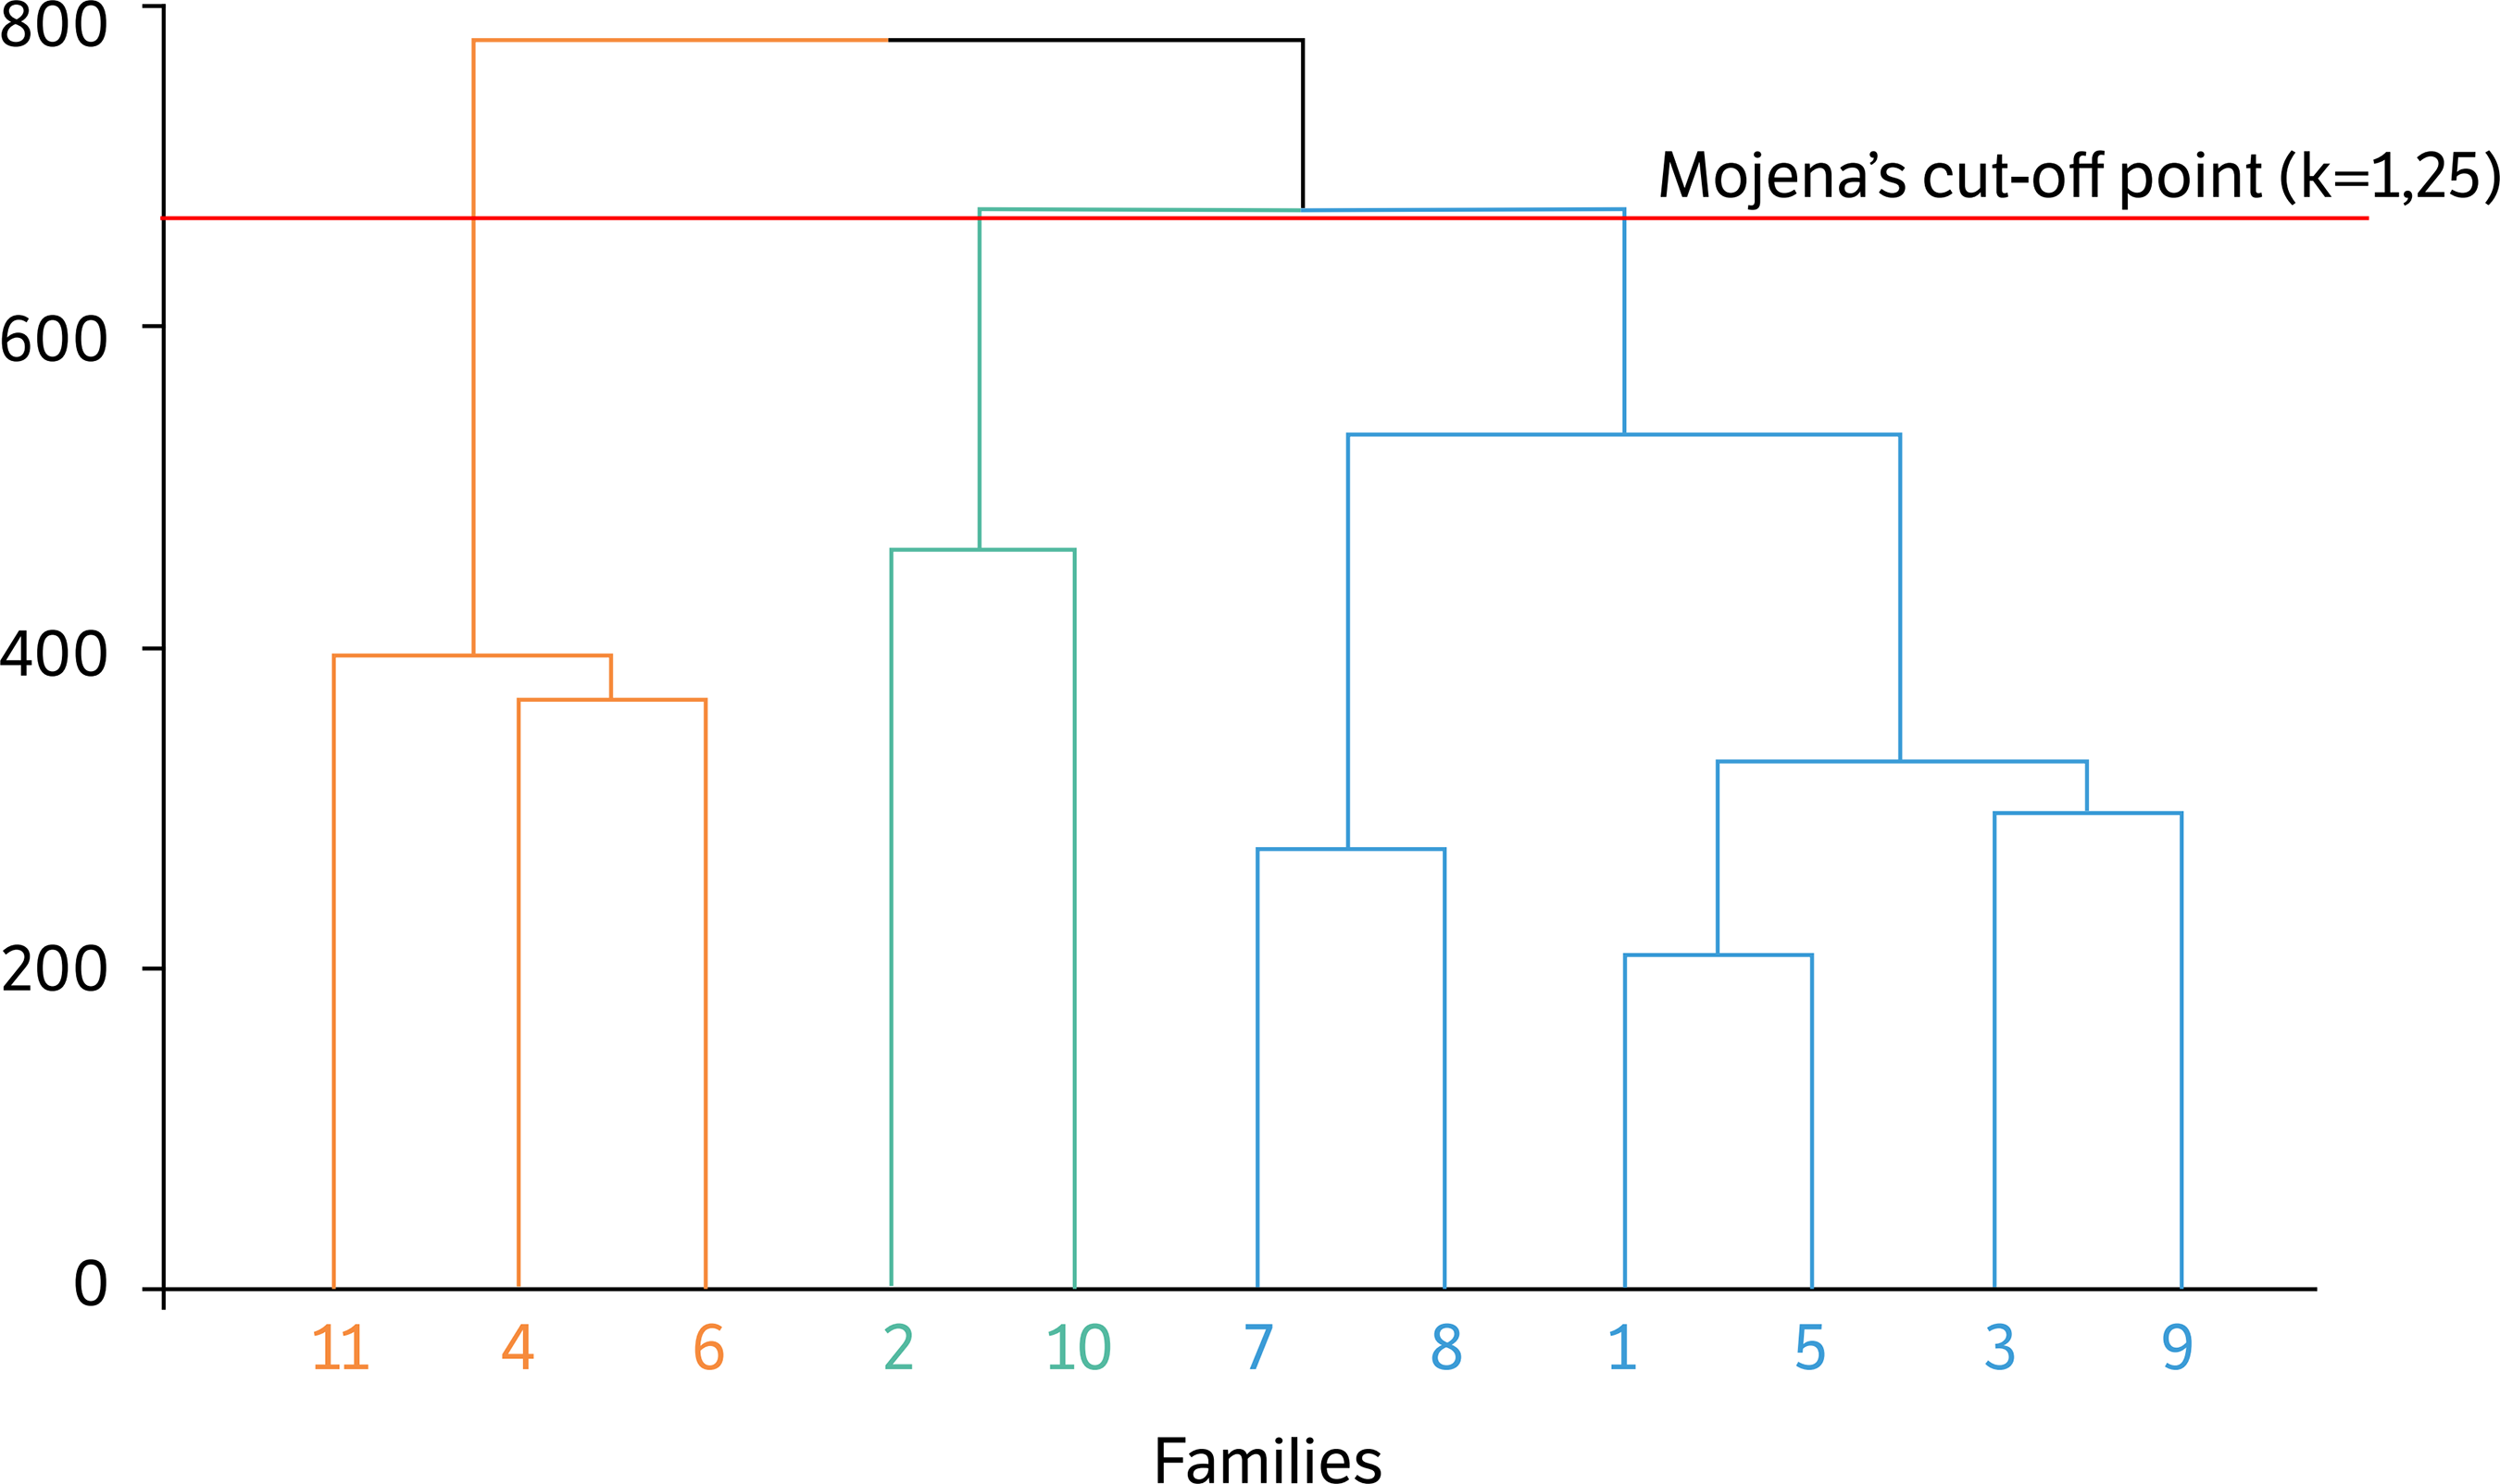
The dissimilarity matrix was derived from Mahalanobis’ generalized distance, and the dendrogram illustrates the three groups formed using the UPGMA hierarchical clustering method and Mojena’s cut-off technique (Mojena 1977), setting k at 1.25 (Fig. 2). Group I included families 1, 3, 5, 7, 8, and 9, while Group II comprised families 2 and 10, and Group III consisted of families 4, 6, and 11.
Dendrogram obtained by Mahalanobis’ generalized distance using the unweighted pair group method with arithmetic mean (UPGMA) methodology, clustering the 11 guava full-sib families into three groups. Different colors in the dendrogram indicate different groups. Blue represents Group I, green represents Group II, and magenta represents Group III.
Ambrósio et al. (2022) also applied the UPGMA technique to group 61 P. guajava L. genotypes into three more homogenous clusters. The clustering observed in both their study and this research indicated the presence of, albeit limited, genetic diversity, presenting opportunities for exploration in subsequent selection and crossing cycles.
Crossing between individuals from genetically distinct groups maximizes vigor in their progeny, making the information on group formation essential in parent selection for future crosses to optimize the use of heterosis.
An AMOVA analysis was conducted considering the groups formed via UPGMA methodologies and the individuals in these clusters as hierarchical levels (Table 4).
Result of Excoffier’s analysis of molecular variance for the three groups formed using the unweighted pair group method with arithmetic mean (UPGMA) approach.
The derived ΦST statistic stood at 0.20128. AMOVA indicated that over 20% of the total variation originates from differences between the groups, as delineated by the findings. The permutational test further validated the significance of these variability estimates at the 5% significance level.
The detection of significant variability between the clusters formed through the UPGMA clustering technique substantiates the presence of genetic diversity in the population under study. The maintenance of variability and differentiability among the formed groups indicates the viability of continuing the genetic improvement program with the studied population, suggesting that new cycles of controlled selection and crossing could be effectively applied. However, to optimize the process and ensure result accuracy, further studies will be needed to estimate genetic parameters and variance components. These data are crucial for refining selection strategies and achieving sustainable progress in the genetic improvement of the population.
The AMOVA analysis was applied considering the 11 FSF and the individuals in these FSF as hierarchical levels. The analysis utilized the arithmetic complement of the unweighted similarity index between loci as the measure of similarity (Table 5).
Result of Excoffier’s molecular analysis of variance for the 11 guava full-sib families considering data from single nucleotide polymorphisms molecular markers.
The calculated ΦST statistic was 0.014157ns, suggesting that roughly 1% of the total variance is attributable to differences among the 11 FSF. The permutational test confirmed the lack of significance of these estimates. Therefore, based on the generated distance matrix, the 11 FSF were not differentiable.
These AMOVA findings aligned with the observed low genetic variability, which mirrors the earlier noted unfeasibility of distinguishing FSF based on phenotypic variables. Furthermore, the impact of kinship in the FSF became particularly evident when examining molecular data (Table 1).
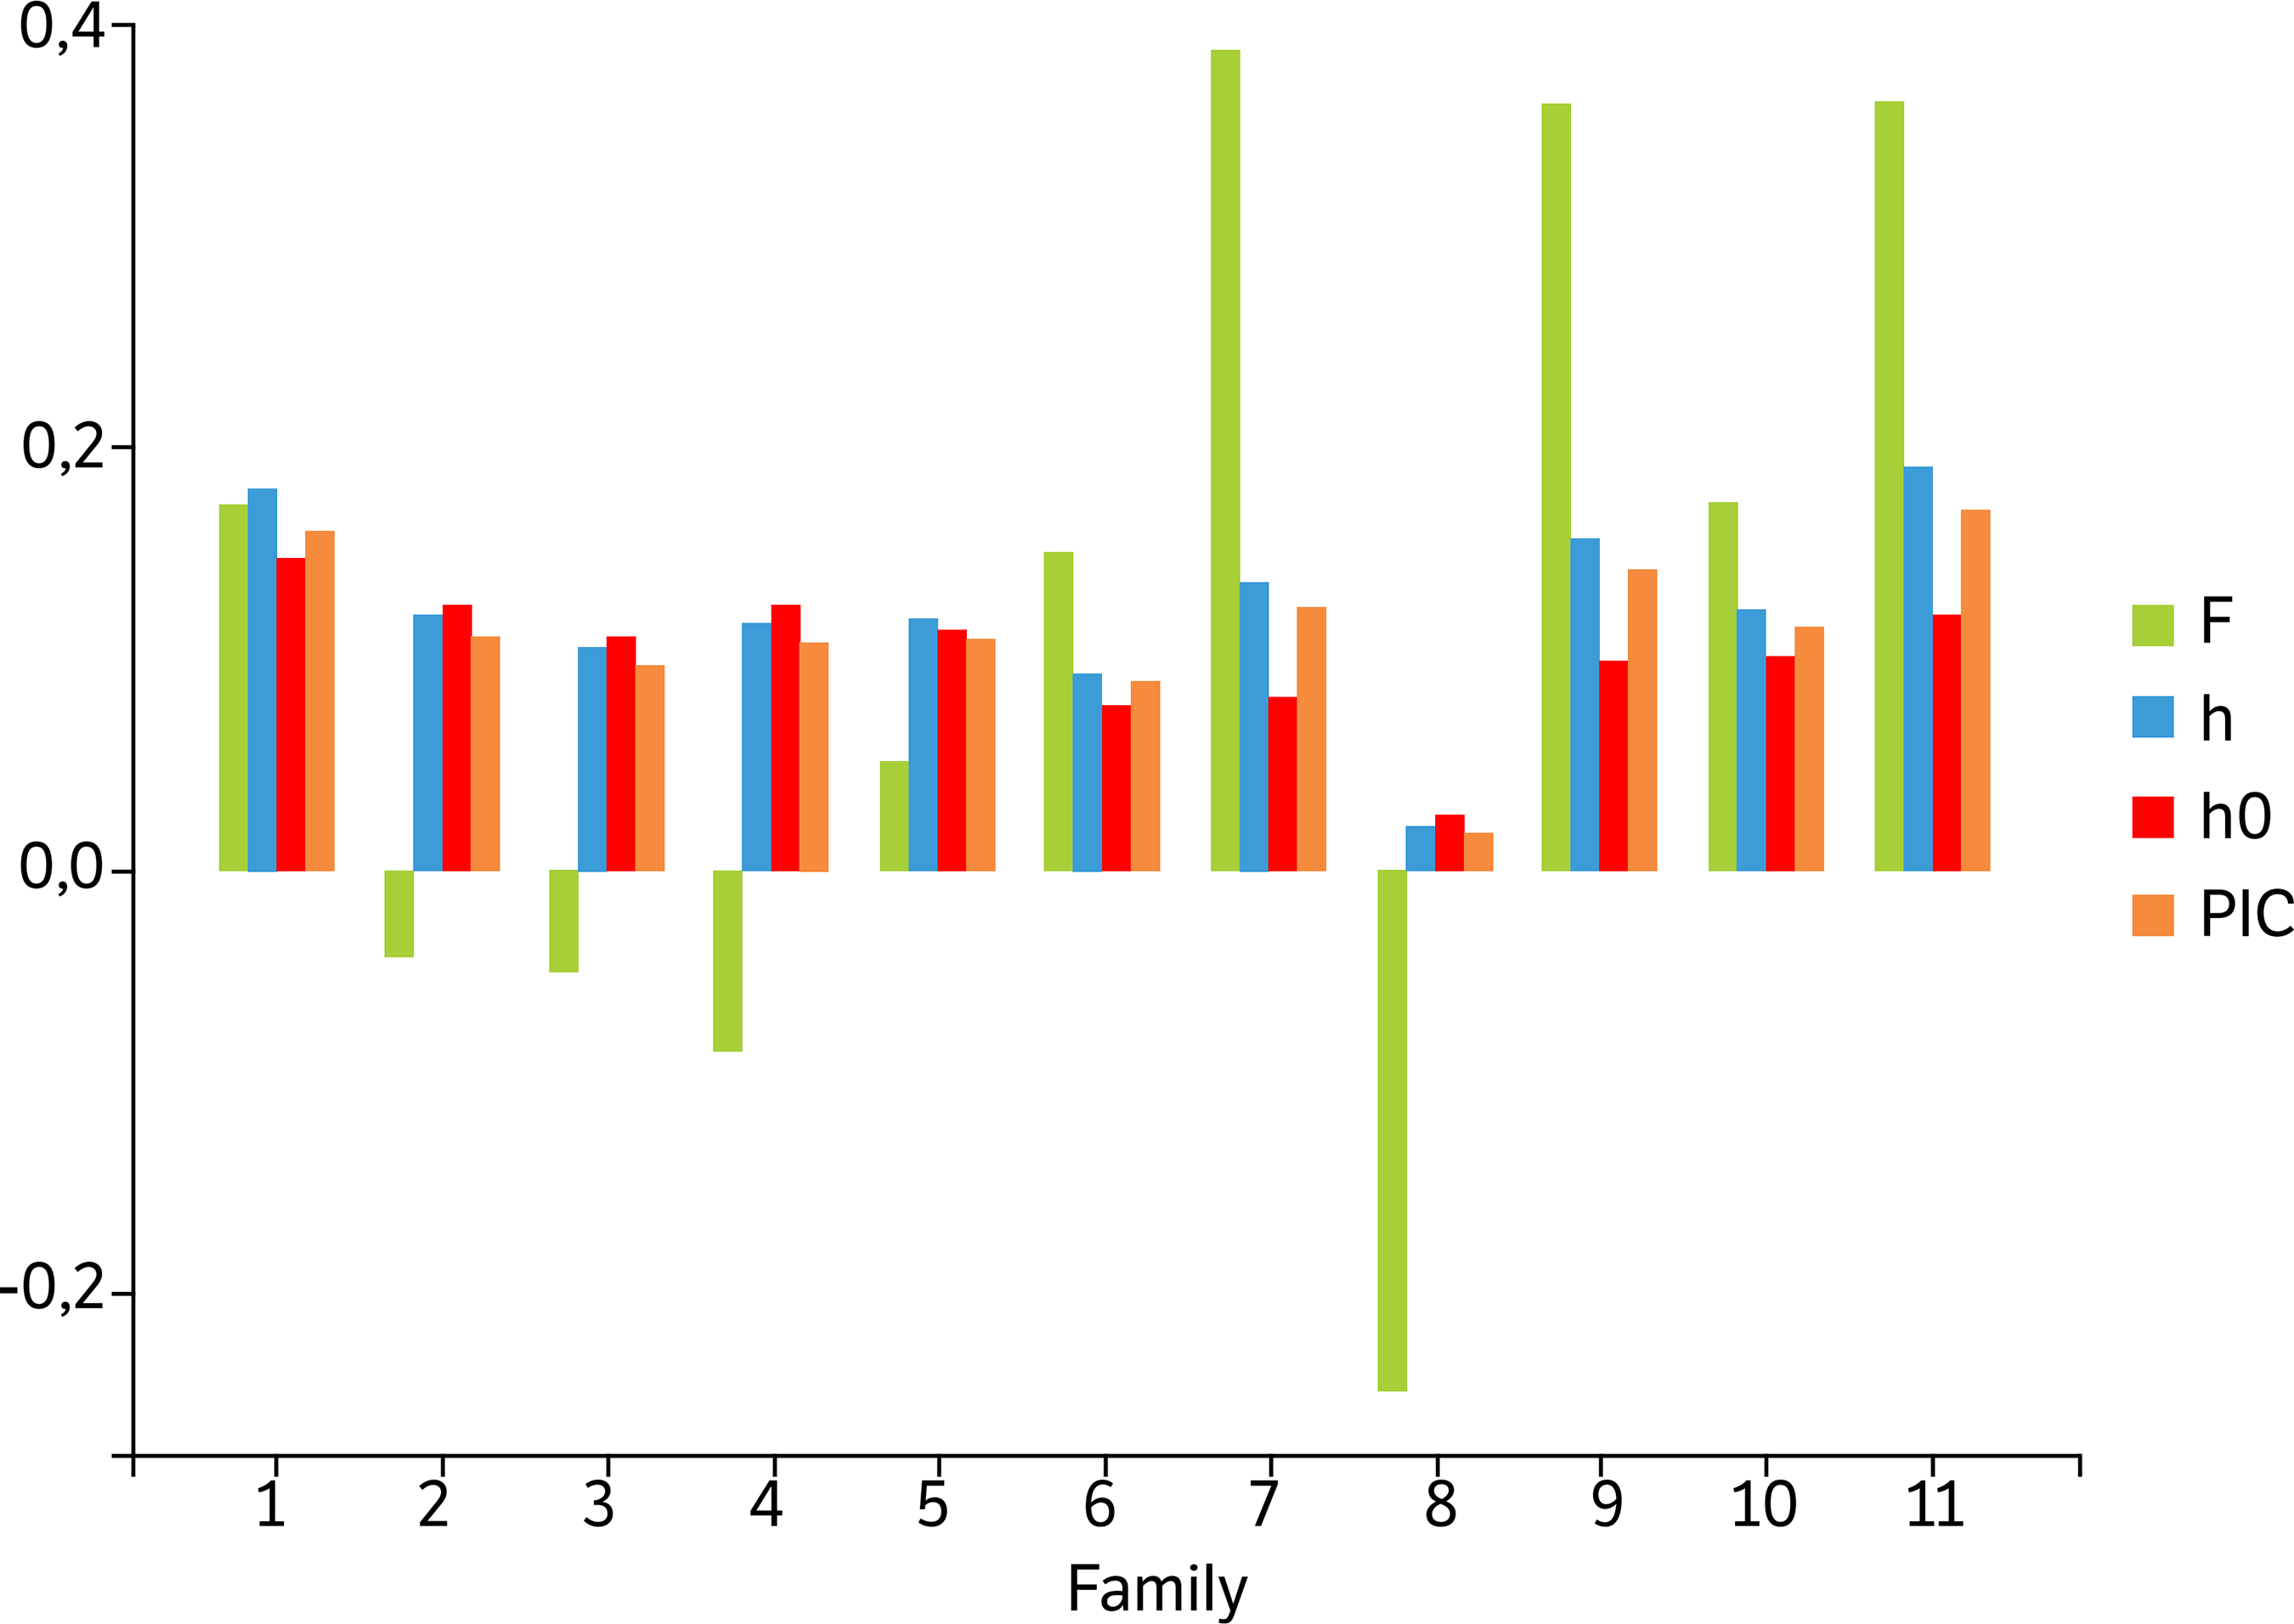
The investigation into heterozygosity, inbreeding, and PIC provided an overview of the genetic makeup of the studied families (Fig. 3). The outcomes pointed to a generally low genetic variability among families, with family 8 being an exception due to its significantly lower values of both expected and observed heterozygosity and PIC in comparison to the other families.
Notably, families 7, 9, and 11 exhibited greater disparity between expected heterozygosity under Hardy-Weinberg equilibrium and the observed heterozygosity, though these variances did not surpass 0.007. The presence of inbreeding, as measured by the F index, was markedly evident in families 7, 8, 9, and 11, with family 7 showing a pronounced value of 0.4. These findings suggested a degree of genetic uniformity in the examined families.

Results of inbreeding, heterozygosity, and polymorphism information content analyses for the 11 guava full-sib families, obtained using GENES software.
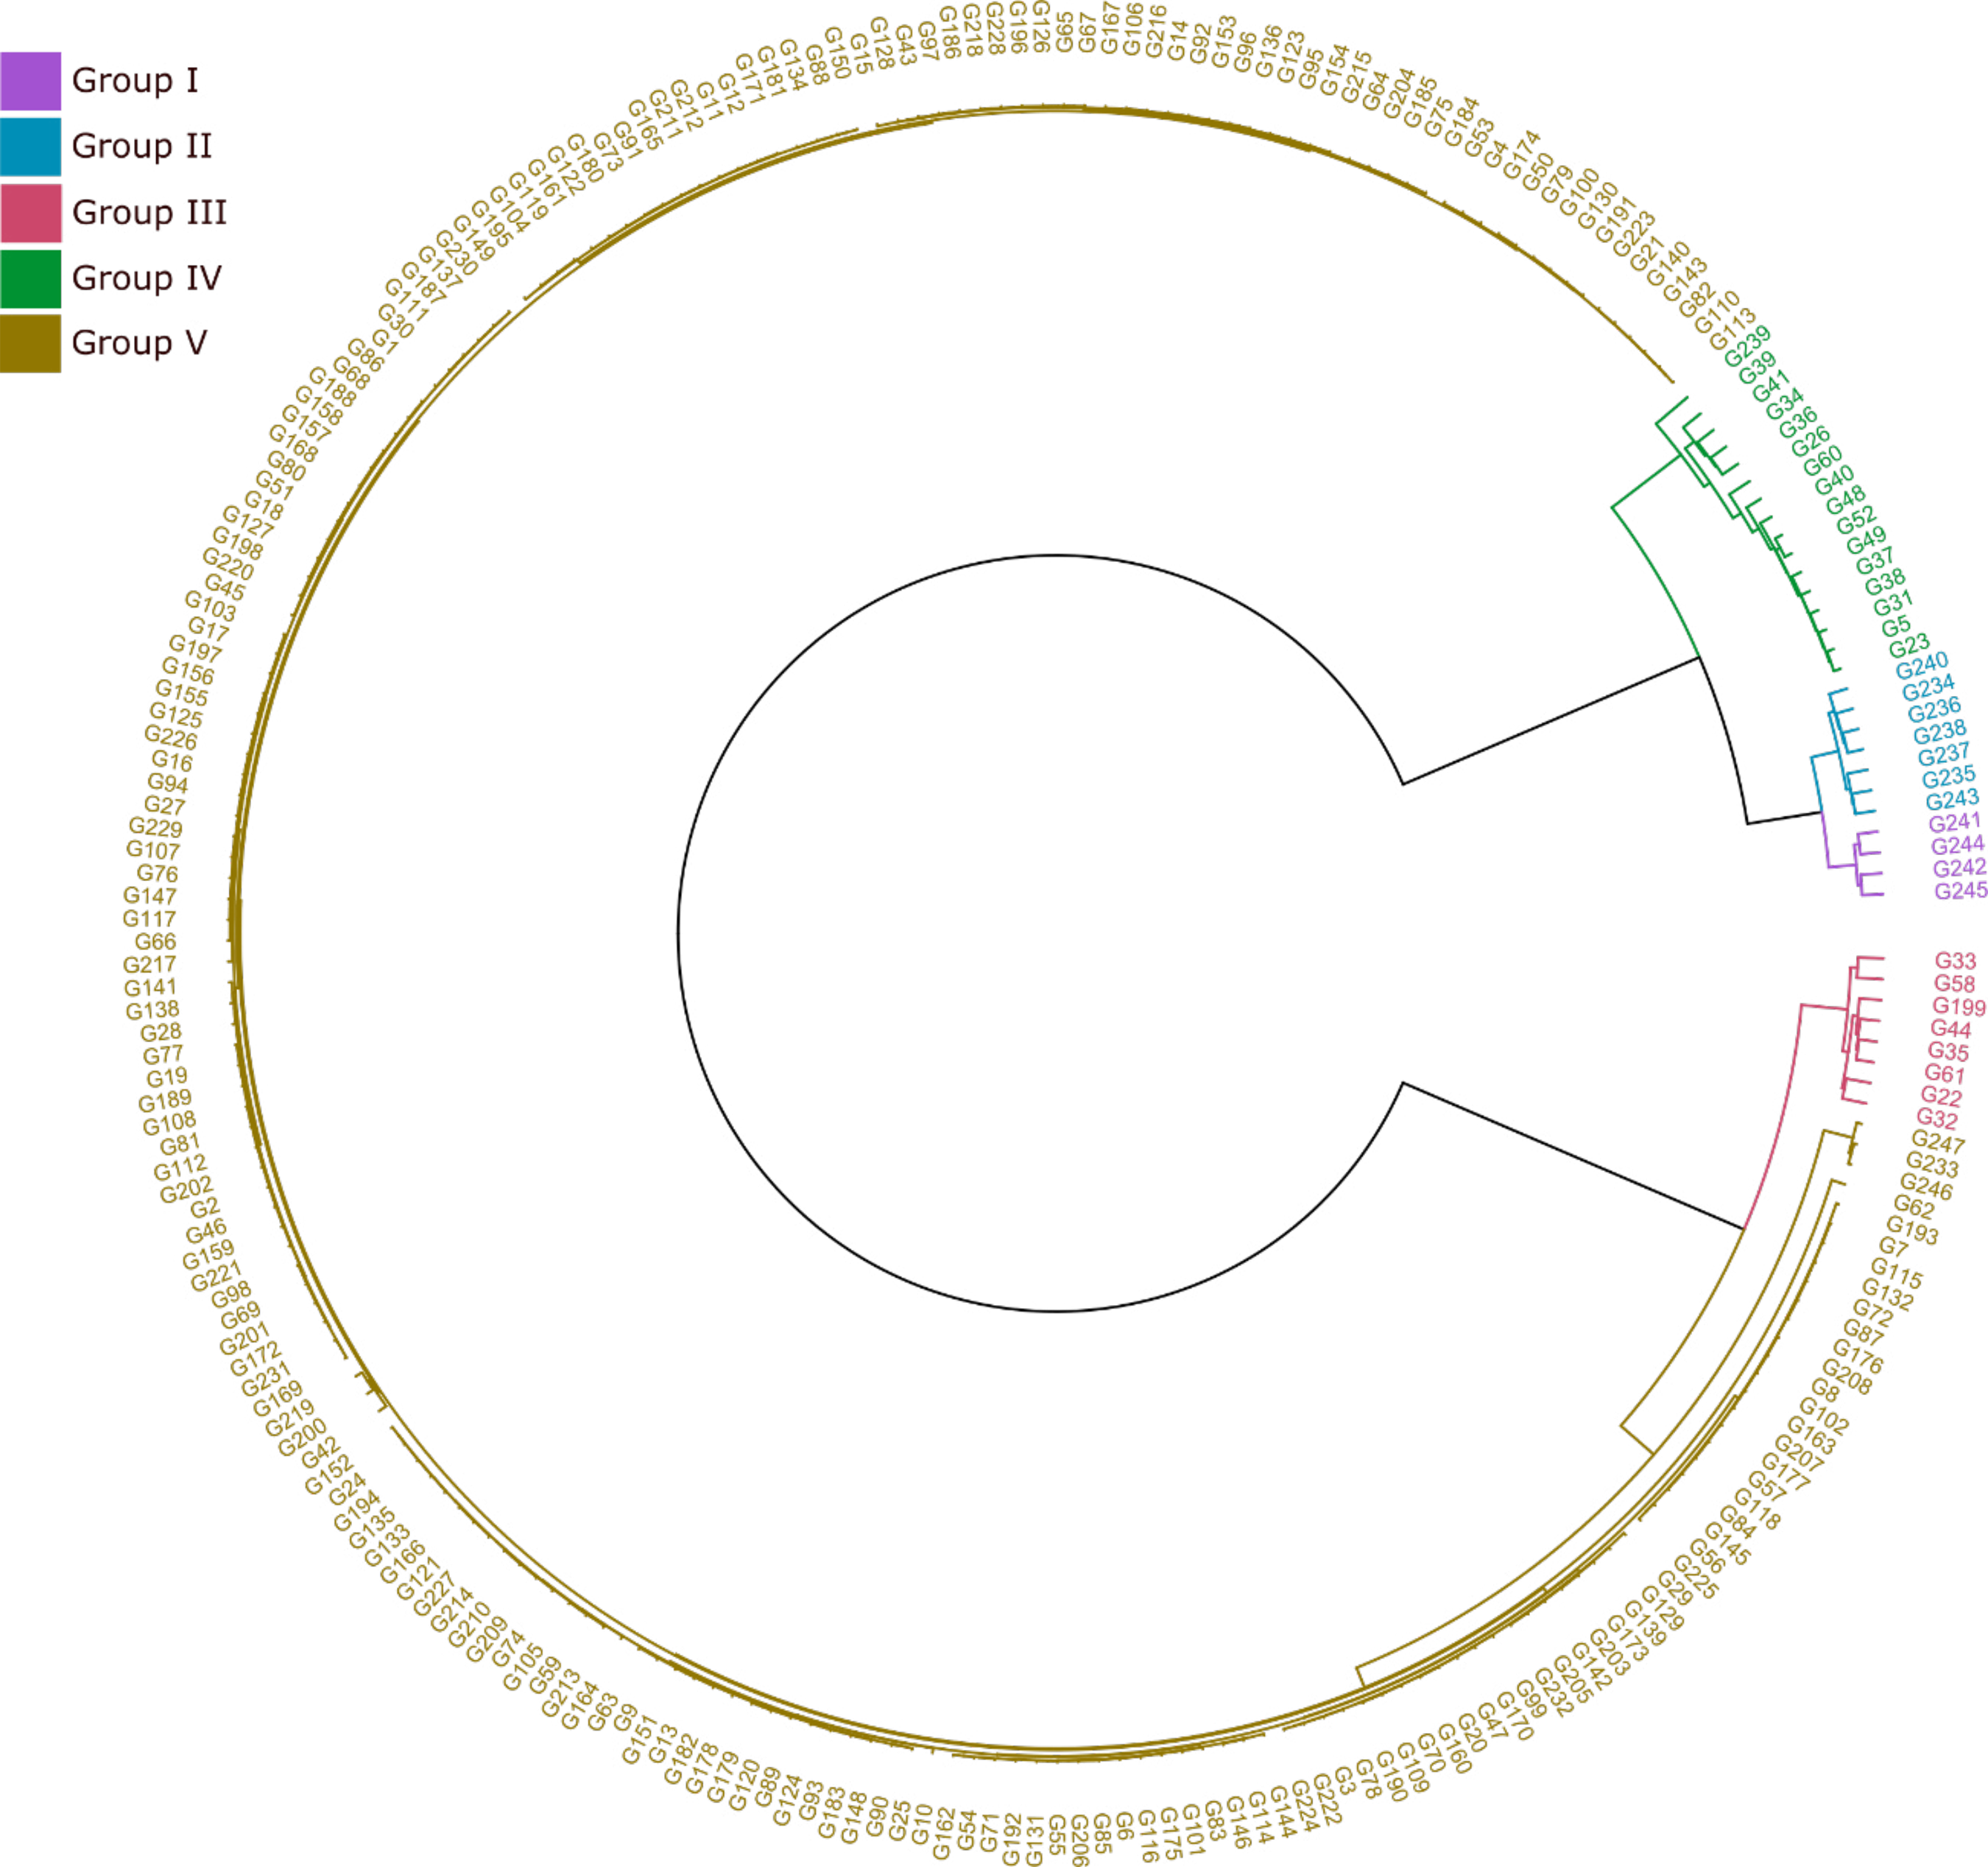
The plants were recoded to facilitate data entry into the GENES program. The list of codes is presented in Table 2. Ward’s method was applied to square the distances. By adopting the cut off technique proposed by Mojena (1977), five unique groups were identified (Fig. 4). Group I comprised genotypes G241, G242, G244, and G245, while Group II included G234, G235, G236, G237, G238, G240, and G243. Genotypes G22, G32, G33, G35, G44, G58, G61, and G199 formed Group III, and Group IV consisted of G5, G23, G26, G31, G34, G36, G37, G38, G40, G41, G48, G49, G52, G60, and G239. The remaining 212 genotypes were categorized into Group V.

Dendrogram obtained with the dissimilarity matrix of the 247 genotypes studied. The clustering method used was Ward’s D2. The groups were formed based on the cut-off point proposed by Mojena (1977) with K = 1.25.
The consolidation of over 85% of the individuals into a single group reinforces the genetic homogeneity of the population, as evidenced by genetic marker data. This aligned with Laviola et al. (2018), who also reported limited genetic diversity in the Brazilian Jatropha Curcas (Barbados nut) germplasm bank using SNP markers. However, the aim of the present study diverged by focusing on understanding population structure to enhance selection and hybridization processes in the guava breeding program.
As observed by Pierre et al. (2022), who applied SNP markers and Ward’s clustering to separate African cassava cultivars into three main clusters, this study confirmed the presence of genetic diversity and the potential for organizing genotypes into distinct genetic groups.
This insight inform the selection of individuals to maximize heterosis, as the genetic distance between groups is likely to enhance vigor and progeny performance in crosses. Thus, the molecular data analysis complements phenotypic variable assessments, suggesting a link between genetic structure and the observed traits. Excoffier’s AMOVA was carried out considering the groups formed by Ward’s methodology as hierarchical levels (Table 6).
Results of Excoffier’s analysis of molecular variance analysis for the four groups formed by Ward’s methodology using data from single nucleotide polymorphisms-type molecular markers (Excoffier et al. 1992).
The ΦST statistic of 0.8994 attested that over 89% of the variability of the studied population is attributable to differences among the groups formed by Ward’s methodology. This significant reduction in subpopulations, from 11 families to five groups, confirmed the unfeasibility of distinguishing families based on variability.
The observed discrepancy between the 11 families and the identified clusters, indicating a low correlation between familial classification and exhibited variability, may be attributed to the commercial orchard origins of these families. In contrast, studies employing larger and geographically diverse samples often revealed clusters that correlate significantly with the regional origins of the accessions (Serba et al. 2019). This observation aligned with the findings of Diaz-Garcia and Padilla-Ramírez (2023), who reported considerable genetic diversity among 48 P. guajava L. accessions sourced from 11 different Mexican states, with eight accessions from various countries including Bolivia, Brazil, Colombia, Cuba, Honduras, India, and South Africa.
It is also noteworthy that these families emerged from two selection and controlled crossing cycles, significantly narrowing the geographic distance among parental accessions, with many sharing one or two parents (Table 1).
CONCLUSION
There was no significant differentiation between the 11 families based on phenotypic or molecular data, implying that division into families does not accurately reflect the observed diversity. Nevertheless, a clear population structure was identified through UPGMA and Ward’s analyses. These results offer valuable information for the forthcoming phases of the UENF guava breeding program, highlighting the importance of considering population structure in the development of breeding strategies.
ACKNOWLEDGMENTS
To the Instituto Federal de Educação, Ciência e Tecnologia do Espírito Santo and the UENF for their support during the research.
-
How to cite: Marques, F. C. R., Viana, A. P., Costa, T. C., Silva, F. A., Silva Júnior, O. B. and Grattapaglia, D. (2025). Prospecting variability in full-sib families of Psidium guajava L. through phenotypic information and SNP markers. Bragantia, 84, e20240087. https://doi.org/10.1590/1678-4499.20240087
-
FUNDING
Not applicable.
DATA AVAILABILITY STATEMENT
The datasets analyzed during the present study are available upon request to the authors.
REFERENCES
-
Abbaszadeh, M., Sheidai, M., Koohdar, F. and Shafieizargar, A. (2023). Population and landscape genetic studies in Citrus tangerina Tanaka. Genetic Resources and Crop Evolution, 70, 2695-2711. https://doi.org/10.1007/s10722-023-01596-7
» https://doi.org/10.1007/s10722-023-01596-7 -
Ambrósio, M., Viana, A. P., Cruz, D. P., Preisigke, S. C., Cavalcante, N. R., Gonçalves Júnior, D. H., Amaral, B. D., Amaral Júnior, A. T., Santana, J. G., Crevelari, J. A., Daher, R. F. and Souza, Y. P. (2022). Categories of variables in analysis of genetic diversity in S1 progenies of Psidium guajava Scientific Reports, 12, 22367. https://doi.org/10.1038/s41598-022-26950-0
» https://doi.org/10.1038/s41598-022-26950-0 -
Angulo-López, J. E., Flores-Gallegos, A. C., Torres-León, C., Ramírez-Guzmán, K. N., Martínez, G. A. and Aguilar, C. N. (2021). Guava (Psidium guajava L.) fruit and valorization of industrialization by-products. Processes, 9(6), 1075. https://doi.org/10.3390/pr9061075
» https://doi.org/10.3390/pr9061075 -
Azevedo, A. M. (2021). MultivariateAnalysis: pacote para análise multivariada. Available at: https://cran.r-project.org/web/packages/MultivariateAnalysis/MultivariateAnalysis.pdf Accessed on: February 3, 2025.
» https://cran.r-project.org/web/packages/MultivariateAnalysis/MultivariateAnalysis.pdf -
Azzolini, M., Jacomino, A. P. and Spoto, M. H. F. (2004). Estádios de maturação e qualidade pós-colheita de goiabas “Pedro Sato” 1. Revista Brasileira de Fruticultura, 26, 29-31. https://doi.org/10.1590/S0100-29452004000100009
» https://doi.org/10.1590/S0100-29452004000100009 -
Bernardes, C. O., Tuler, A. C., Canal, D., Carvalho, M. S., Ferreira, A. and Ferreira, M. S. F. (2022). Genetic diversity and population structure of psidium species from restinga: a coastal and disturbed ecosystem of the brazilian atlantic forest. Biochemical Genetics, 60, 2503-2514. https://doi.org/10.1007/s10528-022-10222-7
» https://doi.org/10.1007/s10528-022-10222-7 -
Cruz, C. D. (2013). GENES - A software package for analysis in experimental statistics and quantitative genetics. Acta Scientiarum, 35, 271-276. https://doi.org/10.4025/actasciagron.v35i3.21251
» https://doi.org/10.4025/actasciagron.v35i3.21251 -
Cruz, C. D. (2016). Genes Software – extended and integrated with the R, Matlab and Selegen. Acta Scientiarum, 38, 547-552. https://doi.org/10.4025/actasciagron.v38i4.32629
» https://doi.org/10.4025/actasciagron.v38i4.32629 - Cruz, C. D., Ferreira, F. M. and Pessoni, L. A. (2020). Biometria aplicada ao estudo da diversidade genética (2. Ed.). Viçosa: Viçosa.
-
Diaz-Garcia, L. and Padilla-Ramírez, J. S. (2023). Development of single nucleotide polymorphism markers and genetic diversity in guava (Psidium guajava L.). Plants People Planet, 5, 58-69. https://doi.org/10.1002/ppp3.10295
» https://doi.org/10.1002/ppp3.10295 -
Excoffier, L., Smouse, P. E. and Quattro, J. M. (1992). Analysis of molecular variance inferred from metric distances among DNA haplotypes: application to human mitochondrial DNA restriction data. Genetics, 131, 479-491. https://doi.org/10.1093/genetics/131.2.479
» https://doi.org/10.1093/genetics/131.2.479 -
Feng, C., Feng, C., Lin, X., Liu, S., Li, Y., and Kang, M. (2021). A chromosome-level genome assembly provides insights into ascorbic acid accumulation and fruit softening in guava (Psidium guajava). Plant Biotechnology Journal, 19, 717-730. https://doi.org/10.1111/pbi.13498
» https://doi.org/10.1111/pbi.13498 -
Galili, T. (2015). Dendextend: An R package for visualizing, adjusting and comparing trees of hierarchical clustering. Bioinformatics, 31, 3718-3720. https://doi.org/10.1093/bioinformatics/btv428
» https://doi.org/10.1093/bioinformatics/btv428 -
Grossi, L. L., Fernandes, M., Silva, M. A., Bernardes, C. O., Tuler, A. C., Santos, P. H. D., Ferreira, A. and Ferreira, M. F. S. (2021). DArTseq-derived SNPs for the genus Psidium reveal the high diversity of native species. Tree Genetics & Genomes, 17, 23. https://doi.org/10.1007/s11295-021-01505-y
» https://doi.org/10.1007/s11295-021-01505-y -
Huang, K., Wang, T., Dunn, D. W., Zhang, P., Sun, H. and Baoguo, L. I. (2021). A generalized framework for AMOVA with multiple hierarchies and ploidies. Integrative Zoology, 16, 33-52. https://doi.org/10.1111/1749-4877.12460
» https://doi.org/10.1111/1749-4877.12460 -
[IBGE] Instituto Brasileiro de Geografia e Estatística (2023). Produção de goiaba. Brazil: IBGE. Available at: https://www.ibge.gov.br/explica/producao-agropecuaria/goiaba/br Accessed on: Mar. 16, 2023.
» https://www.ibge.gov.br/explica/producao-agropecuaria/goiaba/br -
Inglis, P. W., Castro, R. P. M., Resende, L. V. and Grattapaglia, D. (2018). Fast and inexpensive protocols for consistent extraction of high-quality DNA and RNA from challenging plant and fungal samples for high-throughput SNP genotyping and sequencing applications. PLoS One, 13, 0206085. https://doi.org/10.1371/journal.pone.0206085
» https://doi.org/10.1371/journal.pone.0206085 -
Koura, A. A., Kena, A. W., Annor, B., Adejumobi, I. I., Maina, F., Maazou, A. R., Razakou, I. B. Y. A., Attamah, P., Kusi, P., Boukar, O. and Akromah, R. (2024). DArTseq-based genome-wide SNP markers reveal limited genetic diversity and highly structured population in assembled West African cowpea germplasm. Scientific African, 23, e02065. https://doi.org/10.1016/j.sciaf.2024.e02065
» https://doi.org/10.1016/j.sciaf.2024.e02065 -
Laviola, B. G., Alves, A. A., Rosado, T. B., Bhering, L. L., Formighieri, E. F. and Peixoto, L. A. (2018). Establishment of new strategies to quantify and increase the variability in the Brazilian Jatropha genotypes. Industrial Crops and Products, 117, 216-223. https://doi.org/10.1016/j.indcrop.2018.03.003
» https://doi.org/10.1016/j.indcrop.2018.03.003 -
Mojena, R. (1977). Hierarchical grouping methods and stopping rules: an evaluation. The Computer Journal, 20, 359-363. https://doi.org/10.1093/comjnl/20.4.359
» https://doi.org/10.1093/comjnl/20.4.359 -
Paiva, C. L., Viana, A. P., Santos, E. A., Freitas, J. C. O. and Amaral Junior, A. T. (2016). Genetic gain estimated by different selection criteria in guava progenies. Bragantia, 75, 418-427. https://doi.org/10.1590/1678-4499.477
» https://doi.org/10.1590/1678-4499.477 -
Pessanha, P. G. D. O., Viana, A. P., Amaral Júnior, A. T., Souza, R. M., Teixeira M. C. and Pereira, M. G. (2011). Avaliação da diversidade genética em acessos de Psidium spp. via marcadores RAPD. Revista Brasileira de Fruticultura, 33, 129-136. https://doi.org/10.1590/S0100-29452011000100018
» https://doi.org/10.1590/S0100-29452011000100018 -
Pierre, N., Wamalwa, L. N., Muiru, W. M., Simon, B., Kanju, E., Ferguson, M. E., Ndavi, M. M. and Tumwegamire, S. (2022). Genetic diversity of local and introduced cassava germplasm in Burundi using DArTseq molecular analyses. PLoS One, 17, e0256002. https://doi.org/10.1371/journal.pone.0256002
» https://doi.org/10.1371/journal.pone.0256002 -
Quintal, S. S. R., Viana, A. P., Campos, B. M., Vivas, M. and Amaral Júnior, A. T. (2017). Selection via mixed models in segregating guava families based on yield and quality traits. Revista Brasileira de Fruticultura, 39, e-866. https://doi.org/10.1590/0100-29452017866
» https://doi.org/10.1590/0100-29452017866 -
Serba, D. D., Muleta, K. T., Amand, P., Bernardo, A., Bai, G., Perumal, R. and Bashir, E. (2019). Genetic diversity, population structure, and linkage disequilibrium of Pearl Millet. The Plant Genome, 12, 180091. https://doi.org/10.3835/plantgenome2018.11.0091
» https://doi.org/10.3835/plantgenome2018.11.0091 -
Silva, F. A., Viana, A. P., Cavalcante, N. R., Amaral Júnior, A. T. and Pereira, M. G. (2022). Strategies and practical aspects in guava (Psidium guajava L.) breeding: 12 years of experiments. Functional Plant Breeding Journal, 4, 1-12. https://doi.org/10.35418/2526-4117/v4n2a1
» https://doi.org/10.35418/2526-4117/v4n2a1 -
Silva, M. J. R., Tecchio, M. A., Domiciano, S., Leonel, S. and Balestrero, R. I. (2016). Phenology, yield and fruit quality of ‘Paluma’ guava tree at different pruning times. Ciência e Agrotecnologia, 40, 317-325. https://doi.org/10.1590/1413-70542016403033315
» https://doi.org/10.1590/1413-70542016403033315 - Singh, D. (1981). The relative importance of characters affecting genetic divergence. Indian Journal of Genetics e Plant Breeding, 41, 237-245.
-
Singh, D., Gill, M. I. S., Boora, R. S. and Arora, N. K. (2015). Genetic diversity analysis in guava (Psidium guajava) on the basis of morphological and physico-chemical traits. Indian Journal of Agricultural Sciences, 85, 678-683. https://doi.org/10.56093/ijas.v85i5.48504
» https://doi.org/10.56093/ijas.v85i5.48504 -
Thakur, S., Yadav, I. S., Jindal, M., Sharma, P. K., Dhillon, G. S., Boora, R. S., Arora, N. K., Gill, M. I. S., Chhuneja, P. and Mittal, A. (2021). Development of genome-wide functional markers using draft genome assembly of guava (Psidium guajava L.) cv. Allahabad Safeda to expedite molecular breeding. Frontiers in Plant Science, 12, 708332. https://doi.org/10.3389/fpls.2021.708332
» https://doi.org/10.3389/fpls.2021.708332 -
Wickham, H., Averick, M., Bryan, J., Chang, W., McGowan, L. D., François, R., Grolemund, G., Hayes, A., Henry, L., Hester, J., Kuhn, M., Pedersen, T. L., Miller, E., Bache, S. M., Muller, K., Ooms, J., Robinson, D., Seidel, D. P., Spinu, V., Takahashi, K., Vaughan, D., Wilke, C., Woo, K. and Yutani, H. (2019). Welcome to the Tidyverse. Journal of Open Source Software, 4, 1686. https://doi.org/10.21105/joss.01686
» https://doi.org/10.21105/joss.01686 -
Yousaf, A. A., Abbasi, K. S., Ahmad, A., Hassan, I., Sohail, A., Qayyum, A. and Akram, M. A. (2021). Physico-chemical and nutraceutical characterization of selected indigenous guava (Psidium guajava L.) cultivars. Food Science and Technology, 41, 47-58. https://doi.org/10.1590/fst.35319
» https://doi.org/10.1590/fst.35319
Edited by
-
Section Editor: Freddy Mora https://orcid.org/0000-0002-4845-3549

 FL: fruit length; PLW: placenta weight; BRIX: soluble solids content; MT: mesocarp thickness; PT: peel thickness; PROD: total production; PPW: pulp weight; FD: fruit diameter; FW: individual fruit weight; ET: endocarp thickness.