
 Exploring the Heterogeneity of Brazilian Municipalities: continuous differences of discrete types?
Abstract
Brazilian municipalities simultaneously function as local administrative units, service providers, electoral districts, and the primary units for aggregating statistical, fiscal, and demographic data. Although their heterogeneity is widely acknowledged, the underlying structure of this heterogeneity is rarely examined. In this article, we argue that this heterogeneity should be understood as discrete, rather than as continuous variations of a single territorial form, and we propose a typology to explore these differences. The typology is derived from cluster analysis of Brazilian municipalities and allows us to examine differences across these units using panel data on fiscal, demographic, and political variables from 2005 to 2024. The results identify five distinct groups of municipalities. A large majority consists of very small and poor municipalities characterized by low levels of urbanization, dependence on intergovernmental transfers, limited local state capacity, and a right-leaning political landscape. The remaining groups differ in terms of scale, urbanization, economic structure, administrative capacity, political dynamics, and revenue and expenditure patterns. This analysis suggests that Brazilian municipalities constitute intrinsically different types of units, especially in fiscal terms, raising methodological concerns about their generic use as a unit of analysis in studies of public policy, local government, federalism, and fiscal issues.
Keywords:
Municipalities; public policies; social policy; urban policy
Introduction
The municipality is the basic territorial unit of Brazil’s federation. It serves simultaneously as the country’s sole local unit of administrative authority, the primary locus for the provision of local public policies, and the electoral district for local elections. Because of its administrative role, the municipality is also the primary unit for compiling statistical, fiscal, and budgetary data in Brazil. Brazilian municipalities, however, are highly heterogeneous. This diversity is explicitly recognized and incorporated into the design of public policies, such as in the accreditation rules of the Unified Health System (SUS) and the Unified Social Assistance System (SUAS), as well as in the regulations governing mandatory, conditional, and discretionary transfers within Brazil’s system of fiscal federalism. This heterogeneity is also widely documented in scholarly research across several fields, including studies in public finance (MELO, SOUZA and BONFIM, 2015; SOUZA and MONTE, 2021), public administration and local governance (GRIN et al., 2018; MARENCO, 2017; MARENCO et al., 2017), social policy (SATYRO and CUNHA, 2018), and electoral dynamics (MARCINIUK, BUGARIN, and FERREIRA 2020), among many others. Although the Brazilian federation is formally symmetric, politics and public policy operate in markedly asymmetric ways.
However, this heterogeneity is typically conceptualized as a continuous phenomenon (greater or lesser, more or less well funded, or more or less administratively capable), which may obscure underlying discrete differences (that is, differences between types of units). In this article, we argue that Brazil’s 5,571 municipalities can be grouped into at least five categories with distinct characteristics. A large majority (nearly 80%) belongs to a specific group – small, poor, and with limited administrative capacity – while the remainder is divided into types with distinct profiles, each encompassing between 03% and 08% of municipalities. An analytical approach that treats Brazil’s local-level heterogeneity in discrete terms, that is, as distinct types of units, may therefore offer a more informative perspective.
In this article, we develop a typology based on socioeconomic data, characterize these types in terms of local capacities and political dynamics, and analyze fiscal inequalities across the groups in terms of revenues and expenditures. The typology itself is constructed using data from 2022 only, whereas the characterization of the types is based on a cluster analysis that draws on demographic, political, administrative capacity, and fiscal data from 2005 to 2024, resulting in a panel of 102,800 municipality-year observations. The typology serves primarily argumentative and methodological purposes and is not intended to function as a general reference for other studies, since the classification of a municipality into one of the types necessarily depends on the set of variables included in the clustering procedure.
This article does not propose political reform or a revision of how territories are structured within Brazil’s symmetrical federal system, nor does it advocate the merger or elimination of municipalities, the reduction of mayoral offices, or similar measures. Our point of departure is that we rarely examine the underlying structure of this heterogeneity. Our argument, in turn, is that if we stop treating this heterogeneity as a continuous phenomenon, we can achieve much greater analytical clarity, particularly with respect to socioeconomic and fiscal dimensions.
The article is organized into five sections, in addition to this introduction and the concluding remarks. The first section reviews the literature on municipal heterogeneity in Brazil, particularly from a fiscal perspective. The second briefly addresses the complexity of defining Brazilian municipalities as a single type of unit, in light of alternative approaches used in other countries. The third section presents the methodological choices underlying the construction of our typology, while the fourth characterizes the types along socioeconomic, local government, and political dimensions. The fifth section analyzes the fiscal characteristics of these types, suggesting that, rather than mere heterogeneity, Brazilian municipalities constitute territorial units of a distinct nature. The concluding remarks summarize the evidence presented.
The literature on municipal heterogeneity in Brazil
The heterogeneity of Brazilian municipalities is widely acknowledged. For some scholars, however, it constitutes a phenomenon to be systematically mapped and explained, while for others it functions primarily as contextual information. A first broad set of studies has sought to document variation among Brazilian municipalities across fiscal, political, and administrative dimensions, in addition to their sociodemographic characteristics.
Afonso and Escovedo (2021) use the FIRJAN Fiscal Management Index as a measure alongside cluster analysis as a technique to argue that municipalities are more homogeneous than typically assumed and highly vulnerable in terms of fiscal management. Melo, Souza and Bonfim (2015) examine the heterogeneity of local fiscal capacity in 2010 using the FIRJAN index, finding substantial variation explained by the degree of electoral competition and participation, as well as by the educational level of municipal employees. Similarly, Silva et al. (2020) seek to explain the determinants of fiscal management – measured using FIRJAN indices for 2013 and 2016 – and conclude that wealth (measured by GDP per capita), the Municipal Governance Index (IGM), and Brazil’s macroregions help explain fiscal management outcomes. Mendes et al. (2018) examine correlations between human development, local economic profiles, revenue and expenditure capacity, and intergovernmental transfers. Their study suggests that higher levels of development are found in municipalities with more industrial economic profiles, as well as in more agriculture-oriented municipalities, and in those receiving greater volumes of intergovernmental transfers. Municipalities with a service-sector profile (which may reflect the relative weakness of other sectors) are negatively associated with development.
Still focusing on the determinants of municipal expenditure, Souza and Monte (2021) analyze the finances of all Brazilian municipalities between 2000 and 2016, arguing that fiscal decentralization (measured through intergovernmental transfers) positively affects both personnel and investment expenditures. They also show that own-source tax revenues tend to increase administrative expenditure, but not social expenditure. Marenco and Cate (2021) examine local budgetary decisions across all Brazilian municipalities between 2013 and 2016. Their study distinguishes between earmarked and discretionary expenditures and finds substantial heterogeneity, driven primarily by the inertial dynamics of past expenditures rather than by demographic, political, or administrative capacity variables.
Also examining municipal heterogeneity, but focusing on the presence of municipal transparency mechanisms, Baldissera et al. (2020) show that larger and wealthier municipalities disclose more information publicly. In another study addressing a relatively underexplored topic, Satyro and Cunha (2018) analyze heterogeneity in the provision of welfare services. Their findings suggest that the universe of Brazilian municipalities encompasses distinct welfare regimes. Using factor and cluster analysis, and considering policies related to social insurance and social assistance, education, and health, the authors identify types of social protection such as assistance-based, quasi-assistance, corporatist, quasi-corporatist, family-based insurance, and intermediate regimes.
Another extensive and productive research agenda examines the relationships among elections, fiscal outcomes, and local public policy. In this literature, heterogeneity typically appears as a contextual factor to be controlled for. Marciniuk, Bugarin and Ferreira (2020) study the effect of political alignment between mayors and members of the lower house of Congress on the distribution of discretionary transfers between 2001 and 2012, measured through federal grant agreements (‘convênios’). Their findings confirm the importance of political alignment and show that first-term mayors tend to receive larger transfer volumes.
Peixoto et al. (2016) examine how municipal context, candidate profiles, and administrative performance relate to reelection prospects in Brazil in 2016, suggesting that the first set of factors is more influential than the second. Teixeira and Mattos (2021) test the effects of political competition on the allocation of municipal expenditure in Brazil between 2004 and 2016, arguing that the effect of the level of competition has declined and that municipalities with more competitive elections reduced expenditure in election years. Gralak et al. (2023) conduct a panel study of the 35 municipalities with populations above 500,000 between 2005 and 2016, testing whether expenditure increases in election years. Contrary to earlier studies, their findings find no evidence of political budget cycles.
Several studies devote attention to the determinants of federal transfers, which may help equalize an important dimension of municipal heterogeneity. Andrade and Caldas (2025) test explanations for voluntary federal transfers between 2010 and 2021, arguing that partisan alignment between the president and the mayor positively affects transfers, as does municipal GDP per capita, while other socioeconomic indicators show no statistically significant effects. Baião et al. (2017) analyze the potential equalizing effects of transfers on municipal finances, given the substantial heterogeneity among Brazil’s municipalities. Their results for 2010 counterintuitively suggest that mandatory transfers (FPM) have limited equalizing effects, whereas conditional transfers such as FUNDEB – and even resources from programs such as ‘Bolsa Família’ – have positive effects. Finally, Cate (2023) seeks to explain the determinants of municipal access to parliamentary amendments between 2015 and 2019, prior to the recent sharp increase in their use. The study finds that low revenue-raising capacity, low electoral competition, and political alignment between the mayor and the legislator increase the likelihood of receiving such amendments. With regard to the effects of amendments on expenditures, the article tests whether larger allocations to education, health, and urban development increase local expenditure in these policy areas and improve reelection prospects, but finds mixed and inconclusive results across policy areas.
Finally, another set of studies examines municipal heterogeneity by investigating both its determinants and its consequences. In a highly influential study, Marenco et al. (2017) analyze the influence of local state capacity on fiscal capacity, measured by municipalities’ ability to raise own-source revenues, using data from 2008 to 2012. Their results suggest that professional bureaucracies – measured by the proportion of tenured employees with a university degree – positively affect the ability to collect local property taxes. In a complementary study, Marenco (2017) examines the effects of professional bureaucracies in Brazilian municipalities on the adoption of land-use regulation policies, as well as related policy instruments and urban policy councils, finding positive effects based on data from the 2012 Municipal Basic Information Survey (MUNIC).
In another influential line of research, Grin and Abrucio (2018) examine the relationship between decentralization and the modernization of local state capacities during Brazil’s recent democratic period. The authors ask whether the capacities developed have been sufficient to meet the challenges created by decentralization, considering dimensions such as financial management, administrative organization, personnel management, and information technology. Their findings point to insufficient progress, particularly among municipalities with populations below 50,000 inhabitants.
Pursuing the same research agenda, Grin et al. (2018) test the correlation between municipal fiscal capacity (measured by the proportion of own-source revenues) and state capacity dimensions (administrative, technical, institutional, and political), measuring the former in 2015 and the latter between 2012 and 2015. The results strongly suggest a positive effect of these capacities, although they are not entirely consistent, with some variables indicating effects in the opposite direction. It is worth noting that the study relies on variables from the Municipal Basic Information Survey (MUNIC), whose self-reporting by municipalities may affect measurement reliability, which may explain why not all results converge in the same direction.
In a complementary study, Cardoso and Marenco (2020) examine, through multiple specifications, the effects of the presence, number, and qualifications of political appointees on fiscal performance (GDP per capita and the FIRJAN indices), also considering regional and spatial effects. Their results are inconclusive, showing positive effects for municipal wealth (GDP per capita) but negative effects for indicators of local fiscal management.
Subnational government formats in comparative perspective
But must all territorial units be treated as equivalent? Brazil is a symmetrical federation, yet adopting a particular institutional format for government does not necessarily require treating territorial units as isomorphic for the purposes of policy design and analysis. Whereas in Brazil the political, administrative, conceptual, and statistical units of analysis all overlap, creating considerable potential for analytical confusion, other countries adopt different institutional arrangements. We discuss this issue from a comparative perspective and then summarize how Brazilian institutions address municipalities and their heterogeneity, particularly in fiscal matters.
The issue involves several dimensions related to how territorial units are classified (and often naturalized), affecting the definition of local units (in Brazil, municipalities), what constitutes a city, urban areas, and the territorial structures and transitional spaces between rural and urban areas. The issue does not lie in the definitions themselves, but in their appropriate use. Like any concept, when applied outside the context in which it was developed, it requires specific analytical care.
Many countries use criteria different from Brazil’s to define their territorial units, although the Brazilian case is by no means unique. Portugal’s territorial classification, for example, distinguishes between villages, towns, local centers, and cities. In a 2018 survey covering 233 countries1, the United Nations found that 119 use combined criteria to define cities, while 104 rely on a single criterion. Among the latter, 59 countries use purely administrative criteria (as in Brazil), 37 rely exclusively on population thresholds, and 08 use only urban characteristics.
Defining urban areas is typically far more complex. A total of 121 countries distinguish between urban and rural areas by combining administrative criteria with other dimensions, while 108 combine population size and density with additional criteria, 69 combine urban characteristics with other criteria, and 38 incorporate economic dimensions alongside other classification criteria.
To illustrate what combining criteria may involve, in India agglomerations are classified as urban only when they have a population exceeding 5,000 inhabitants, at least 75% of their economically active population is employed in non-agricultural occupations, and a population density above 400 inhabitants per square kilometer. Agglomerations with populations above 100,000 inhabitants are designated as cities, while those below that threshold are classified as towns.
Forms of local government also vary substantially across countries (MOURITZEN and SVARA, 2002). In some cases, local government institutions vary internally even when the institutional structure of local territorial units is standardized, as in the United States2 and, until recently, in northern Germany and the Nordic countries (GOLDSMITH and LARSEN, 2004).
Brazil, by contrast, has adopted a fully standardized territorial structure centered on a single geographic unit – the municipality – as well as a standardized form of local government, at least since 19383. This standardization is based on political-administrative criteria, with municipalities functioning as the basic administrative units of local government. The existence of a City Hall defines a city, while an urban locality that hosts a district is classified as a village (‘vila’)4. Municipalities also serve as the smallest units for the redistribution of fiscal resources and as the single electoral district for local elections.
In practice, the definition of a municipality is political and legal in nature, as it involves legislative approval of municipal emancipation and is tied to the definition of the administrative seat where the municipal government is located. Following the promulgation of the 1988 Constitution, which established the rules for creating municipalities, a major wave of municipal creation occurred, producing nearly 1,450 new municipalities in just twelve years (TOMIO, 2002). Along with these new political-administrative units, an equivalent number of fiscal and statistical units were automatically created, as well as an equivalent number of cities (administrative seats). Brazil’s municipalities therefore include a substantial number of units that attained this status through political dynamics rather than through their underlying social, territorial, or economic characteristics.
Urban areas are defined by municipal administrations through local legislation. This arrangement may appear desirable from the standpoint of democratic governance and local knowledge, since such decisions rest with local residents and draw on detailed information and lived experience. However, because urban properties are subject to a municipal property tax (IPTU), while rural properties are subject to a federal land tax (ITR), local governments have incentives to expand urban areas artificially or prematurely (VEIGA, 2008). This practice dates back to the creation of the ‘décima urbana’, a property tax introduced in 1808 within urban perimeters (GLEZER, 2007). This historical legacy introduces an additional source of institutional artificiality into current definitions.
Traditionally, the Brazilian Institute of Geography and Statistics (IBGE) defines urban areas as ‘territories characterized by buildings, street networks, and dense human occupation’. This definition does not specify the scale of agglomerations and refers to density in a very imprecise way, simply equating it with the presence of human occupation. In addition, it establishes no minimum threshold in terms of population size or land area. As a result, for many decades this approach produced a purely dichotomous classification between rural and urban areas, which does not capture transitional forms.
For classifying urbanization, across the territory, more sophisticated strategies have been developed recently. The European Union, for example, uses levels of settlement density – the Degree of Urbanization (DEGURBA)5 – which enables a systematic differentiation of population and economic agglomerations across the territory.
In an attempt to mitigate the limitations of broad, generalized definitions, the Brazilian Institute of Geography and Statistics (IBGE) commonly relies on population size categories and has also developed more sophisticated approaches in specific studies. Among these, the analytical typology developed in the REGIC study (IBGE, 2018), based on the position and hierarchy of the urban network, is particularly noteworthy, classifying municipalities into eleven categories6. Another important recent study classifies territories according to the characteristics of their intra-municipal census tracts (IBGE, 2022), along urban, rural, and natural dimensions across the country, resulting in sixteen types.
These classifications offer clear analytical advantages, but thus far their impact has been largely confined to specific thematic debates. They have had little influence on discussions of federalism, local government, and local public finance in Brazil, which remain strongly shaped by the assumption of a homogeneous classification of municipalities.
In sum, the definition of municipalities in Brazil – the unit of analysis in studies of local government – has an administrative origin and automatically defines cities, while the delimitation of urban areas is susceptible to pressures arising from local fiscal incentives. Although Brazil is not unique in this regard, the use of a single, unified administrative, electoral, fiscal, and statistical unit tends to induce interpretations of homogeneity – or of continuous heterogeneity – in a context characterized by a far more complex empirical reality.
Methodological choices: structuring heterogeneity
To analyze municipalities, we constructed a typology in three sequential stages. The first stage consisted of a k-means cluster analysis of municipalities in 2022, the year of the population census. The analysis included the following variables: population size and the share of the population living in urban areas (both for 2022); the share of urbanized territory; value added per capita in agriculture, industry, services, and the public sector (all for 2021); the share of the population classified as vulnerable in 20107; and GDP per capita in 2021. The analysis covered 5,201 municipalities for which data were available.
We tested several cluster solutions and obtained the best fit with eight groups. However, several clusters contained very few cases, largely reflecting the influence of the largest and most developed municipalities. The results were as follows:
The four clusters with very few observations (01, 05, 15, and 01 cases) included only metropolises and large municipalities and were separated primarily because of the large scale of their populations. We therefore combined them, resulting in five clusters.
In the second stage, we made several small manual adjustments based on an analysis of internal heterogeneity, examining the position of cases relative to cluster centroids and their average values across the selected indicators. First, we reassigned 85 cases from one group to form a new group. Likewise, we reassigned 433 cases from another group to form a separate group. At the end of this stage, the dataset consisted of seven groups.
We then carried out a third and final stage, comparing each group with its adjacent group in the population distribution using tests for differences in averages at the 95% significance level for all variables included in the cluster analysis. The appendix presents the detailed results of these analyses. In almost all cases, the groups differed significantly across all variables or at least one of the indicators. Two pairs of groups, however, differed significantly only in terms of population, and we therefore merged each pair of groups. The final solution thus consisted of five groups, which we reordered in ascending order of population size.
Table 02 below presents the population distribution and average values for the characteristics of each group. As shown, the first group includes 176 municipalities with much larger populations (median of 310,000 inhabitants), higher levels of urbanization (77% of the population and 34% of the territory), lower levels of vulnerability, and a very strong service sector (57%), resulting in high GDP per capita.
The second group includes medium-sized municipalities (median population of 110,000), with a strong presence of services and industry (49% and 22%, respectively). The third group comprises 433 small-to-mid-sized municipalities (median population of 45,000), which are somewhat less urbanized, more rural, and economically less concentrated in industry and services, with a somewhat larger share of agriculture (46%, 19%, and 7%, respectively).
The fourth group includes 240 very small municipalities (median population of 8,000), but with very high GDP per capita – the highest among the groups (R$130,000) – and a strong presence of agriculture and industry (39% and 24%, respectively). The final group includes the overwhelming majority of municipalities in the country, just over 4,100, with very small populations (median of 9,000 inhabitants), the lowest levels of urbanization (63% and 29% for population and territory, respectively), a very small industrial sector (6%), a notable presence of rural activities (22%), and a large public sector (30%).
As noted earlier, adjacent groups differ significantly in tests of differences in averages for almost all variables considered individually (see the methodological appendix for the full results).
Based on the characteristics outlined above, we label the groups as follows:
-
Metropolises and large cities
-
Medium-sized municipalities
-
Small-to-mid-sized municipalities
-
Small, dynamic municipalities
-
Small, poor municipalities
The heterogeneity of Brazilian municipalities reflects variation, but is primarily characterized by a pronounced concentration in a very large group of municipalities that are both very small and economically less dynamic (78.8%). The remaining municipalities fall into two groups with distinct sizes and characteristics (3.4% in metropolises and large cities, and 4.6% in small, dynamic municipalities) and two additional groups that differ more gradually (3.9% in medium-sized municipalities and 8.3% in small-to-mid-sized municipalities). In population terms, however, the distribution is highly concentrated in metropolises and large cities, which account for 48.3% of the population in 2022. These are followed by small, and poor municipalities (26.3%), medium-sized municipalities (12.4%), small-to-mid-sized municipalities (10.7%), and small, dynamic municipalities (just 2.3%).
A cross-tabulation of these groups with the 11 REGIC categories defined by the IBGE in 2018 shows that metropolises and large cities correspond to what the IBGE classifies as ‘Large National Metropolis’, ‘National Metropolis’, and ‘Regional Capital A’, ‘Regional Capital B’, and ‘Regional Capital C’. Medium-sized municipalities correspond primarily to ‘Sub-regional Center A’, but also include ‘Sub-regional Center B’, while small-to-mid-sized municipalities encompass ‘Sub-regional Center B’ and ‘Zone Center A’. Small municipalities with dynamic economies appear in the REGIC classification mainly as ‘Local Centers’, as do small, poor municipalities, although the latter also include, to a lesser extent, ‘Zone Center B’. The methodological appendix provides a detailed cross-tabulation of the two classifications.
How are our municipalities, in terms of capacities and politics
To characterize the municipal types identified above, this section analyzes their average profiles in terms of local state capacity and political dynamics. The analysis draws on a dataset compiled by the Center for Metropolitan Studies (CEM) that integrates demographic, political, local state capacity, and fiscal variables for Brazilian municipalities from 2005 to 2024, totaling 102,800 municipality-year observations.
Drawing on data from the Brazilian Institute of Geography and Statistics’ Municipal Basic Information Survey (MUNIC), we can gain insights into the administrative dimension of local state capacity, particularly with regard to the presence of agencies, policy instruments, councils, funds, and intermunicipal consortia, as well as the qualifications of municipal personnel.
However, this source has an important limitation, as it does not provide a consistent time series, since the survey collects different information across years. We therefore focus on the 2015–2018 period, which provides the most comprehensive coverage. For each category, we construct an index that takes the value ‘01’ when a given institution is present and 0 otherwise. For instance, the 2017 MUNIC includes information on the existence of housing and environmental agencies; municipalities are assigned a value of ‘02’ if both are present, ‘01’ if only one is present, and ‘0’ if neither is present.
Table 03 reports the average values for these indicators. We also include data from the MUNIC on the share of employees in direct municipal public administration holding a college degree in 2018, as well as the average score on the FIRJAN Fiscal Management Index.
As Table 03 shows, the presence of agencies, instruments, councils and funds, as well as the share of staff with a college degree, declines sharply across municipal types as we move down the table. The median values for small, poor municipalities are roughly one-third of those observed for metropolises. The only dimension that remains relatively stable is the presence of intermunicipal consortia. The FIRJAN Fiscal Management Index shows higher values in both metropolises and small, dynamic municipalities, pointing to stronger local fiscal capacity, consistent with findings in the literature (MELO, SOUZA and BONFIM, 2015; SILVA et al., 2020). This pattern is expected, to some extent, and reflects the increasing complexity of municipal administrations and urban challenges as the municipal scale grows. At the same time, the presence of local state capacity is a necessary condition for effective governance, the efficient implementation of public policies, and the sound use of available financial resources. In this context, the limited capacity of small municipalities contrasts with the relatively high levels of resources they receive, as discussed in the next section. Taken together, these patterns point to important dynamics of circular causality, as noted by Marenco (2017), Marenco and Cate (2021), and Grin et al. (2018).
We also examine how municipal types differ along political and electoral dimensions. Previous research has documented a pronounced rightward shift in electoral outcomes across Brazilian municipalities between 1994 and 2018 (POWER and RODRIGUES-SILVEIRA, 2019). We evaluate this pattern along three dimensions: the ideological orientation of mayors, the competitiveness of local elections, and electoral mobilization capacity. For each municipality-year, we compute an index of mayoral ideology following Zucco and Power (2024). We assign to each local party the national-level ideological position identified in that study, based on legislators’ responses to surveys on substantive policy issues. The index ranges from ‘−01’ to ‘01’, with lower values indicating more left-leaning positions and higher values indicating more right-leaning ones; ‘zero’ corresponds to the ideological center.
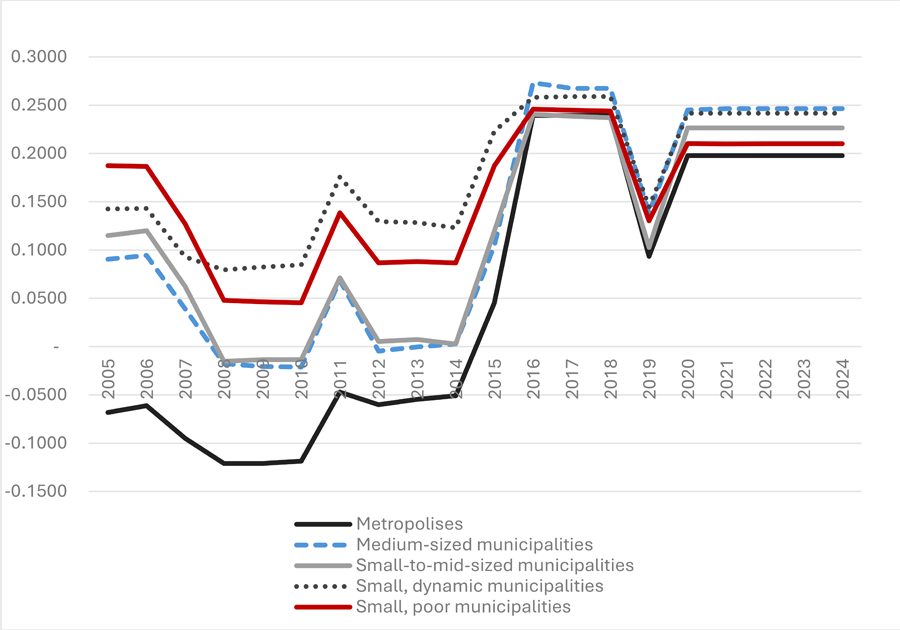
For the country as a whole, between 2005 and 2022, the overall average across Brazilian municipalities was 0.146, thus indicating a right-leaning orientation, although this pattern varied over time. The average over the period was 0.039 for metropolises, 0.116 for medium-sized municipalities, 0.113 for small-to-mid-sized municipalities, 0.172 for small, dynamic municipalities, and 0.155 for small, poor municipalities. Thus, while all municipal types are, on average, to the right of the political spectrum, right-leaning orientations are less pronounced in larger and more central urban areas. The temporal dynamics are particularly striking, as shown below.
As Graph 01 shows, small, poor municipalities and small, dynamic municipalities consistently have positive values (i.e., are predominantly governed by the right), whereas small-to-mid-sized municipalities and medium-sized municipalities show lower values up to 2014, falling into negative territory between 2008 and 2010 (i.e., predominantly governed by the left). Metropolises lie further below, remaining negative throughout the 2005–2014 period. After 2015, values for metropolises and medium-sized municipalities increase markedly and converge toward those of smaller municipalities, indicating a substantial rightward shift in municipal governments overall, consistent with the national political context following the impeachment of Dilma Rousseff. From 2015 onward, all municipal types become very similar in terms of the ideology of their mayors, with values clustered on the right.

The graph thus confirms earlier findings of a general predominance of right-leaning mayors and underscores the influence of national political dynamics on local electoral outcomes (POWER and RODRIGUES-SILVEIRA, 2019). At the same time, it shows that voting patterns vary across municipal types: prior to 2015, the left was dominant in larger and more central urban areas, even when national averages pointed in the opposite direction.
Another electoral indicator that sheds light on differences across these territorial units is the margin of victory in local elections. Across the five elections held between 2006 and 2022, the average first-round vote share of the winning candidate was 56.6% in small, poor municipalities and 57.1% in small, dynamic municipalities, compared to 50% in metropolises and 53% in the two intermediate groups. These differences are statistically significant at the 95% level in tests of differences in averages. Overall, this pattern indicates that smaller and less central municipalities tend to have less competitive local elections.
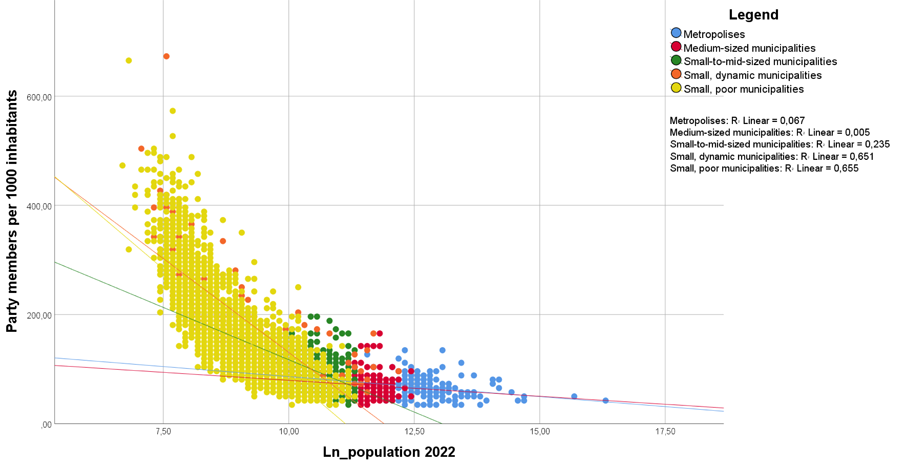
A final indicator that local politics is structured differently is party membership. Brazil has a national average of 78 party members per 1,000 inhabitants, or roughly one for every 13 residents – a notably high figure8. This suggests that the indicator is less a measure of active party life than of the presence of grassroots electoral mobilization structures, the so-called electoral machines.
Membership rates are substantially higher in smaller municipalities: 65.9 per 1,000 inhabitants in metropolises, 69.7 in medium-sized municipalities, 89.7 in small-to-mid-sized municipalities, and a striking 186.9 in small, dynamic municipalities and 157.9 in small, poor municipalities. In fact, in several hundred municipalities, rates reach as high as 670 party members per 1,000 inhabitants, effectively encompassing the entire adult (voting-age) population.
This pattern points to the need for further research on the dynamics of party membership, although such an inquiry lies beyond the scope of this article. For present purposes, it is sufficient to note the substantial and systematic differences in membership rates across municipal types, as well as the clear break between the first three groups and the smaller municipalities. Thus, membership rates are positively and significantly associated with more rural settings, lower levels of urbanization, and places where right-leaning parties perform better. The graph below shows a highly consistent distribution across types, clearly separating the first three groups from the latter. It also includes estimates of the relationship between party membership rates and the natural logarithm of population. As the figure shows, the smaller the population, the higher the estimated coefficient.
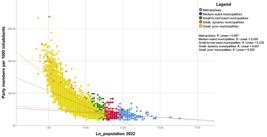
Thus, local politics in smaller and less central municipalities tends to be more clearly dominated by the right, with lower electoral competition and a more prevalent presence of electoral machines. In contrast, larger and more central municipalities show a slight predominance of the left at the beginning of the period, before converging with the others toward right-leaning dominance in the last decade.
What difference does this make? Fiscal dimension across municipal types
Revenues
Municipal revenues in Brazil reflect key features of the country’s fiscal federalism, grounded in 01. the division of taxing authority and 02. the sharing of intergovernmental transfers – constitutional, legal or statutory, and discretionary. Together, these components account for roughly 95% of local revenues, commonly referred to as current revenues. Moreover, capital revenues, such as borrowing and capital transfers, have played a smaller but increasingly important role in recent years.
In Brazil, municipal taxing authority rests primarily on the collection of the property tax (IPTU) and the services tax (ISS). Another major source of revenue – especially for medium-sized and smaller municipalities – is constitutionally mandated intergovernmental transfers, which vary depending on whether they originate from state or federal governments and on municipal characteristics.
At the state level, municipalities receive a fixed share (25%) of ICMS tax revenues and (50%) of IPVA tax revenues. The importance of these transfers depends largely on whether the municipality has an economic structure that generates consumption and vehicle registrations. In addition, ICMS allocations have increasingly incorporated other criteria, such as performance in education, environmental management, and health (PERES et al., 2022).
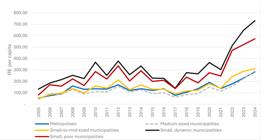
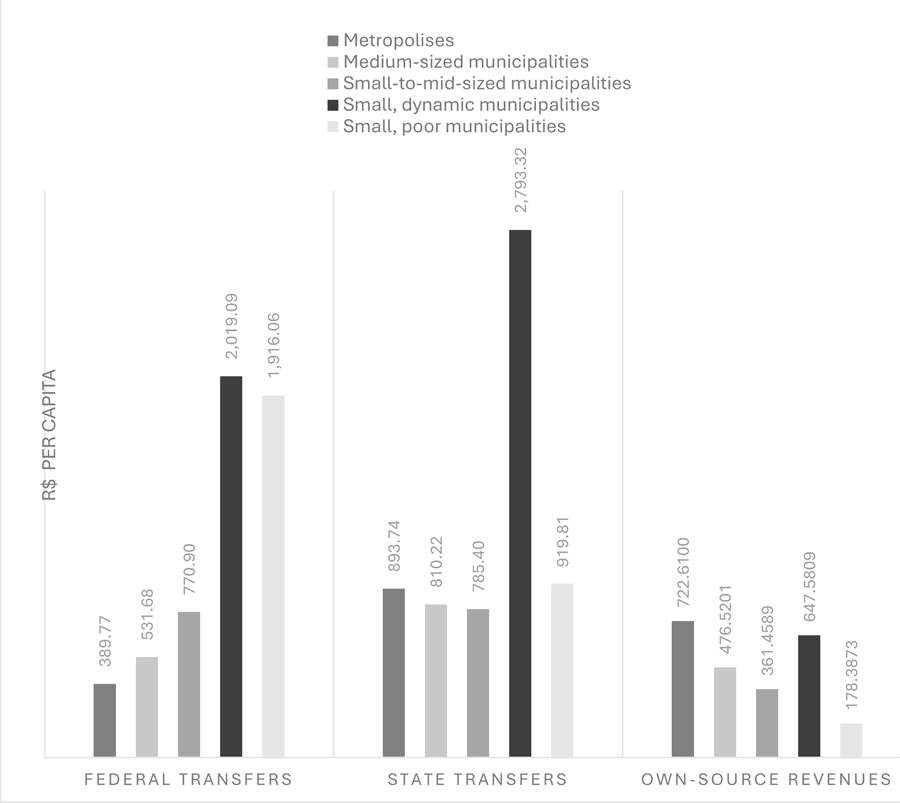
Graph 03 reports average annual revenues by municipal type, presenting per capita values for transfers from the Municipal Participation Fund (FPM) and FUNDEB, state transfers, own-source revenues (IPTU, ITBI, and ISS), and capital revenues. As noted in the literature (ANDRADE and CALDAS, 2025; BAIÃO et al., 2017), per capita federal transfers are substantially higher in small, dynamic, and small, poor municipalities. The gap reaches roughly five times the amount received by metropolises in the case of federal transfers and three times in the case of state transfers. State transfers are also much higher in small, dynamic municipalities, likely reflecting their larger share of ICMS revenues given their economic profile. Own-source revenues are more prominent in metropolises and in small, dynamic municipalities, as expected (CARVALHO JUNIOR, 2016).

The central point is that the modestly higher level of own-source revenues falls far short of offsetting the differences in federal transfers, together with capital revenues, which strongly favor smaller and less central municipalities. Thus, while these differences are meant to compensate for fiscal disparities, their magnitude, especially in recent years, points to a significant imbalance.
Capital revenues, which effectively encompass at least two distinct sources, complemented this: parliamentary amendments and borrowing and credit operations – particularly for infrastructure projects in the latter case. In the case of borrowing, a large number of municipalities (around 3,000) either lack adequate data for assessment by the National Treasury Secretariat (STN) or fail to meet the required thresholds for liquidity, current savings, and debt levels (PELLEGRINI, 2017). As a result, access to borrowing is largely limited to state capitals and larger municipalities, which have higher own-source revenues and are typically associated with large-scale infrastructure projects.
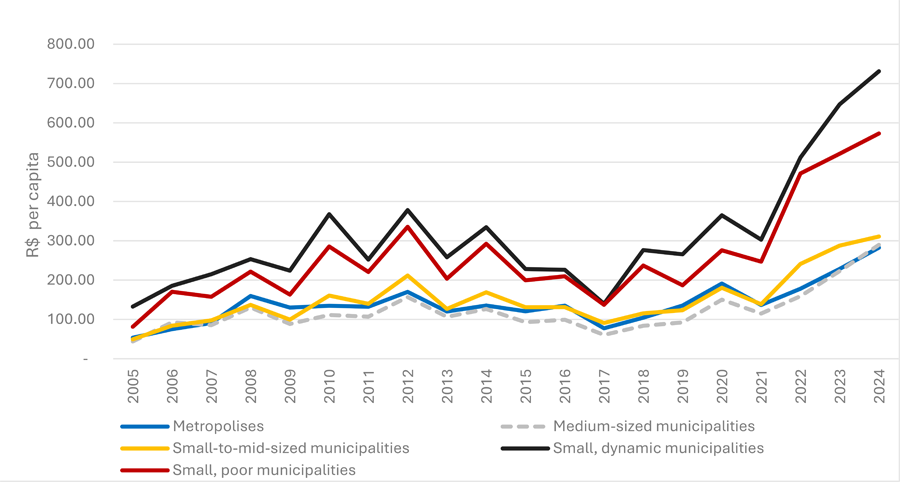
Graph 04 shows trends in capital revenues by municipal type over time. As shown, average annual per capita capital revenues are higher in smaller municipalities throughout the period and increase further after 2021, following the surge in parliamentary amendments. This article does not examine municipal needs in terms of social and urban challenges. However, because larger urban areas tend to face increasingly complex problems associated with agglomeration, there is little doubt that very small municipalities receive substantially more than would be justified in present-day Brazil, given what can reasonably be considered their actual needs.
Local expenditures
Finally, we examine expenditures comparatively across municipal types. In Brazil, municipal budget allocation is strongly shaped by institutional and federal rules that specify the policy areas municipalities must prioritize, regardless of size, region, or wealth. At the same time, allocation and spending patterns are partly constrained by local economic capacity, which can be quite limited in municipalities that depend heavily on the public sector, as discussed above.
This predetermined allocative framework operates through various forms of revenue earmarking, whether for taxes collected directly by municipalities, shared revenues from federal and state taxes, or other revenue sources tied to specific purposes. While this institutional regulation ensures the protection of policy areas recognized as fundamental by the Brazilian Constitution, such as education and health, it also limits local discretion, particularly in urban policy areas such as housing, transport, and sanitation, which lack dedicated funding sources. In this context, social policies tend to be subject to greater standardization, whereas urban policies allow for greater discretion.
Municipal expenditures in Brazil are largely determined by current revenues, as noted above. This reflects strong institutional rules that insulate certain spending areas from the annual budget allocation process (FRANT, 1996; PERES, 2007). Both education and health are financed through earmarked taxes and additional state and federal transfers, ensuring that these sectors are prioritized nationwide. As a result, increases in tax revenues translate into higher expenditures in these areas over the fiscal year; the reverse also holds, although not to the same extent.
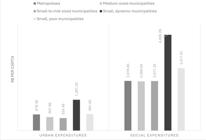
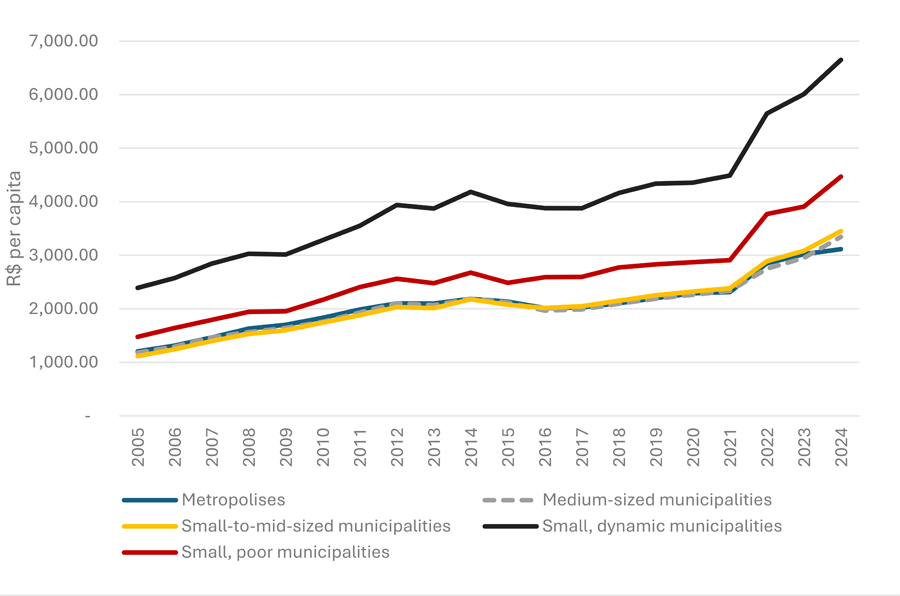
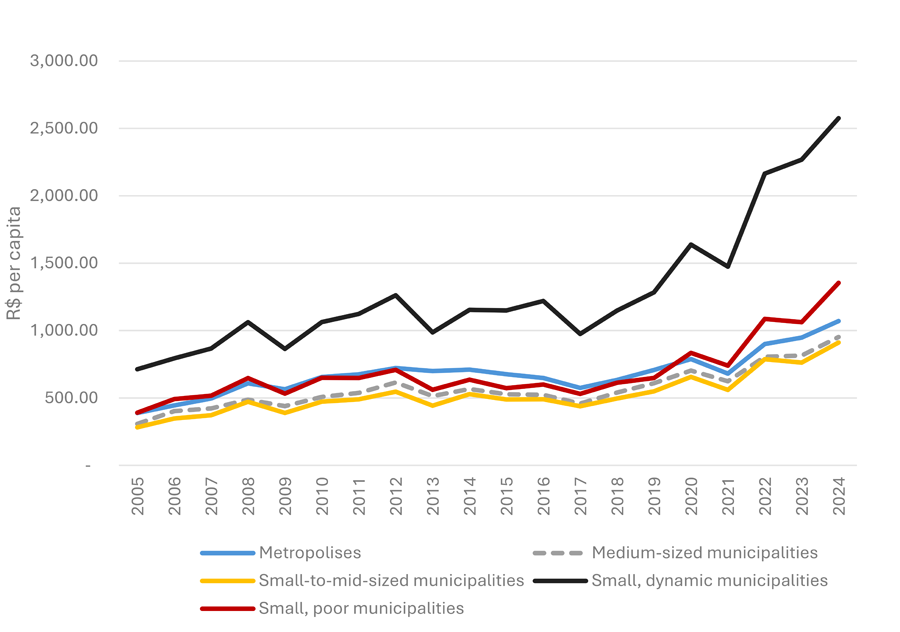
Graph 05 shows average expenditures on social and urban policies by municipal type over the period. We define social expenditures as education, health, and social assistance, while urban expenditures include urban development, housing, transport, sanitation, environmental management, and public safety. As the graph shows, social expenditures consistently exceed urban expenditures, as expected given the institutional structure of these policy areas, as discussed above.
Social expenditures can account for nearly half of municipalities’ current revenues, since 25% of taxes and tax-sharing transfers are earmarked for education and 15% for health. In addition, these policy areas receive dedicated transfers. Education is funded through federal transfers earmarked exclusively for education, such as FUNDEB and other programs administered by the National Fund for Educational Development (FNDE), while health receives transfers from both the federal government and the states to finance the Unified Health System (SUS). As a result, municipalities with limited capacity to generate own-source revenues – such as ISS and IPTU – or to access capital revenues are unlikely to have much fiscal space for additional expenditures beyond social expenditures, wages, routine services, and administrative upkeep. This scenario creates significant challenges for financing urban policies in Brazilian cities.
The graph shows that smaller municipalities have substantially higher expenditure levels than metropolises and the two medium-sized municipal types. Differences in urban expenditures are less pronounced, but small, dynamic municipalities invest more than all others, including metropolises, which certainly face more complex and costly urban challenges. Metropolises have slightly higher urban expenditures than medium-sized municipalities, but still lower urban expenditures than small, poor municipalities, which is substantively difficult to make sense of.
Although we do not examine policy needs in this study, one would expect social expenditures to increase with scale, given the concentration of more complex and costly components of social policy systems – such as hospitals and universities – in larger and more central urban areas. An even stronger argument applies to urban expenditures, since both the complexity and cost of urban policies rise with scale, even without a detailed assessment of policy needs. This pattern is only partially reflected in urban expenditures (though not for villages) and is clearly contradicted by social expenditures. The distribution shown in the table therefore suggests that larger and more central agglomerations in Brazil face greater strain and tighter resource constraints than smaller and less central ones.
However, these inequalities may vary over time, which means it is important to examine how they evolve over the period. Graphs 05 and 06 disaggregate average social and urban expenditures by municipal type. Overall, expenditures rise over time across all municipal types and expenditure categories, consistent with the growth in revenues. There is, however, a period of relative stability or slight decline between 2014 and 2018, a period that coincides with the country’s severe economic and fiscal crisis, during which Brazilian GDP fell by 6.5 percentage points (CHERNAVSKY et al., 2020), followed by a subsequent recovery. We may also observe that social expenditures (Graph 06) are consistently higher than urban expenditures (Graph 07), as reflected in the different scales on the horizontal axis – from R$ 3,000 per capita for urban expenditures to R$ 7,000 per capita for social expenditures. In recent years, all curves show a marked increase, consistent with the rise in capital revenues over the same period, likely driven by parliamentary amendments.
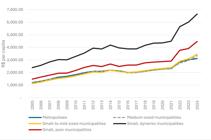
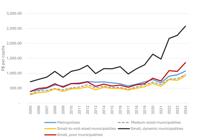
With respect to social expenditures by municipal type (Graph 06), the most striking pattern is the substantially higher level of expenditures in small, dynamic municipalities, followed by small, poor municipalities, relative to medium-sized municipalities and metropolises. This gap widens further after 2015. The growing distance between the curves is consistent with the greater resilience of smaller municipalities’ revenues during the economic crisis, although it also further exacerbates existing inequalities.
Turning to urban expenditures (Graph 07), small, dynamic municipalities again stand out, while small, poor municipalities only begin to stand out from medium-sized municipalities and metropolises after 2021, following the recent expansion, likely driven by federal parliamentary amendments. The remaining municipal types follow broadly similar levels and trajectories over time.
As noted earlier, even without a detailed assessment of policy needs, per capita expenditures would be expected to increase with scale, both in social expenditures and especially in urban expenditures. The evidence clearly indicates a strong imbalance in favor of smaller municipalities, particularly the more dynamic ones, but also the poorer ones. Thus, disparities in municipal revenues have a substantial impact on the fiscal space available for urban expenditures. Since social expenditures are largely predetermined by both the level of own-source revenues and constitutionally or legally mandated transfers from the federal and state governments. Investment in urban policies depends on the municipality’s ability to generate own-source revenues, as well as access to capital revenues and capital transfers, while their effective use ultimately depends on political discretion and the ideology of the incumbent mayor.
Concluding remarks
Our analysis of heterogeneity across Brazilian municipalities allowed us to identify distinct municipal types in the country. Population size, municipal wealth, and position within the urban network are closely intertwined in Brazil. We identified five groups of municipalities that differ along demographic and territorial dimensions, with important implications for political dynamics, revenues, and expenditures.
The first group, which we labeled metropolises and large cities, includes 3.4% of municipalities but accounts for 48.3% of the population in 2022. The most common type (78.8% of municipalities) accounts for only 26.3% of the population in the same year. The two groups differ sharply: the former is highly urbanized, with a dynamic and robust economy based on services and industry Whereas the latter is characterized by low levels of urbanization, a substantial role for agriculture, and a significant presence of public services, in local economic activity, alongside lower levels of development and higher relative levels of poverty.
A small group of small, dynamic municipalities (4.6% of municipalities and 2.3% of the population) has a similar scale to this latter category, but differs markedly in its economic base, with a strong presence of both industry and agriculture and relatively high GDP per capita. Two additional groups of medium-sized and small-to-mid-sized municipalities (representing 3.9% and 12.4% of municipalities, and 8.3% and 10.7% of the population, respectively) occupy an intermediate position, with midrange values across most indicators.
We therefore identified three broad groups in terms of scale, which expand to five when other indicators are taken into account. The key implication is not simply the existence of heterogeneity – which is already widely recognized – but rather that the Brazilian municipal system is dominated by a very large group of small and relatively poor municipalities (around 80%), while the remaining 20% can be subdivided into groups with distinct characteristics.
Municipal types also exhibited distinct political patterns. Voters in smaller municipalities were consistently more right-leaning than those in metropolises, while medium-sized municipalities occupied an intermediate position. Metropolises showed a predominance of left-leaning governments for an extended period up to 2015, but all types shifted in a more right-leaning direction thereafter. The results also suggest that electoral competition tends to intensify as scale increases. In terms of local state capacity, the findings likewise revealed clear differences, with substantial inequalities favoring larger and more central agglomerations within the urban network.
The most pronounced differences, however, arise when comparing revenues and expenditures. Small municipalities rely heavily on federal transfers and, more recently, on capital revenues associated with parliamentary amendments. Metropolises receive far lower transfers and capital revenues, but generate substantially higher own-source revenues. Medium-sized municipalities generally occupy an intermediate position, though they more closely resemble metropolises and large cities. The disproportionate allocation of revenues in favor of small municipalities is not even remotely offset by own-source revenues and has been further amplified in recent years by capital revenues.
These inequalities are also reflected in expenditure patterns, both in social and urban policies. In social expenditures, small, dynamic municipalities and small, poor municipalities show consistently higher levels of expenditure throughout the period, with the former standing out most clearly. In urban expenditures, by contrast, only small, dynamic municipalities stand out, except in the most recent years. This pattern of expenditures is inconsistent with what would be expected based on policy needs, since the costs of key facilities and services in social policy tend to increase with centrality in the urban network, while expenditures on urban policies clearly rise with the scale of agglomerations.
These dimensions should be taken into account and should inform the design of public policies and intergovernmental transfers so that they adequately reflect this diversity, strengthening the autonomy and investment capacity of the different types of municipalities in the country. In addition, these territorial types should also be incorporated into empirical analyses and methodological frameworks, recognizing – and analytically exploring – that distinct processes may operate within each of them.
These findings suggest that the heterogeneity of Brazilian municipalities may be better understood as a discrete rather than merely continuous phenomenon. Brazilian federalism is formally symmetric but functionally asymmetric. While scale clearly matters, its structure exhibits both discontinuities and gradations. The implications of this structure point to inequalities that are not only unjust but also highly dysfunctional.
References
- AFONSO, Marcio and ESCOVEDO, Tatiana (2021), Clusters of Brazilian municipalities and the relationship with their fiscal management. Paper presented at XVII Brazilian Symposium on Information Systems (SBSI '21).
- ANDRADE, Rafael Resende de and CALDAS, Antônio Vinícius Silva (2025), Federalismo fiscal e transferências voluntárias da união aos municípios brasileiros. Revista Políticas Públicas & Cidades. Vol. 14, N° 01, pp. 01-16.
- BAIÃO, Alexandre Lima; CUNHA, Armando Santos Moreira da, and SOUZA, Flávio Sergio Rezende Nunes de (2017), Papel das transferências intergovernamentais na equalização fiscal dos municípios brasileiros. Revista do Serviço Público. Vol. 68, N° 03, pp. 583-610.
- BALDISSERA, Juliano Francisco; DALL'ASTA, Denis; CASAGRANDE, Luiz Fernande, and OLIVEIRA, Abdinardo Moreira Barreto de (2020), Influência dos aspectos socioeconômicos, financeiro-orçamentários e político-eleitorais na transparência dos governos locais. Revista de Administração Pública. Vol. 54, N° 02, pp. 340-359.
- CARDOSO, André Luis Rabelo and MARENCO, André (2020), Nomeações políticas nos governos municipais e performance burocrática: avaliando o desempenho. Revista de Administração Pública Vol. 54, N° 03, pp. 360-380.
- CARVALHO JÚNIOR, Pedro Humberto Bruno de (2016), A administração tributária do IPTU e seu impacto na efetivação do Estatuto da Cidade. In: O Estatuto da cidade e a Habitat III: um balanço de quize anos da política urbana no Brasil e a nova agenda urbana. Edited by COSTA, Marco Aurélio Brasília: IPEA. Pp. 2027-231.
- CATE, Lidia Ten (2023), Quem recebe e que diferença fazem: emendas orçamentárias nos municípios brasileiros pós EC 86/2015 (2015-2019). Opinião Pública. Vol. 29, N° 03, pp. 792–826.
- CHERNAVSKY, Emilio; DWECK, Ester, and TEIXEIRA, Rodrigo Alves (2020), Descontrole ou inflexão? A política fiscal do governo Dilma e a crise econômica. Economia e Sociedade. Vol. 29, N° 03, pp. 811-834.
- FRANT, Howard (1996), High-powered and low-powered incentives in the public sector. Journal of Public Administration Research and Theory. Vol. 06, N° 03, pp. 365-381.
- GLEZER, Rachel (2007), Chão de terra: e outros ensaios sobre São Paulo. São Paulo: Ed. Alameda. 188 pp..
- GOLDSMITH, Mike and LARSEN, Helge (2004), Local political leadership: nordic style. International Journal of Urban and Regional Research Vol. 28, N° 01, pp. 121-133.
- GRALAK, Alvaro José; GERIGK, Willson, and RIBEIRO, Flávio (2023), Investimentos públicos e o ciclo político orçamentário nos grandes municípios brasileiros. Revista Econômica Do Nordeste. Vol. 54, N° 01, pp. 31-48.
- GRIN, Eduardo José and ABRUCIO, Fernando Luiz (2018), Las capacidades estatales de los municipios brasileños en un contexto de descentralización de políticas. Revista Del CLAD Reforma Y Democracia Vol. 70, pp. 93-126.
- GRIN, Eduardo José; NASCIMENTO, Alex Bruno do; ABRUCIO, Fernando Luiz, and FERNANDES, Antônio Sérgio (2018), Sobre desconexões e hiatos: uma análise de capacidades estatais e finanças públicas em municípios brasileiros. Cadernos Gestão Pública e Cidadania. Vol. 23, N° 76, pp. 312-336.
-
IBGE (2024), Pesquisa de informações básicas municipais. Available at < http://www.ibge.gov.br/estatisticas/sociais/educacao/10586-pesquisa-de-informacoes-basicas-municipais.html?edicao=18195 >. Accessed on April 29, 2025.
» http://www.ibge.gov.br/estatisticas/sociais/educacao/10586-pesquisa-de-informacoes-basicas-municipais.html?edicao=18195 -
IBGE (2022), Proposta metodológica para classificação dos espaços do rural, do urbano e da natureza no Brasil. Available at < https://journals.openedition.org/confins/53955 >. Accessed on June 25, 2025.
» https://journals.openedition.org/confins/53955 -
IBGE (2018), Regiões de influência das cidades. Available at < https://www.ibge.gov.br/geociencias/cartas-e-mapas/redes-geograficas/15798-regioes-de-influencia-das-cidades.html Accessed on July 15, 2025.
» https://www.ibge.gov.br/geociencias/cartas-e-mapas/redes-geograficas/15798-regioes-de-influencia-das-cidades.html - MARCINIUK, Fernanda L.; BUGARIN, Maurício Soares, and FERREIRA, Débora Costa (2020), Motivação partidária nas transferências voluntárias da União: o papel do Legislativo Federal. Estudos Econômicos Vol. 50, N° 02, pp. 261-291.
- MARENCO, André (2017), Burocracias profissionais ampliam capacidade estatal para implementar políticas? Governos, burocratas e legislação em municípios brasileiros. Dados Vol. 60, N° 04, pp. 1025-1058.
- MARENCO, André and CATE, Lídia Ten (2021), Municípios são todos iguais? Decisões sobre gasto, orçamento e políticas públicas em governos locais. Revista de Sociologia e Política. Vol. 29, N° 77, pp. 01-23
- MARENCO, André; STROHSCHOEN, Maria Tereza Blanco, and JONER, William (2017), Capacidade estatal, burocracia e tributação nos municípios brasileiros. Revista de Sociologia e Política. Vol. 25, N° 64, pp. 03-21.
- MELO, Clóvis Alberto Vieira de; SOUZA, Saulo Santos de, and BONFIM, Washington Luís de Souza. (2015). Federalismo e bons governos: uma análise política da gestão fiscal dos municípios. Opinião Pública. Vol. 21, N° 03, pp. 673-692.
- MENDES, Wesley de Almeida; FERREIRA, Marco Aurélio Marques; ABRANTES, Luiz Antônio, and FARIA, Evandro Rodrigues de (2018), A influência da capacidade econômica e da formação de receitas públicas no desenvolvimento humano. Revista de Administração Pública. Vol. 52, N° 05, pp. 918-934.
- MOURITZEN, Poul Erik and SVARA, James H. (2002), Leadership at the apex: politicians and administrators in Western local governments. Pittsburgh: University of Pittsburgh Press. 334 pp..
- PEIXOTO, Vitor de Moraes; LEAL, João Gabriel Ribeiro Pessanha; SOUZA, Renato Barreto de, and MACHADO, Mateus Virginio Arduim (2022), Uma análise dos determinantes da reeleição de prefeitos nos municípios brasileiros em 2016. Revista Agenda Política. Vol. 09, N° 03, pp. 86-117.
-
PELLEGRINI, Josué Alfredo (2017), A nova metodologia de cálculo da capacidade de pagamento dos estados e municípios. In: Relatório de acompanhamento fiscal. Nota Técnica n° 13. Brasília: IFI. Available at <https://www2.senado.leg.br/bdsf/handle/id/535877 Accessed on July 15, 2025
» https://www2.senado.leg.br/bdsf/handle/id/535877 - PERES, Ursula Dias (2007), Custos de transação e estrutura de governança no setor público. Revista Brasileira de Gestão de Negócios Vol. 09, N° 24, pp. 15-30.
-
PERES, Ursula Dias; PEREIRA, Lauana; CAPUCHINHO, Cristiane; PINHEIRO, Yasmin de Souza; MACHADO, Gabriel Santana, and SILVA, Izabella (2022), ICMS Educacional: o que avançou nos estados e quais os riscos e incertezas para a educação? Nexo Políticas Públicas Available at <https://pp.nexojornal.com.br/opiniao/2022/ICMS-Educacional-o-que-avan%C3%A7ou-nos-estados-e-quais-os-riscos-e-incertezas-para-a-educa%C3%A7%C3%A3o >. Accessed on July 15, 2025.
» https://pp.nexojornal.com.br/opiniao/2022/ICMS-Educacional-o-que-avan%C3%A7ou-nos-estados-e-quais-os-riscos-e-incertezas-para-a-educa%C3%A7%C3%A3o - POWER, Timothy J. and RODRIGUES-SILVEIRA, Rodrigo (2019), Mapping ideological preferences in Brazilian elections, 1994-2018: a municipal-level study. Brazilian Political Science Review. Vol. 13, N° 01, pp. 01-27.
- SATYRO, Natalia Guimarães Duarte and CUNHA, Pedro Schettini (2018), The coexistence of different welfare regimes in the same country: a comparative analysis of the Brazilian municipalities heterogeneity. Journal of Comparative Policy Analysis: Research and Practice. Vol. 21, N° 01, pp. 65-89.
-
SICONFI (2024), Sistema de informações contábeis e fiscais do setor público brasileiro. Available at <https://siconfi.tesouro.gov.br/siconfi/index.jsf >. Accessed on June 25, 2025.
» https://siconfi.tesouro.gov.br/siconfi/index.jsf - SILVA, Maurício Corrêa da; SOUZA, Fábia Jaiany Vieira de; MARTINS, Joana Darc Medeiros, and CÂMARA, Renata Paes de Barros (2020), Fatores explicativos da gestão fiscal em municípios brasileiros. Revista Contemporânea de Contabilidade. Vol., 17, N° 42, pp. 26-37.
- SOUSA, Kleber Morais de and MONTE, Paulo Aguiar do (2021), Public expenditure composition and fiscal decentralization in Brazilian local governments: an analysis through unconditional quantile regression with longitudinal data. Revista de Administração Pública. Vol. 55, N° 06, pp. 1333-1354.
- TEIXEIRA, Caroline Reis and MATTOS, Enlinson (2021), Competição política e a resposta fiscal para municípios do Brasil. Economia Aplicada. Vol. 25, N° 04, pp. 545-580.
- TOMIO, Fabricio Ricardo de Limas (2002), A criação de municípios após a Constituição de 1988. Revista Brasileira De Ciências Sociais Vol. 17, N° 48, pp. 61-89.
-
TSE – TRIBUNAL SUPERIOR ELEITORAL (2024), Sistema de sigilos eleitoral. Filiados a partidos políticos. Available at <https://sig.tse.jus.br/ords/dwapr/r/seai/sig-eleicao-filiados/home?session=333985961839209 >. Accessed on Ocotober 15, 2025.
» https://sig.tse.jus.br/ords/dwapr/r/seai/sig-eleicao-filiados/home?session=333985961839209 -
UNDP (2013), Atlas Brasil. Available at <http://www.atlasbrasil.org.br/ >. Accessed on June 25, 2025.
» http://www.atlasbrasil.org.br/ - ZUCCO, Cesar and POWER, Timothy J. (2024), The ideology of Brazilian parties and presidents: coalitional presidentialism under stress. Latin American Politics and Society. Vol. 66, N° 01, pp. 178-188.
- 1
-
2
Available at < https://www.nlc.org/forms-of-municipal-government >.
-
3
Decree-Law N° 311, March 02, 1938.
-
4
For this official definition and the following, see IBGE 2010. ‘Glossário dos termos genéricos dos nomes geográficos utilizados no mapeamento sistemático do Brasil’. Brasília: IBGE.
- 5
- 6
-
7
This is the most recent year for which data are available at the municipal level on the IPEA website. Available at < https://www.ipea.gov.br/participacao/noticias-do-ipea/1241-atlas-vulnerabilidade-social-municipios >.
-
8
Available at https://sig.tse.jus.br/ords/dwapr/r/seai/sig-eleicao/home >.
-
Data replication:
DOI: 10.7910/DVN/BQLCYJ
-
Financing:
São Paulo Research Foundation (FAPESP) – Grant N° 2013/07616-7.
Edited by
-
Associate editor:
Sandra Gomes
DOI: 10.7910/DVN/BQLCYJ

 Source: Elaborated by the authors based on data from the Superior Electoral Court (
 Source: Elaborated by the authors based on data from the Superior Electoral Court (
 Source: Elaborated by the authors based on data from the Brazilian Institute of Geography and Statistics (
 Note: Population figures are from 2022.Source: Elaborated by the authors based on data from the Brazilian Institute of Geography and statistics (
 Source: Elaborated by the authors based on data from the Brazilian Institute of Geography and Statistics (
 Note: Population figures are based on 2022 estimates.Source: Elaborated by the authors based on data from the Brazilian Institute of Geography and Statistics (
 Note: Population figures are based on 2022 estimates.Source: Elaborated by the authors based on data from the Brazilian Institute of Geography and Statistics (