FIGURE 1
Structure of (A) cpTP-0, (B) cpTP-1, (C) TAP-2 and (D) cpTAP-2.
FIGURE 2
Synthetic route to obtain thiazepinones cpTP-0 and cpTP-1.
FIGURE 3
Synthetic route to obtain precursor 4-phenyl-6-(4-ethoxyphenyl)-2-aminopyrimidine.
FIGURE 4
Synthesis of spirothiazolidin-4-ones cpTAP-2 and TAP-2.
FIGURE 5
Number of male CD-1 mice that successfully completed the rotarod test. Two-tailed Fisher exact test, n:4 (vehicle, clonazepam: 0.2 mg/kg, cpTP-0: 100 mg/kg, cpTP-1:100 mg/kg, TAP-2: 100 mg/kg, cpTAP-2: 100 mg/kg).
FIGURE 6
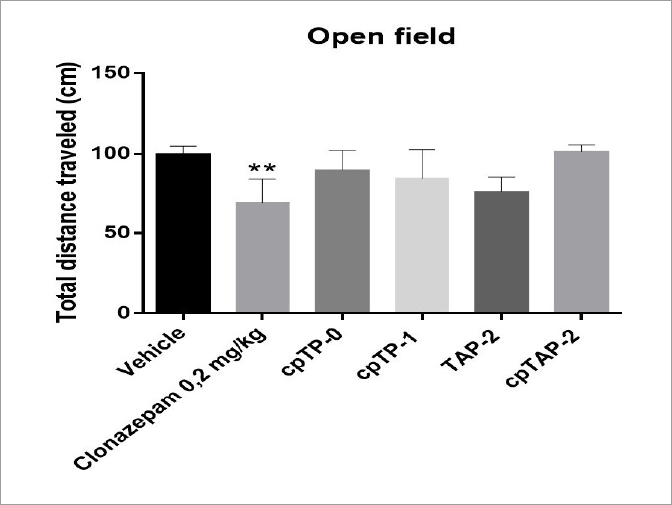
Total distance travelled in the open field by male CD-1 mice ± S.E.M. **p<0.01, One way ANOVA, n:4 (vehicle, clonazepam: 0.2 mg/kg, cpTP-0: 100 mg/kg, cpTP-1:100 mg/kg, TAP-2: 100 mg/kg, cpTAP-2: 100 mg/kg).
FIGURE 7
Percentage of (A) time and (B) entries in the open arms of the elevated plus maze (EPM) of male CD-1 mice ± S.E.M. **p<0.01 ***p<0.001, One way ANOVA, n:4 (vehicle, clonazepam: 0.2 mg/kg, cpTP-0: 100 mg/kg, cpTP-1:100 mg/kg, TAP-2: 100 mg/kg, cpTAP-2: 100 mg/kg). (A) +d> 1.5, Cohen’s method.
FIGURE 8
Immobility time in the forced swimming test (FST) of male CD-1 mice ± S.E.M. *p<0.05 **p<0.01, One way ANOVA, n:4 (vehicle, imipramine: 34 mg/kg, cpTP-0: 100 mg/kg, cpTP-1:100 mg/kg, TAP-2: 100 mg/kg, cpTAP-2: 100 mg/kg). +d > 1.56, Cohen’s method.
FIGURE 9
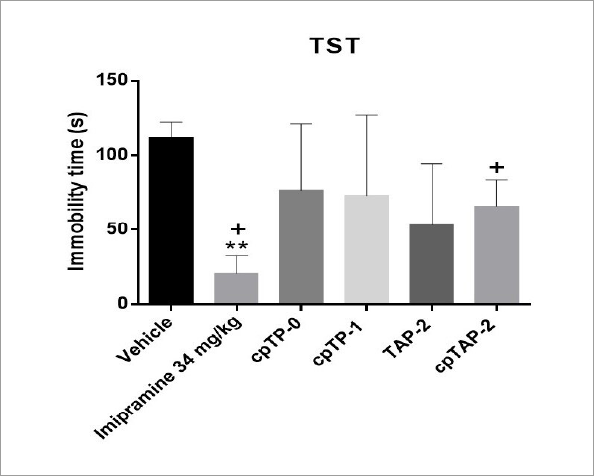
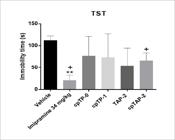
Immobility time in the tail suspension test (TST) of male CD-1 mice ± S.E.M. **p<0.01, One way ANOVA, n:4 (vehicle, imipramine: 34 mg/kg, cpTP-0: 100 mg/kg, cpTP-1:100 mg/kg, TAP-2: 100 mg/kg, cpTAP-2: 100 mg/kg). +d > 2.0, Cohen’s method.
FIGURE 10
(A) Latency time and (B) barbiturate sleeping time of male CD-1 mice ± S.E.M. ****p<0.0001, One-way ANOVA, n:4 (vehicle, clonazepam: 0.2 mg/kg, cpTP-0: 100 mg/kg, cpTP-1:100 mg/kg, TAP-2: 100 mg/kg, cpTAP-2: 100 mg/kg). (B) +d > 1.98, Cohen’s method.
FIGURE 11
Number of male CD-1 mice protected from seizures induced by PTZ (85 mg/kg). *p<0.05, Two tails exact Fisher test, n:4 (vehicle, clonazepam: 0.2 mg/kg, cpTP-0: 100 mg/kg, cpTP-1:100 mg/kg, TAP-2: 100 mg/kg, cpTAP-2: 100 mg/kg).
FIGURE 12
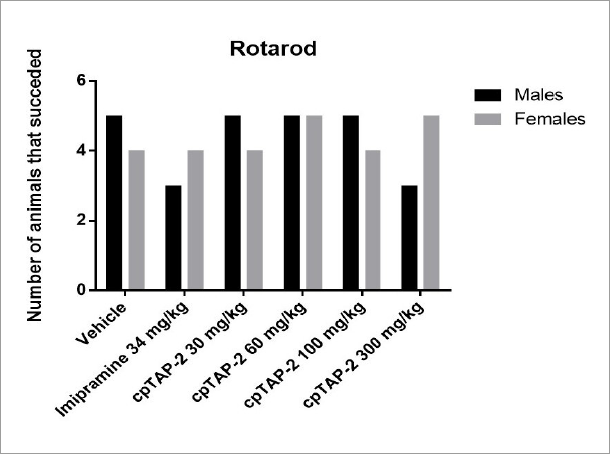
Number of male and female CD-1 mice that successfully completed the rotarod test. Two-tailed Fisher exact test. n:5 (vehicle, imipramine: 34 mg/kg, cpTAP-2: 30, 60, 100 and 300 mg/kg).
FIGURE 13
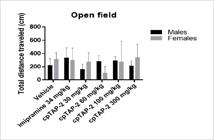
Total distance travelled in the open field by male and female CD-1 mice ± S.E.M. n:5 (vehicle, imipramine: 34 mg/kg, cpTAP-2: 30, 60, 100 and 300 mg/kg).
FIGURE 14
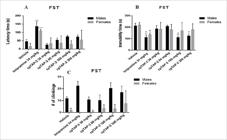
(A) Latency time, (B) immobility time and (C) number of climbings in the forced swimming test (FST) of male and female CD-1 mice ± S.E.M. **p<0.01 ***p<0.001 ****p<0.0001, Two-way ANOVA-Dunnet, n:5 (vehicle, imipramine: 34 mg/kg, cpTAP-2: 30, 60, 100 and 300 mg/kg). (B) +d > 1.56, Cohen’s method.
FIGURE 15
2D and 3D views of the interactions of reference compounds with the BZD-site of the GABAA receptor predicted by molecular docking: (A) Clonazepam. (B) Diazepam. (C) Flunitrazepam.
FIGURE 16
Interactions of proposed thiazepinones (cpTP-0 and cpTP-1) with the BZD-site of GABAA receptors, predicted by molecular docking.
FIGURE 17
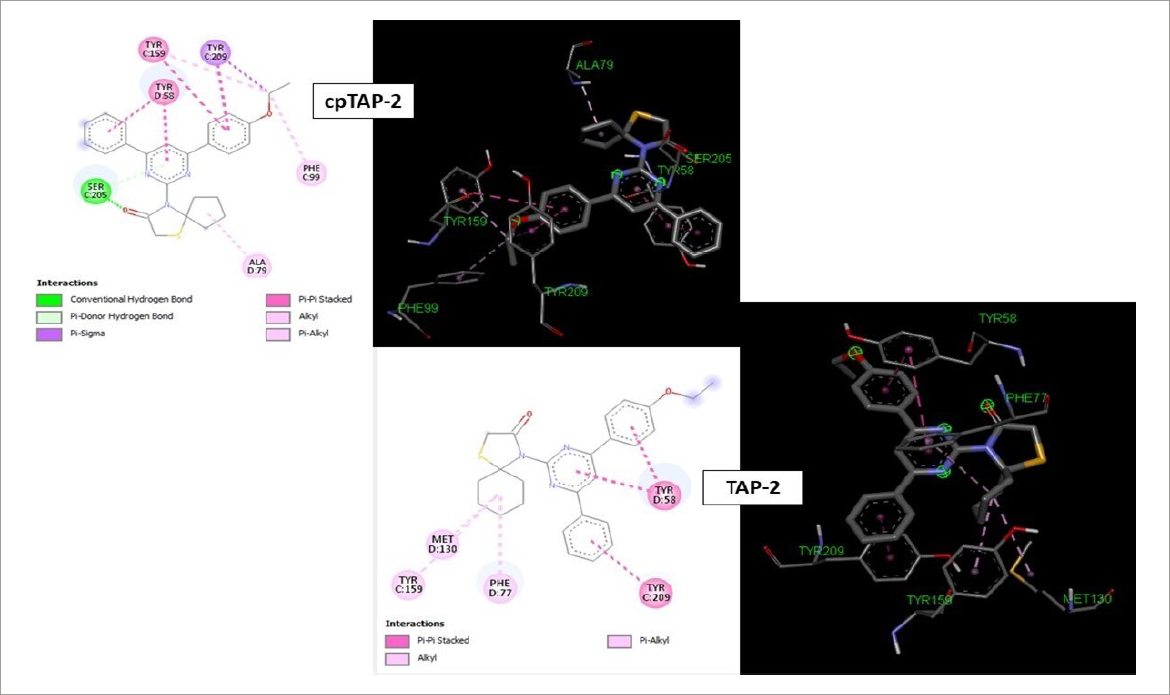
Interactions of proposed thiazolidinones (cpTAP-2 and TAP-2) with the BZD-sites of GABAA receptors predicted by molecular docking.

 Neuropharmacological profile of new thiazepinone and thiazolidinone compounds designed by virtual screening
 Thumbnail
 Thumbnail
 Thumbnail
 Thumbnail
 Thumbnail
 Thumbnail
 Thumbnail
 Thumbnail
 Thumbnail
 Thumbnail
 Thumbnail
 Thumbnail
 Thumbnail
 Thumbnail
 Thumbnail
 Thumbnail
 Thumbnail