 Exploration of phytochemicals and antihyperlipidemic effect of crateva religiosa bark: in vivo mechanistic approach for management of hyperlipidaemia
Abstract
The work investigated the presence of phytochemicals and antihyperlipidemic potential of the ethanolic extract of Crateva religiosa (CRETE). The extraction yield was found to be highest with ethanol (15.81% w/w), followed by ethyl acetate (11.98% w/w) and very poor in hexane (3.05% w/w), using as solvents of variable polarity. Quantitative phytochemical analysis revealed that CRETE consists of higher total phenolic content (81.19 µg/mg equivalent to gallic acid) and flavonoid contents (49.0 µg/mg quercetin equivalents) compared to the ethyl acetate extract. GC-MS analysis confirmed the presence of stigmasterol, gamma-sitosterol and lupeol as phytochemicals. In vivo studies demonstrated that 400 mg/kg of CRETE reduced the levels of triglycerides (155.9 ± 1.51 mg/dl), total cholesterol (234.27 ± 1.91 mg/dl) and low-density lipoprotein cholesterol (66.27 ± 2.07 mg/dl), while increased the level of high-density lipoprotein cholesterol (133.48 ± 3.72 mg/dl). Atherogenic indices were also improved significantly. CRETE restored hepatic architecture and reduced adipocyte size. CRETE also exhibited strong antioxidant effects by lowering malondialdehyde (MDA) levels and enhancing glutathione (GSH), superoxide dismutase (SOD) and catalase activities. Mechanistically, in comparison to control groups, CRETE inhibited HMG-CoA reductase activity (p < 0.0001) and up-regulated PPARγ (p < 0.01) and CCAAT/EBPα (p <0.05) expressions in adipocytes significantly.
Keywords:
Cholesterol diet; HMG-CoA reductase; Oxidative stress; Hypercholesterolemia; PPARγ; CCAAT/EBPα.
INTRODUCTION
Crateva religiosa is commonly known as temple plant or sacred garlic peer (Parveen et al., 2022). Potential medicinal properties of different parts of plant including the bark, leaves and roots are mainly for addressing issues like obesity, hyperlipidaemia and cardiovascular disorders (Meriga, Ganjayi, Parim, 2017). Hyperlipidaemia denotes raised lipids level in the blood circulation, encompassing cholesterol as well as triglycerides. It is characterized by a disturbance in the metabolism of the lipid (Ruotolo, Howard, 2002). Disruption of lipid metabolism is the main reason for various cardiovascular diseases like coronary artery disease and atherosclerosis (Fava et al., 2006).
Genetic polymorphism emerges as the predominant cause of hyperlipidaemia. Peroxisome proliferatorsactivated receptors (PPARs) have main role in amendable gene systems related to the formation of adipose cells, lipid metabolism and homeostasis (Varga, Czimmerer, Nagy, 2011). PPARγ acts as a master regulator of adipogenesis, a potent modulator of overall lipid metabolism (Debril et al., 2011)
CCAAT/EBPα is a key protein that helps to change immature fat cells into fully developed ones. It plays an important role in fat storage by activating genes like PPARγ and fatty acid synthase, which help fat cells to store triglycerides (Fajas, Debril, Auwerx, 2001). However, too much CCAAT/EBPα can cause excessive fat build up, leading to larger fat cells and increasing the risk of obesity and high fat levels in blood (Jezek, Jaburek, Porter, 2019). CCAAT/EBPα and PPARγ work together to promote fat cell development by activating specific fat-related genes (Busiello, Savarese, Lombardi, 2015).
Disturbed lipid profile plays a crucial role in the body, but raised levels can lead to health complications (Unger et al., 2010). The study aims to uncover the underlying mechanisms that involve exploring specific pathways, molecular interactions, and biological processes influenced by Crateva religiosa bark extract (Tao, Sifuentes, Holland, 2014). Cholesterol rich diet induced hyperlipidaemic rats’ experimental model representing features like human hyperlipidaemia. This is a common model in biomedical research, to check raised lipid levels (Andreadou et al., 2020).
The decision to utilize extracts from Crateva religiosa bark underscores the interest in specific bioactive compounds present in the bark, such as alkaloids, flavonoids, terpenoids, or other phytochemicals contributing to observed therapeutic effects (Roy et al., 2022; Niki et al., 2005). This study may provide a rational approach in the case of hypocholesterolaemia drugs. The reason for choosing the Wistar Albino rats is due to genetically resemblance to humans as well as cholesterol metabolism and cardiovascular diseases are urgent issues concerning humans. Therefore, concentrating on the hyperlipidaemic conditions of such rats would make the researchers' work models quite clinical and relevant for measuring the effectiveness of Crateva religiosa bark extract (Ghezzi et al., 2012).
Studying the mechanistic information will help understand the experimental findings of how extracts from Crateva religiosa barks can affect cholesterol levels, and thus the pathway for further clinical testing of the plant will be created (Odukoya et al., 2022).
In conclusion, this research aims to discuss the effective management of hyperlipidaemia and the therapeutic aspects of the crude extractsof the bark of Crateva religiosa (Sikarwar, Patil, 2012). The result of the present study may open up opportunities for the creation of new practice-based, naturedrawn therapeutic models for lipid abnormalities that can strengthen and enhance the understanding and management of cardiovascular diseases (Bruckert, 2002).
MATERIAL AND METHODS
Experimental animals
The study has been performed on 100 ± 10 g Wistar albino male rats. The Animal Ethics Committee of I.T.S College of Pharmacy approved all protocols and animal procedures. Rats were housed in the animal house at I.T.S College of Pharmacy, Ghaziabad, India (Registration no.: 1044/PO/Re/S/07/CPCSEA, 27th Feb 2007). They had been accessed typical pellet chow diet and water ad libitum. All the animals were housed at 23 ± 2°C with 55% relative humidity and a twelvehour light/dark cycle. All animals were acclimated to standard laboratory environments for at least 7 days before the experimental procedures started, with 6 animals per cage.
Chemicals and materials
Cholesterol and cholic acid were sourced from Sisco Research Laboratories, while other reagents were obtained from CDH. LDL-c, HDL-c, TC and TG were investigated by commercial kits supplied by Erba Mannheim Diagnostics. Rosuvastatin was acquired from Watson Pharma, Mumbai, India.
The collection, authentication, and extraction of plant parts
Crateva religiosa bark was collected from Bharatpur, Rajasthan Medicinal farm of Prakriti Garden studio, Rajasthan in April 2022. The identification and authentication were done by CSIR-National Institute of Science Communication and Policy Research, Delhi, and through voucher specimen no. NIScPR/RHMD/ Consult/2022/4108-09-3. The bark of plant was cleaned with water to eliminate the impurities and dried for 10 days. The powdered plant material was extracted through Soxhlet apparatus by successive solvent extraction method with hexane as nonpolar solvent for 24 hours and further extracted with ethyl acetate as median polar and followed with ethanol (highly polar) for 72 hours. Extracts were concentrated on a rotatory evaporator and then dried under reduced pressure. The percentage yield of extract was calculated (Nadkami, 2017).
Preliminary Phytochemical analysis
Preliminary qualitative chemical analyses of Crateva religiosa bark extracts was conducted to determine the presence of key bioactive constituents, including tannins, steroids, flavonoids, phenolic compounds and terpenoids (Khandelwal, 2002). Due to the low percentage yield and absence of active constituents, the hexane extract was not used for further studies.
Estimation of Total Phenolic Content
The total phenolic content was determined using the Folin-Ciocalteu reagent method. Gallic acid was used as the standard, with a calibration curve prepared from dilutions ranging between 10 and 100 µg/ML. Absorbance was measured at 760 nm the results were expressed in µg of gallic acid equivalents per mg of extract (Nortjie et al., 2022).
Estimation of Total Flavonoid Content
The total flavonoid content was determined using quercetin as the standard. A calibration curve was prepared with quercetin concentrations ranging from 10 to100 µg/mL in ethanol. For each dilution of the standard and CRETE strains 1.5 mL of ethanol, 0.1 mL of 10% aluminium chloride solution, 0.1 mL of 1 M potassium acetate solution and 2.8 mL of water were added. A blank sample was prepared using the same reagents, excluding the standard and extracts. All samples were filtered using Whatman’s filter paper before measurement. Absorbance was recorded at 420 nm using a UV-1900i Shimadzu spectrophotometer. The analysis was performed in triplicate, and the flavonoid content in the extracts was calculated using the regression equation from the standard curve (Blainski, Lopes, De Mello, 2013).
Among the two tested extracts (ethyl acetate and ethanol), CRETE showed the highest total phenols and flavonoids content, then ethyl acetate extract of plant bark. Therefore, further investigations were carried out using CRETE.
Gas chromatography-mass spectroscopy (GC-MS)
GC-MS was carried out to identify the molecular formula, molecular weight and structure of the active chemical constituents. Gas chromatography mass spectrometer (GCMS-TQ8040, Shimadzu) with an AOC-20i auto injector was used to determine the existence of active chemical constituents (Andrus et al., 1956). The program lab solution was utilized and the bioactive constituents were recognized by matching their peak retention time, peak area (%), height (%) and m/z fragmentation patterns to that of the established bioactive compounds described by the library, National Institute of Standards and Technology (NIST). GC-MS study was done at the Central Laboratory Patanjali Food and Herbal Park Pvt. Ltd. Haridwar, India.
Acute oral toxicity
Acute oral toxicity study for CRETE was performed as mentioned in OECD guidelines 423. A test was conducted using a dose of 2000 mg/kg orally as a single dose, following a fasting period of 3-4 hours with access to water ad libitum. The observations were made closely for the first 30 minutes and then for 4 hours after administration of dose (OECD Guidelines, 2000).
Preparation and Dosing of ethanolic extract (CRETE) for Animal Studies
For animal administration, standard drug Rosuvastatin 10 mg/kg and CRETE were solubilised separately in normal saline (0.9% w/v NaCl) as a vehicle and directed through oral gavages. Three doses of CRETE having 100, 200 and 400 mg/kg of it were prepared by dissolving it in to the appropriate amount of vehicle and administered orally using an oral gavage to ensure proper dosing.
Induction of hyperlipidaemia (Model-based on cholesterol rich diet)
Wistar albino male rats (6-8 weeks old) were nursed with cholesterol diet for 9 weeks. A cholesterolrich cocktail at1 ml/100 g body weight was used to induce hyperlipidaemia. Cholesterol-rich cocktail was prepared with peanut oil 1 litre, cholesterol 100g, propyl thiouracil 30 g, and cholic acid 100 g. Plant extracts were administered simultaneously with the cocktail means two hours before the feeding with the cholesterol diet till 9th week (Vogel, 2002). Monitoring and documentation of the progression of hyperlipidaemia was observed throughout the experiment. Comparative calculations were made between the normal control group, cholesterol diet-induced control group, and treatment groups at each time interval. Detailed records of when hyperlipidaemia was induced and its severity at each interval were maintained to ensure induction of hyperlipidaemia.
Experimentation
Rats having initial weights approx. 100 ± 10 g were selected. Six experimental groups were prepared having 6 rats in each group.
Group I The group received no treatment, only saline at a dosage of 10 ml/kg administered orally per oral and acted as a control (normal).
Group II A cholesterol diet-induced control group or disease control. Animals received cholesterol rich diet through oral gavage (1 ml per 100 g body weight) as a hyperlipidaemia-inducing agent for up to 9 weeks (Elmowafy et al., 2017).
Group III Serving like the standard group, rats in this category received the reference drug Rosuvastatin with dose of 10 mg per kg, orally directed before 2 hours of being fed with the cholesterol diet. This treatment regimen was initiated from day one and continued throughout the 9 weeks (Krause, Newton, 1995).
Group IV As a test group, rats were administered CRETE with dose of 100 mg/kg orally. The administration of dose was carried out two hours before the initiation of feeding with the cholesterol diet up to 9 weeks (Dhingra et al., 2014).
Group V As a test group, rats received CRETE dose of 200 mg/kg, orally at two hours before the commencement of feeding with the cholesterol diet, and the treatment was sustained for the entire 9 weeks duration (Gregory et al., 2013).
Group VI As a test group, rats received CRETE with a dose of 400 mg/kg orally. The administration of dose was conducted at two hours before the initiation of feeding with the cholesterol rich diet persisted throughout the 9 weeks (Zhou et al., 2016).
Blood, tissue sample collection and confirmation of hyperlipidaemia
Baseline lipid parameters were measured at the beginning of the experiment. Continuous monitoring of the lipid profile at various time intervals was conducted to select hyperlipidaemic rats. Rats showing significantly elevated TC, TG, and LDL-C levels (compared to normal controls) were considered hyperlipidaemic and included in the treatment study. This includes detailed documentation for when hyperlipidaemia was induced and following of its progression throughout the experiment. Ketamine (50 mg per kg) was used to anesthetize the rats. Blood samples were collected by retro-orbital puncture method at weeks 0, 3, 6, and 9 after overnight fasting. Different time intervals were used to confirm that when the hyperlipidaemia will be induced and confirmation was done after comparing with normal control as well as cholesterol diet induced control group.
For biochemical analysis, western blotting, and histological examinations liver, skeletal muscle, and adipose tissues (white) were collected and fixed. Body weight as well as food consumption were recorded regularly at weeks 0, 3, 6, and 9 (Bhardwaj et al., 2013; John et al., 2015).
Lipids Profile
Plasma LDL-c, HDL-c, TG and TC levels were estimated using an Erba Mannheim Diagnostics commercial kit at the interval of 0, 3, 6, and 9 weeks. The absorbance was taken at 450 nm (Tipple, Rogers, 2012).
Lipid ratios of Plasma
It was calculated through the following formulas:
Atherogenic Coefficient (AC): (TC - HDL-c)/ HDL-c,
Atherogenic Index of Plasma (AIP): (TG/HDL-c),
Castelli’s Risk Index (CRI-I): Total Cholesterol/HDL-c and
Castelli’s Risk Index (CRI-II): Low-Density Lipoprotein Cholesterol/HDL-c (Mengesha, Gnanasekaran, Mehare, 2021).
Homogenization of isolated liver sample
Homogenate of the liver in 10% w/v, ready with phosphate buffer, pH 7.4, 0.1 M then centrifuged for up to 20 minutes at 15,000 rpm. After that collected supernatant was proceeded for further estimations (Coelho, Oliveira, Fernandes, 2013).
Oxidative stress analysis
MDA and GSH were assessed through homogenate obtained from liver.
Assay for Lipid Peroxidation
The classical method was used to measure lipid peroxidation (Ohkawa, Ohishi, Yagi, 1979). Sodium dodecyl sulphate, acetic acid, and Thio-barbituric acid (0.8% aqueous solution) mixed to the liver homogenate, heated at 95°C for 60 minutes. n-butanol and pyridine (15:1 ratio) added then centrifuged. Absorbance measured by a spectrophotometer at 532 nm. MDA levels were reported in µmol/mg of protein (Giustarini et al., 2014).
Protein content estimation
The traditional method was used to analysis of protein level with bovine serum albumin used like standard (Lowry et al., 1951).
Reduced Glutathione estimation
To estimate tissue GSH levels, homogenate of the liver precipitated with 5% tri-chloro-acetic acid, centrifuged at 1000 rpm for 10 minutes. Supernatant added with 0.2 M, pH 8.0 sodium phosphate buffers and Ellman's reagent added. After 10 minutes, intensity of the yellow colour analysed using spectrophotometer at 412 nm. GSH levels were reported in µmol/mg of protein (Yan et al., 2018; Ross, Jensen, Hardie, 2016).
Histological investigation
10 % formalin fixative solution was used to store liver, skeletal muscle, and white adipose tissue. Segments were examined to evaluate fatty infiltration of the liver, intra myo-cellular content of lipid in skeletal muscle, and white adipose tissue through histopathological analysis at I.T.S Dental College, Murad Nagar, Ghaziabad, India. Cell diameter was measured using Pro Magnus Software from different regions per slide; approx. 12 cells in each were analysed (Kupfer, Munsell, 1968).
Enzyme-linked Immunosorbent Assay (ELISA) for AMP-activated protein kinase (AMPK) and HMGCo A reductase
10µl liver homogenate was incubated with 10µl of substrate mixture (10 µM ATP/ 10 µM AMP/ 0.2µg/ µl SAMS peptide solution in AMPK buffer) for 60 minutes. For the ATP depletion assay, 100 µl of firefly reagent (50 mM Glycine, Luciferin 0.15 mM, Tris 1 mM (pH 7.6), EDTA 0.55 mM, 5 mM MgCl2,0.1% Sodium Azide, 0.1% BSA) was added to 20 µl of the treated lysate. Then, 10 µl of Luciferase enzyme (106 U/ml in 1 M Glycine Tris Buffer (pH 7.6), 100 mM Magnesium Sulfate, 10mM EDTA) was added. The plate was then read for luminescence using a BioTek Synergy H1 multi-mode reader (Kumar et al., 2019; Sztolsztener et al., 2023). For HMG-CoA reductase assay prepare and add the volume of reaction buffer (commercial kits) to the defined wells of 96-well plates. Add 10µl sample to the reaction mixture of the defined wells. Then, add 10µl NADPH solution to the defined wells. Finally, add 20µl substrate to start the reaction to the wells. Incubate plate for 1 hour to complete reaction. Finally, add 100µl of DMAB reagent to each well of the plate and incubate for 5 minutes. Absorbance was taken at490 nm with microplate reader (Ashafa, Orekoya, Yakubu, 2012; Basu et al., 2018).
Western blot analysis of PPARγ and CCAAT/EBPα
Homogenization of adipose tissue was performed with radio-immuno precipitation assay. Transfer efficiency was assessed using Ponceau staining. Primary antibodies are polyclonal anti-PPARγ rabbit antibody and polyclonal CCAAT/EBPα rabbit antibody. Fluor Chem E imaging system was used for the detection with an enhanced chemi-luminescence kit. Normalization of the protein expression was done by β-actin. The band intensity was analysed using ImageJ software (Mahmoodi, Najafipour, 2022).
Statistical investigation
The investigation was completed by using Graph Pad prism version 10.4.1 (627). Results were articulated in mean ± SEM or SD. Statistical analysis involved ANOVA with Bonferroni and Dunnett’s post-hoc test. Significance established at p less than 0.05.
RESULTS
Extraction yields
The average percentage yields of Crateva religiosa bark extracts were found as 3.05 % w/w in hexane, 11.98% w/w in ethyl acetate and 15.81% w/w in ethanol.
Preliminary phytochemical analysis outcomes
On performing the preliminary qualitative tests, the presence of secondary metabolites such as tannins, steroids, flavonoids, phenolic compounds and terpenoids were confirmed in both ethyl acetate and ethanol extract. Due to the poor percentage yield and absence of active constituents, the decision was made to cease the utilization of hexane extract for future research.
Total phenolic content in Ethyl acetate and Ethanolic extract
The calibration curve equation was obtained as y = 0.0062x + 0.1662. The total phenol content in ethyl acetate and ethanolic extract was 29.47 µg/mg and 81.19 µg/mg equivalents to gallic acid, respectively.
Total flavonoids content in Ethyl acetate and Ethanolic extract
The quantity of flavonoids in the plant extracts was measured in micrograms per milligram (µg/mg), using quercetin as a reference. The calibration curve of quercetin was obtained with the equation y = 0.0079x + 0.1626. The total flavonoid contents of ethyl acetate and ethanolic extract were 8.78 and 49.08 μg/mg quercetin equivalents, respectively (Table I).
Shows the data including the total phenolic and flavonoid contents in ethyl acetate and ethanolic extract (CRETE) of Crateva religiosa. The total phenolic content is expressed in µg of gallic acid equivalents per mg of extract, while the total flavonoid content is expressed in µg of quercetin equivalents per mg of extract
In the present study ethanolic extract named as “CRETE” contains high total phenols and flavonoids contents as mentioned in Table I. These phytochemicals are effective to reduce the triglyceride accumulation, ROS generation, fibrosis, inflammation and oxidative stress which are the main reason for hyperlipidaemia (Tungmunnithum D et al., 2018). Due to having potent antioxidant properties of phenols and flavonoids, CRETE attracts the minds of researchers to investigate its role in protection against hyperlipidaemia. So, this is the rationale behind selecting the ethanolic extract of Crateva religiosa bark to use the mechanistic approach to prove the traditional antihyperlipidemic claim of Crateva religiosa bark.
Further analysis of CRETE was carried out by using GC‒MS which demonstrated the presence of 50 phytoconstituents with their retention times (RTs), molecular formulas, molecular weights, and concentrations (peak area %). Among all these phytoconstituents, there was presence of three bioactive compounds named stigmasterol, gamma sitosterol, and lupeol which were identified to have hypolipidemic property in literature survey (Table II) represents the retention times (RTs), molecular formulas, molecular weights, and concentrations (expressed as % peak area) of these three bioactive phytochemicals found in CRETE. The first identified compound was stigmasterol, having a molecular formula of C29H48O and a molecular weight of 412. It was detected at a retention time of 29.180 minutes, with a mass [M+] of 412. The daughter ion spectra of stigmasterol showed characteristic fragment ions at m/z 55, 133, 159, 255, 300, 351, and 412. The second compound, gamma sitosterol, has a molecular formula of C29H50O and a molecular weight of 414, with a retention time of 29.692 minutes. Its spectra revealed fragment ions at m/z 55.1, 57.1, 81.1, 91, 95.1, 105, 107.1, 145.1, 329, and 414. The third compound, lupeol, was detected at a retention time of 30.58 minutes. It has a molecular formula of C30H50O and a molecular weight of 426, with characteristic fragment ions observed at m/z 218 (100), 207 (50), and 18 (60) (Figure 1).
GC‒MS analysis data showing the characteristics of bioactive molecules present in CRETE. The data of the table presents the chromatographic characteristics of three compounds detected in the sample. The data includes the retention time (RT), peak height and area, along with their relative percentages (% Height and % Area). The compounds identified are Stigmasterol, Gamma Sitosterol, and Lupeol, along with their molecular formulas and molecular weights

GCMS analysis showing the m/z and fragmentation patterns of bioactive compounds: [A] lupeol, [B] Gamma sitosterol, [C] Stigmasterol.
Acute toxicity study
CRETE did not express any toxicity symptoms and no death up to 2000 mg/kg body weight. 100, 200 and 400 mg/kg doses of CRETE were chosen to know its dose dependent therapeutic potential as per experimental design used in the further study.
Outcomes of % weight change and food intake change (gm/week):
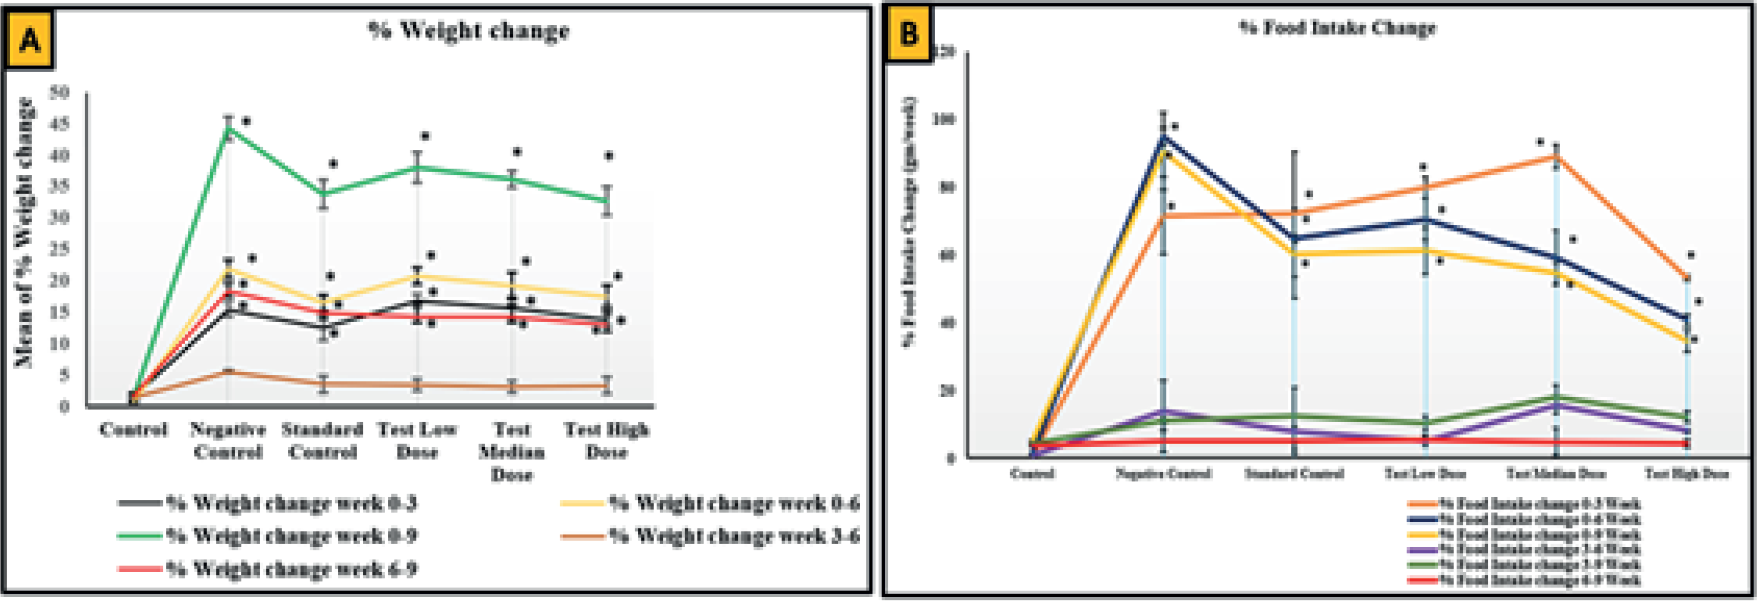
Throughout the feeding period, the cholesterol-fed groups exhibited higher food intake than to the normal control group. Rats experienced significant weight gain after 9th weeks. The action of extracts led to a notable decline in body weight, particularly in all plant extract groups (Figure 2).
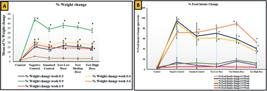
The figure has two panels (A and B) that present the effects of different treatment groups on % weight change and food intake change over time. Panel A; % Weight Change: The graph shows the mean % change in body weight across different experimental groups: Control, Cholesterol induced Control, Standard Control, and Test groups (Low, Median, and High doses). The different coloured lines represent weight change over different time intervals (0-3 weeks, 0-6 weeks, 0-9 weeks, 3-6 weeks, 6-9 weeks). The cholesterol diet induced control group shows the highest weight gain across the 0-9 weeks. The standard control, low and median dose test groups show moderate weight gain but higher test dose group seems to control weight gain more effectively. Statistically significant differences (marked by *) indicate noteworthy differences between groups. Panel B; % Food Intake Change: This graph demonstrates the mean percentage change in food intake across the same groups over different time intervals. The cholesterol induced control group exhibits the highest increase in food intake, especially in the (0-3 weeks, 0-6 weeks, 0-9 weeks). The standard control, low and median test dose groups show a relatively lower food intake compared to the cholesterol induced control group. Higher test dose group appear to reduce excess food intake more effectively over time. * Indicates statistically significant differences between groups.
Plasma Lipid Profile
CRETE were found to be capable of effectively to stabilize the level of TG, TC, and LDL-c across all test groups (group IV, V, and VI) in comparison to the Cholesterol induced Control group. HDL-c readings were meaningfully high in CRETE receiving rats of test groups, with the greatest increase observed in the highdose (400 mg/kg) of CRETE receiving rats of group VI, followed by medium dose (200 mg/kg) of CRETE receiving rats of group V, and low dose (100 mg/kg) of CRETE receiving rats of group IV (Table III).
Changes in the plasma TG, TC, LDL-c, and HDL-c in the different treatment groups of Wistar albino rats during the experiment
Lipid ratios of Plasma (AIP, AC, CRI-I, and II):
Atherogenic indices are commonly related through the expansion of dyslipidaemias and cardio-metabolic conditions. Research indicates that lipid indices derived from lipid profile parameters provide a more accurate prediction for dyslipidaemia (Table IV).
Shows Atherogenic Index of Plasma (AIP), Atherogenic Coefficient (AC), Cardiac Risk Index-I (CRI-I), and Cardiac Risk Index-II (CRI-II) across different treatment groups at 0, 3rd, 6th, and 9th weeks. Groups include the control (Group I), Cholesterol-rich diet induced control (Group II), standard control (Group III), and three CRETE-treated groups with low (100 mg/kg, Group IV), medium (200 mg/kg, Group V), and high (400 mg/kg, Group VI) doses
Serum biochemical indices for Oxidative stress
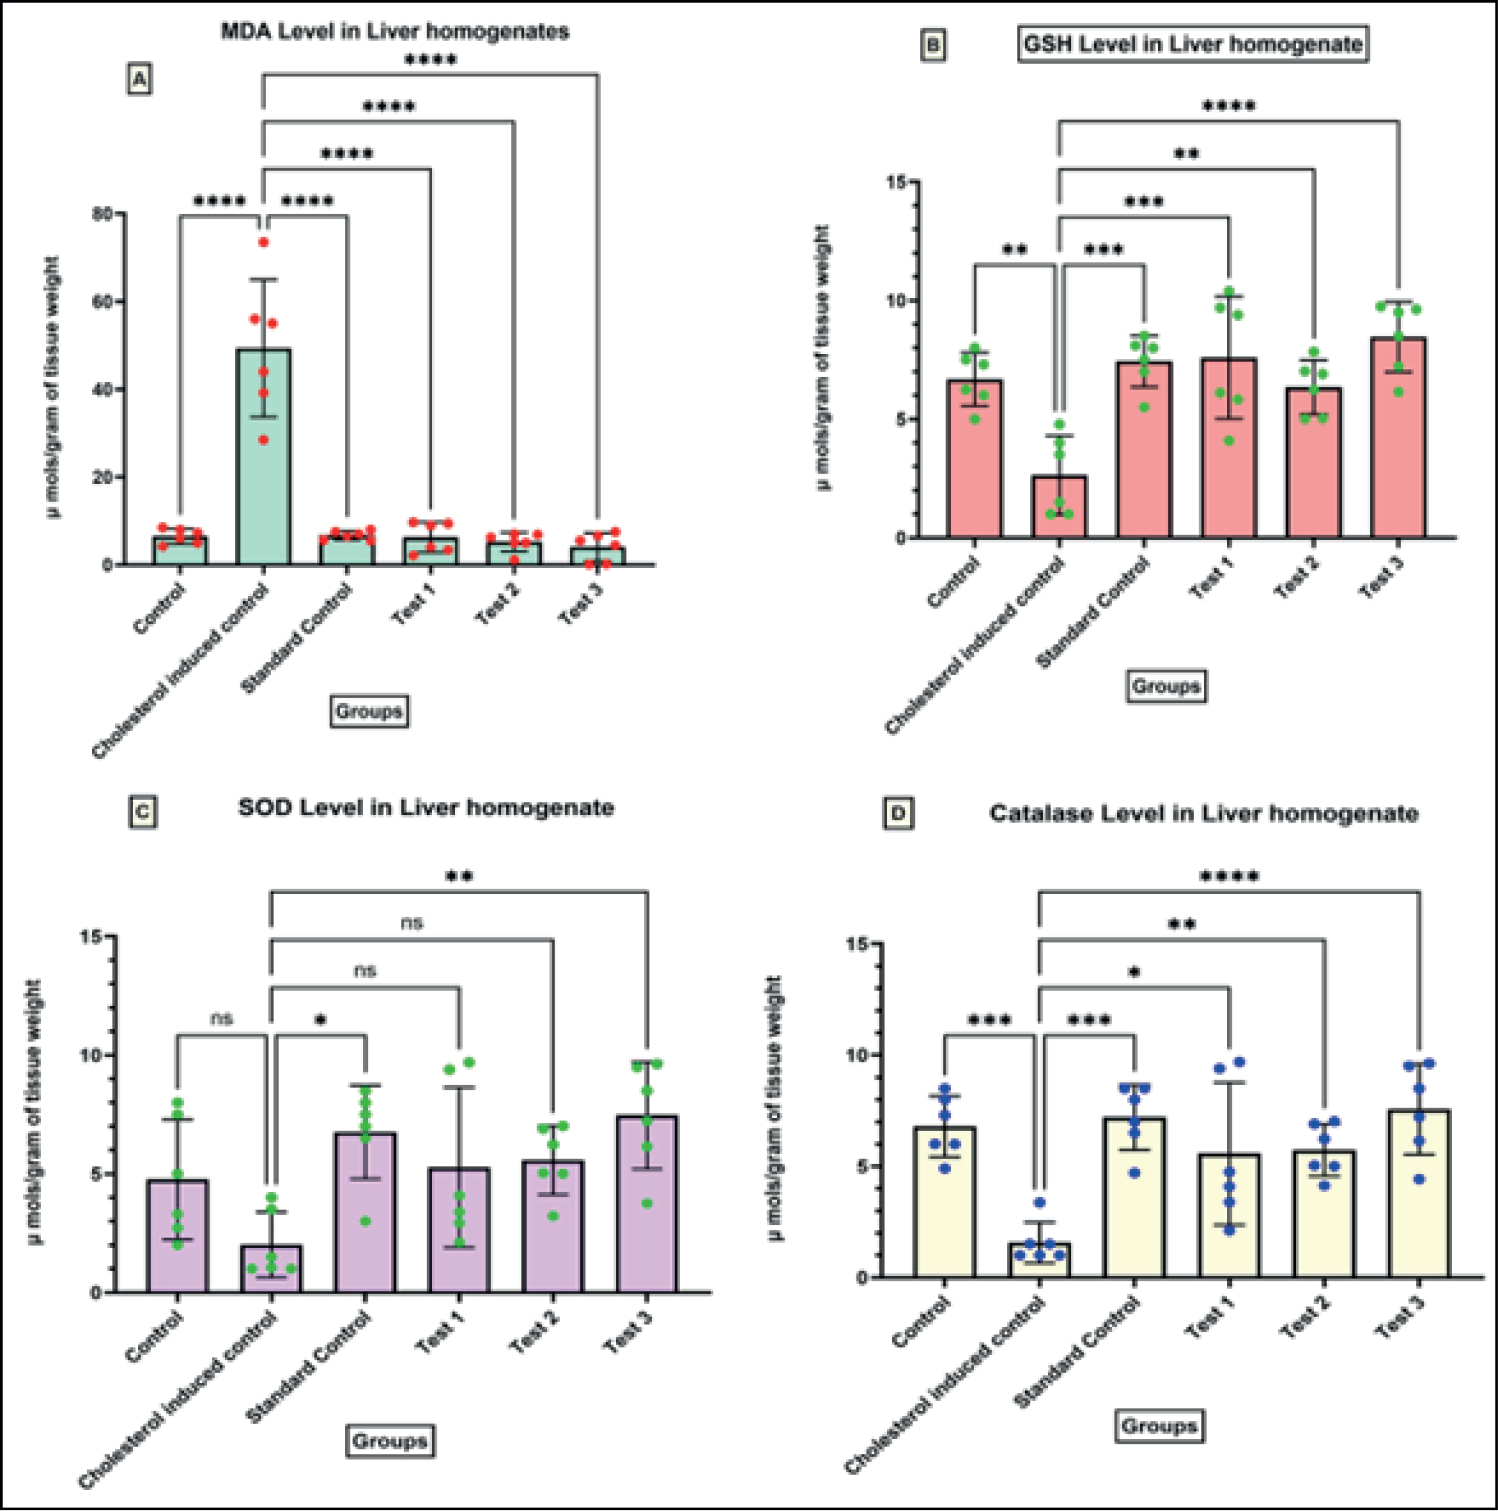
Hyperlipidaemia led to high TBARS levels and low GSH, catalase and SOD levels in the liver. Extract significantly decreased TBARS and increased, SOD, GSH and catalase levels (p less than 0.05) (Figure 3).
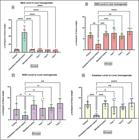
Shows antioxidant statuses in liver homogenates. The figure represents the levels of oxidative stress markers MDA, GSH, SOD and Catalase in the liver homogenates of Wistar albino rats across various treatment groups. Data are expressed as mean ± SEM (n = 6), with statistical significance determined using Bonferroni's post-hoc test. MDA Levels (Figure 3A): The cholesterol-induced control group displayed a marked increase in MDA levels compared to the normal control (p < 0.0001), signifying enhanced lipid peroxidation and oxidative stress. Treatment with the standard drug and test groups significantly reduced MDA levels, demonstrating their antioxidant potential. GSH Levels (Figure 3B): A notable reduction in GSH levels was observed in the cholesterol-induced control group (p < 0.01), indicating impaired antioxidant defence mechanisms. However, treatment with the standard drug and test groups significantly elevated GSH levels (p < 0.001 to p < 0.0001), suggesting a protective effect against oxidative damage. SOD Levels (Figure 3C): The control and cholesterol-induced control groups showed no significant difference in SOD activity. However, the standard and test groups exhibited a mild but significant enhancement (p < 0.05 to p < 0.01), indicating a potential role in boosting enzymatic antioxidant activity. Catalase Levels (Figure 4D): Catalase activity was significantly lower in the cholesterol-induced control group compared to the normal control (p < 0.001), highlighting oxidative stress-related impairment. The standard and test groups significantly improved catalase levels (p < 0.05 to p < 0.0001), suggesting their role in restoring antioxidant enzyme function. The cholesterol-induced group exhibited elevated oxidative stress, as evident from increased MDA levels and reduced antioxidant enzyme activity (GSH, SOD and Catalase).
Histopathological analysis
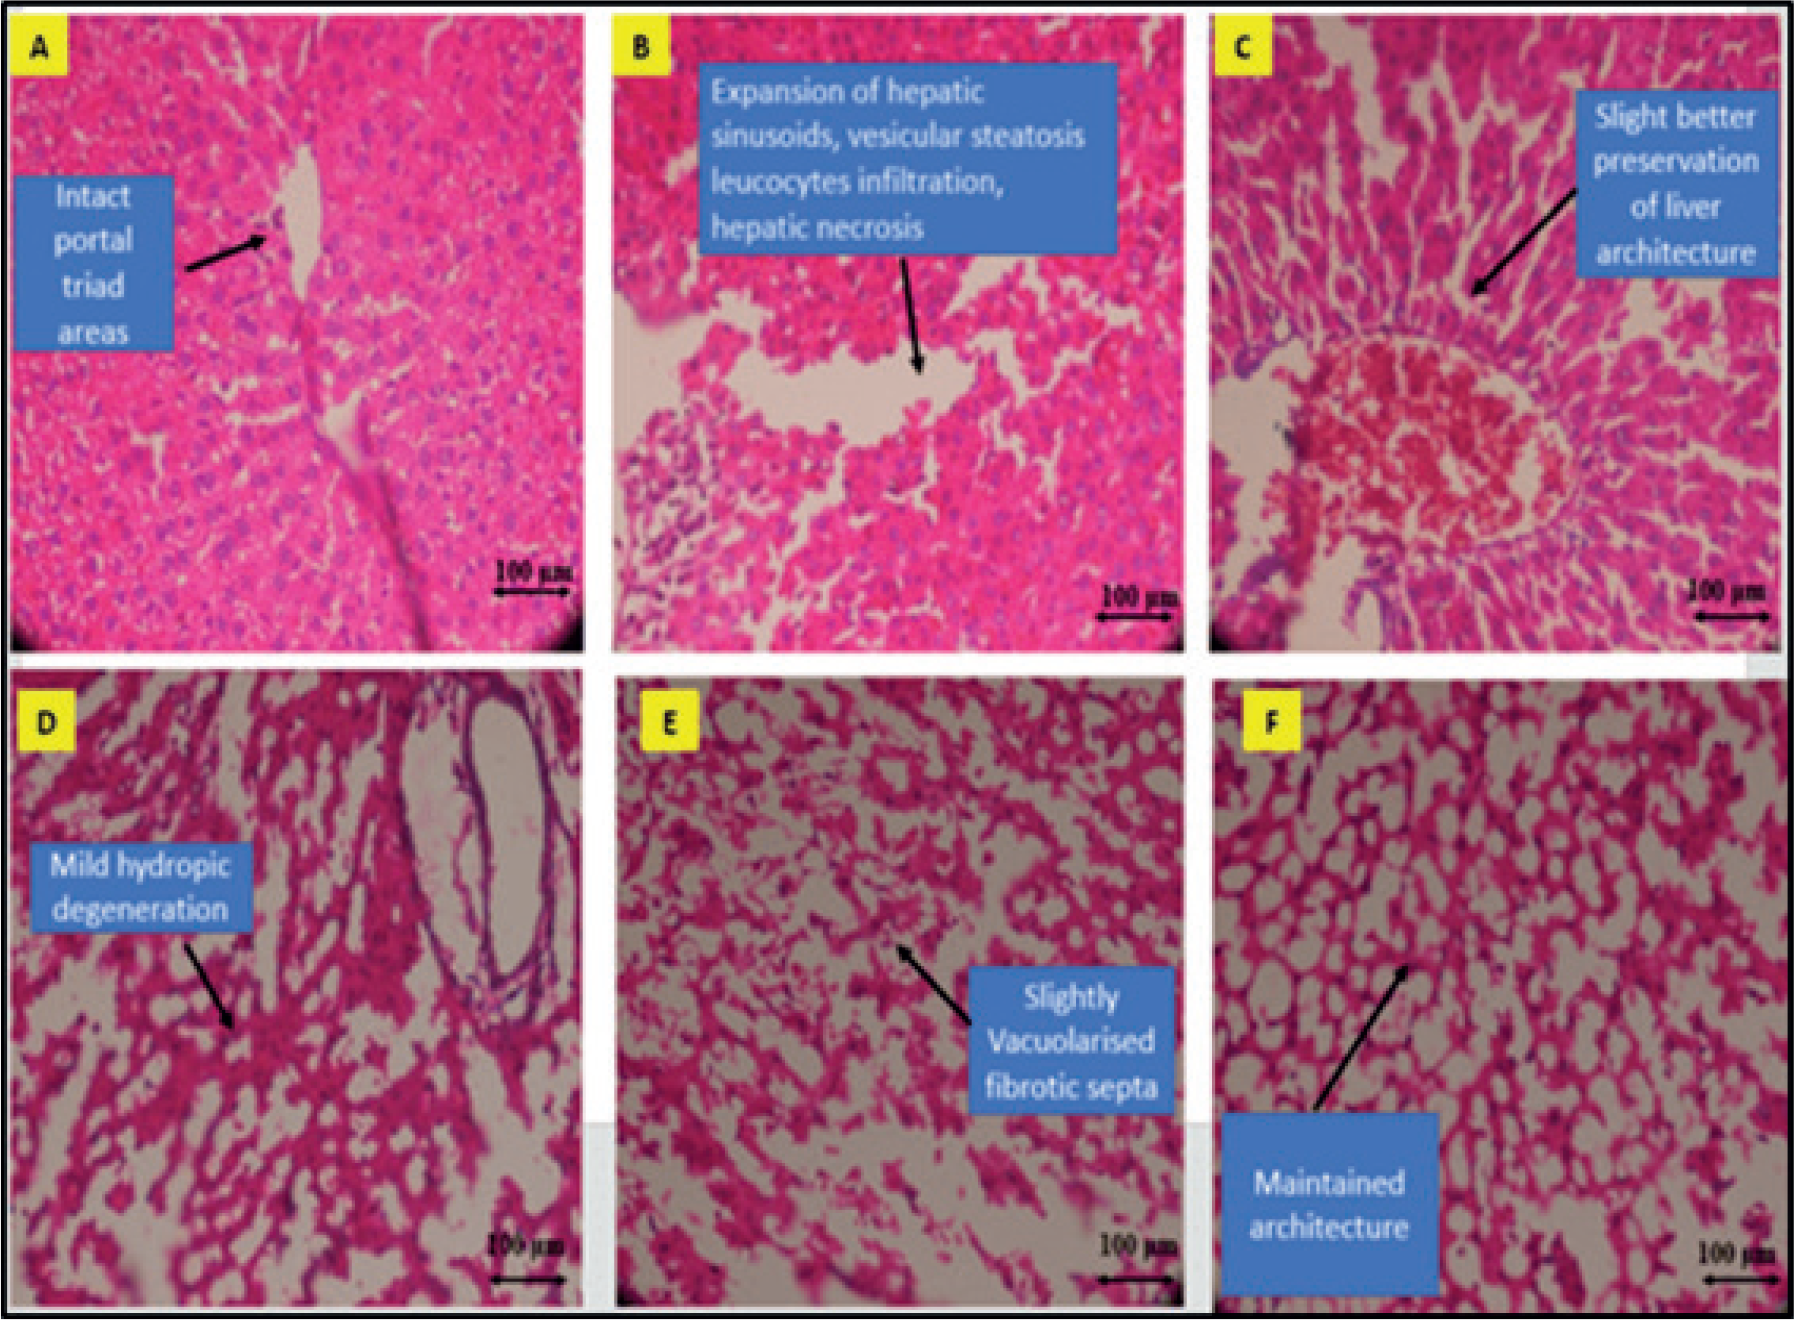
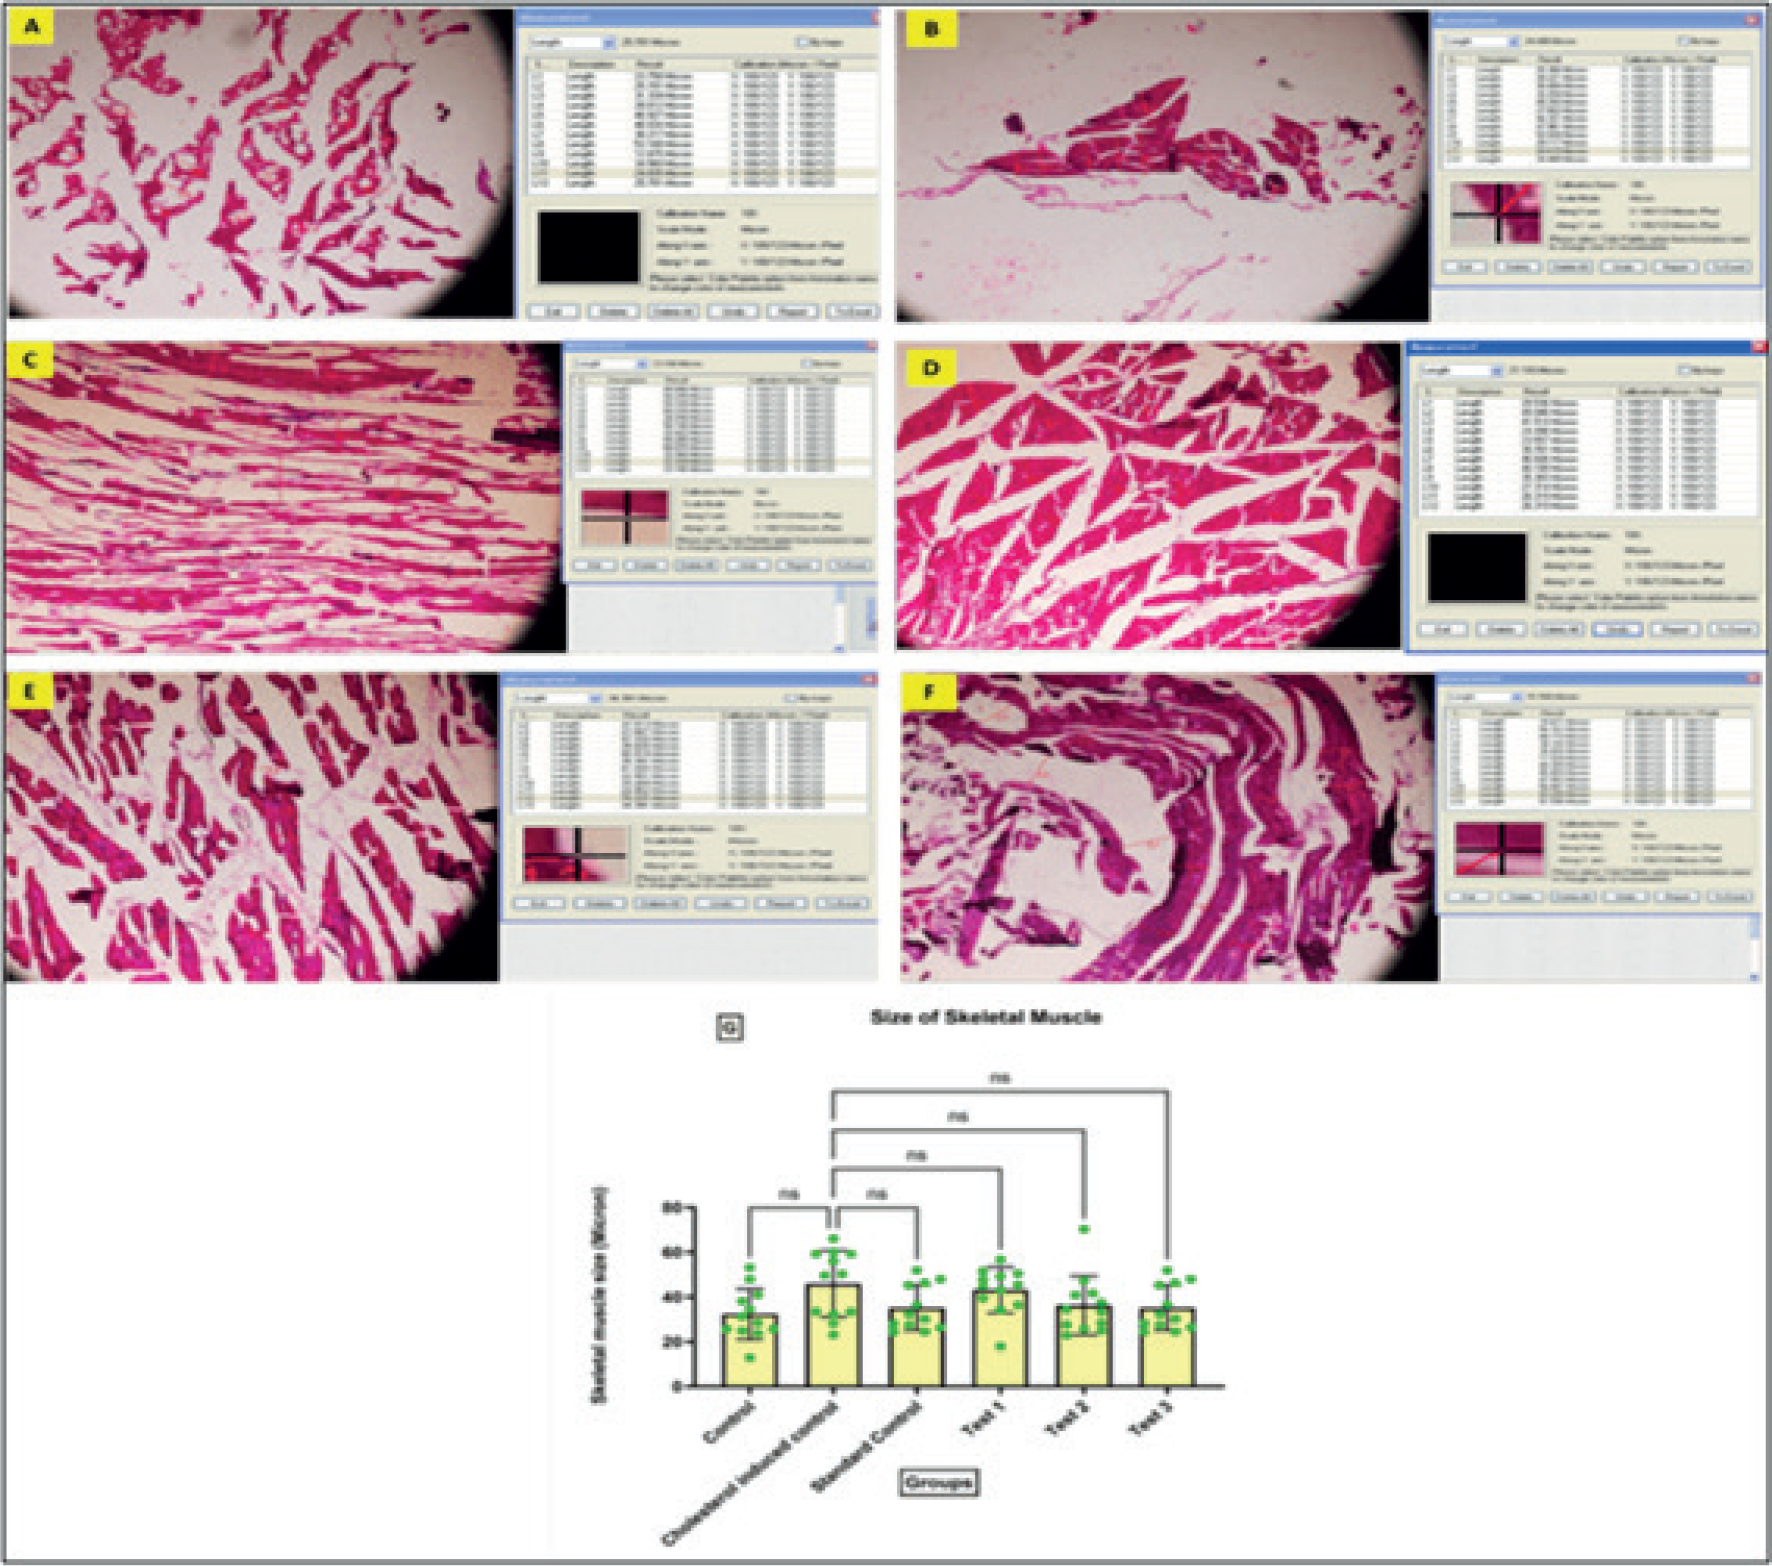
Microscopic examinations revealed that adipocyte size increased in cholesterol-rich diet induced control group of rats than in control group. Administration of CRETE and standard drugs partially restored adiposity indices and cell size (Figure 4). The control group showed a normal hepatic architectural pattern. In contrast, the negative control group exhibited a highly disorganized liver structure with vacuolated cells and large lipid droplets. Treatment with standard drugs and CRETE resulted in a decrease of lipid droplets around the centrilobular vein then the negative Control (Figure 5). Furthermore, histopathological changes in the skeletal muscle fibres suggest that a cholesterolrich diet leading to hyperlipidaemia has detrimental effects on muscle tissue. The presence of lipid droplets within muscle fibres indicates lipid accumulation, which can impair muscle function. All treatments to be used have a significant impact on skeletal muscle structure (Figure 6).

Images showing the histopathological study of adipocyte. All sections were stained with haematoxylin and eosin; Bar scale: 100 µm. (A) Control groups have visible signet-shaped cells. (B) The Cholesterol induced Control group showed a thin layer of cytoplasm with visible fat droplets. (C) Standard group, (D) Test Low dose, (E) Test Mediam dose and (F) Test High dose groups showed optimal adipocyte size than to the Negative Control. (G) Quantitative analysis of adipocyte size (µm2) among different groups, presented as mean ± S.E.M. The mean surface area for visceral white adipocytes was measured using Magnus Pro software. Statistical significance is indicated by **** (p < 0.0001). Data were analysed using ANOVA followed by Bonferroni's post-hoc test.
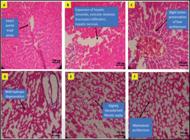
Images showing the histopathological examination of liver tissue on hyperlipidaemia induced by cholesterol-rich diet with a bar scale: 100 µm. (A) Image showing the control group showed normal architecture with intact portal triad areas. (B) Image showing the cholesterol induced control having dilation of hepatic sinusoids, vesicular steatosis, leucocytes infiltration, and hepatic necrosis. (C) Image showing the standard group having slightly better preservation of liver architecture. (D) Image showing the group IV i.e. low dose (100 mg/kg) of CRETE receiving rats, having mild hydropic degeneration in liver cells. (E) Image showing for rats received medium dose (200 mg/kg) of CRETE i.e. group V, having improved and slightly vascularized fibrotic septa. (F) Image showing the liver tissues of rats received high dose (400 mg/kg) of CRETE i.e. group VI, having maintained architecture of hepatic tissues.
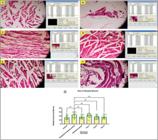
Images of skeletal muscle fibres showing the histopathological impact in the study for hyperlipidaemia induced by cholesterol-rich diet with a bar scale: 100 µm. (A) Image showing the control group has visible spindle-shaped nuclei located peripherally. (B) Image showing the cholesterol induced control has vacuolization in the skeletal muscle tissue along with degeneration of the skeletal muscle tissue. (C) Standard group, (D) Test Low dose, (E) Test Median dose and (F) Test High dose groups showed uniform size and shape with normal muscle fiber morphology and regularly spaced nuclei related with negative control group. (G) In quantitative analysis the bar graph represents the mean skeletal muscle fiber size (in microns) across different groups. The x-axis lists the groups: Control, Cholesterol-induced control, Standard control, Test 1, Test 2, Test 3. The y-axis represents the muscle fiber size (µm). Error bars indicate standard deviation. All measurements were done by using Magnus Pro software. Significance was represented as *p value less than 0.05 for comparisons between the control and cholesterol induced control. No important fluctuations were detected for other groups in contrast to negative control. ns means not significant.
Outcomes of Enzyme Activity Assays
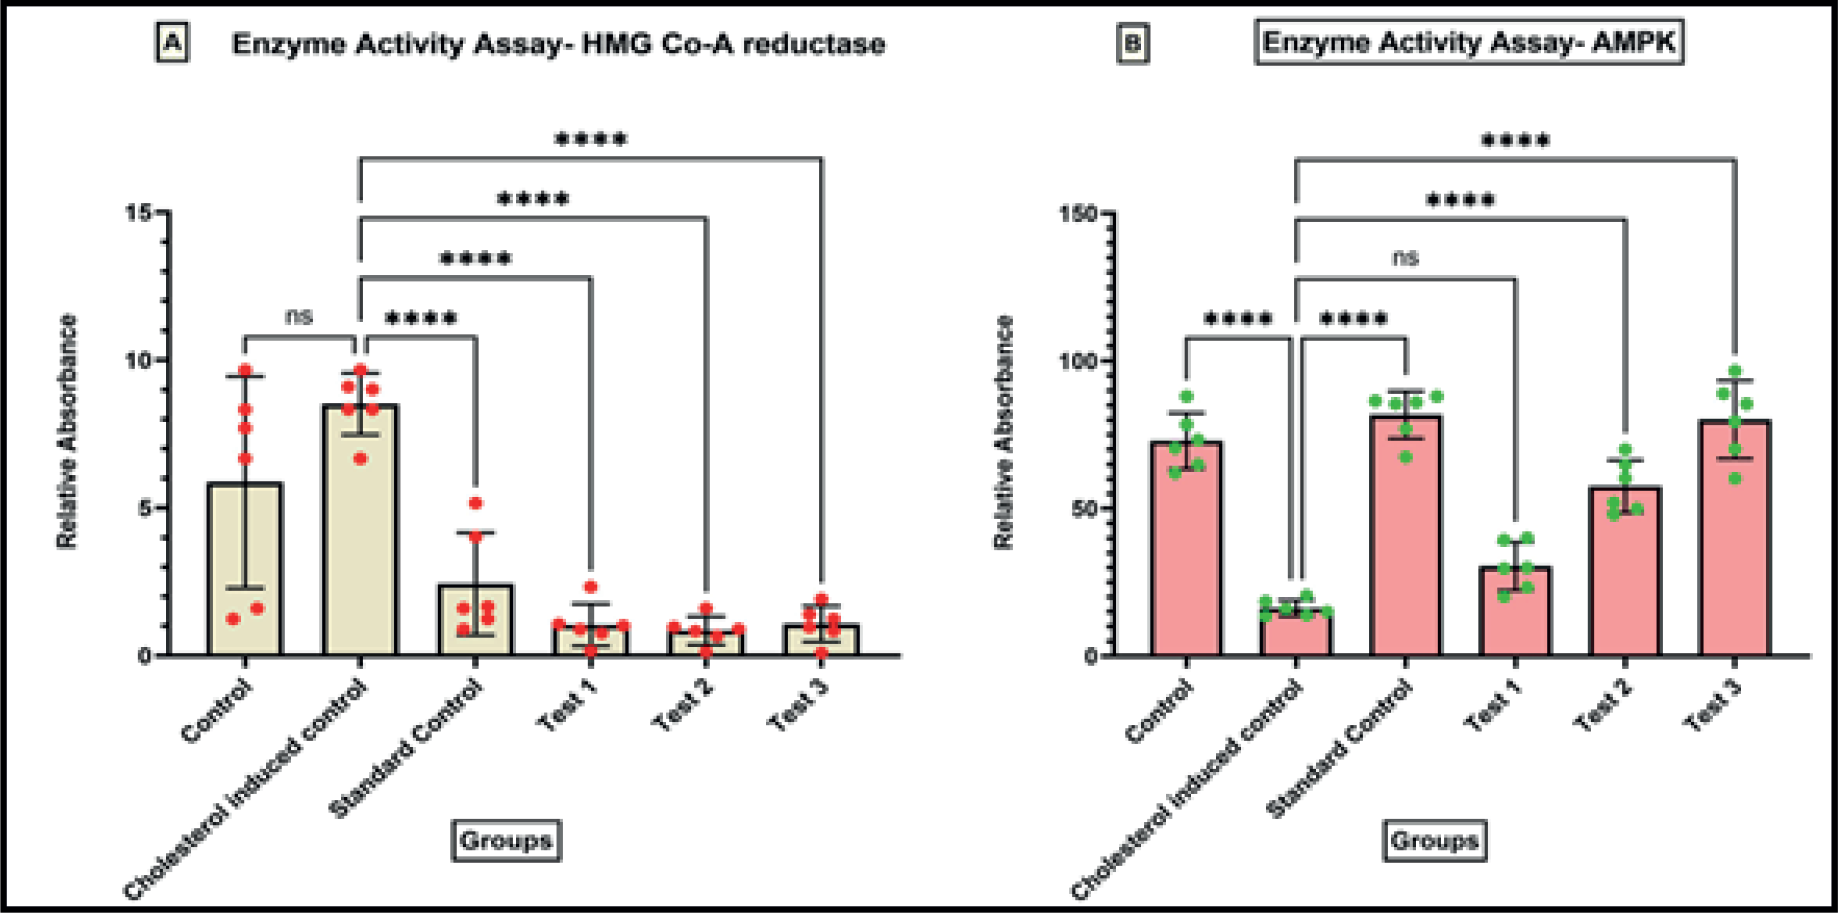
During hyperlipidaemia, the body increases HMGCoA reductase levels to produce more cholesterol, resulting in elevated blood lipid levels. AMPK activity was measured using an ATP depletion assay, which estimates cellular energy status. Since AMPK activation plays a role in lowering cholesterol and lipid accumulation, it is considered a promising approach for hyperlipidaemia management. Regulating cholesterol synthesis can be achieved by inhibiting HMG-CoA reductase and activating AMPK, which supports in lipid metabolism. (Figure 7).
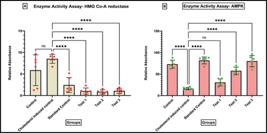
Graph showing the levels of HMG-CoA reductase and AMPK levels evaluated in hyperlipidaemic rats. (A) HMG-CoA reductase assay: The cholesterol-induced control group showed non-significantly increased HMG-CoA reductase level compared to the normal control. The standard control and test groups (Test 1, Test 2, Test 3) exhibited significantly HMG-CoA reductase level compared to the cholesterolinduced control group (p < 0.0001). (B) AMPK activity assay: The cholesterol-induced control group exhibited significantly reduced AMPK level compared to the normal control (p < 0.0001). The standard control and test groups (Test 2 and Test 3) showed a significant increase in AMPK level compared to the cholesterol-induced control, indicating potential therapeutic effects (p < 0.0001). But Test 1 has non-significant effect. All readings are represented in Mean ± SEM for each group (n = 6). **** indicates p less than 0.0001, while ns specifies no significant difference, with analysis accomplished through one-way ANOVA followed by Bonferroni's post hoc test.
Outcomes of Western blot analysis
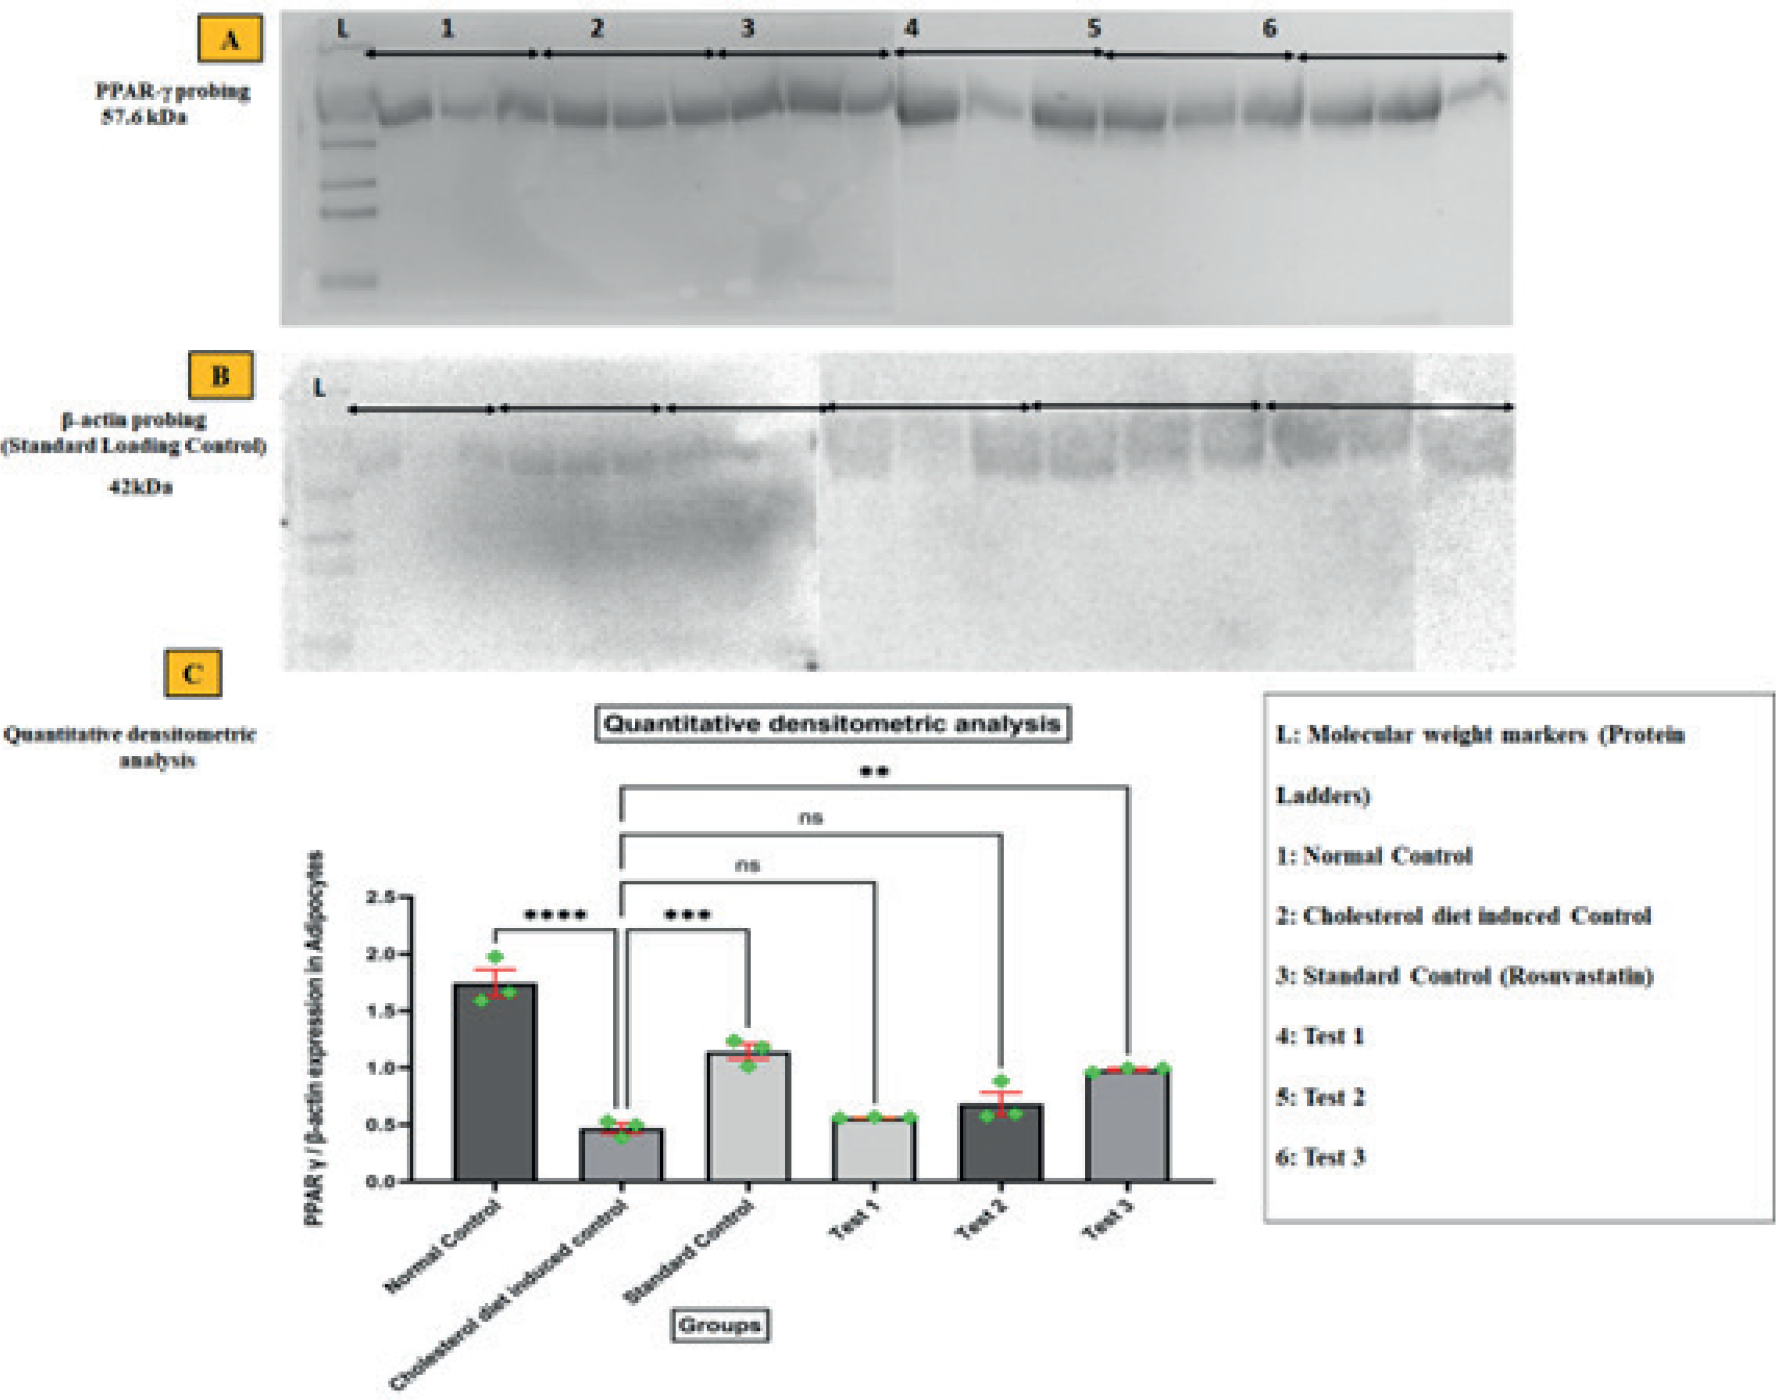
PPARγ significantly manages hyperlipidaemia through its effects on lipid storage in adipocytes by its expression level (Figure 8). PPARγ expression is significantly reduced in cholesterol diet induced control group compared to the normal control group. The standard control group and test 3 show partial restoration of PPARγ expression in adipocytes. The cholesterol diet induced hyperlipidaemia exhibited altered PPARγ expression in the densitometry analysis, depending on the severity and duration of hyperlipidaemia. Increased expression suggests compensatory adipogenesis, while decreased expression indicates metabolic dysfunction of lipid.
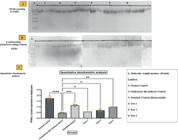
The image contains three panels (A, B, and C), representing Western Blot Analysis of PPARγ Protein Expression in Adipocyte. Panel A: Western blot analysis showing PPARγ protein expression across different experimental groups. Differences in band intensity indicate variations in PPARγ expression across experimental groups. Panel B: Total Protein Loading (β-Actin probing as a standard loading control). The panel likely represents presence of uniformly stained bands in each lane suggesting consistent protein loading. Panel C: Quantitative densitometry analysis of PPARγ expression normalized to β-actin. Data are presented as mean ± SEM. The bar graph presents PPARγ expression levels across different groups. Control group shows the highest expression of PPARγ. Cholesterol control group has significantly lower expression compared to the control. Standard control group shows an intermediate expression level. Test groups (Test 1, Test 2, and Test 3) exhibit reduced expression of PPARγ compared to the control, with some variation. Statistical significance is indicated as **** (p < 0.0001) between Control and Cholesterol control group, *** (p < 0.001) between Cholesterol control group and Standard Control, ** (p < 0.01) between Cholesterol control group and Test 3."ns" (not significant) indicates no significant difference between certain groups. Data from three images per group were analysed using ANOVA, followed by Bonferroni's post hoc test.
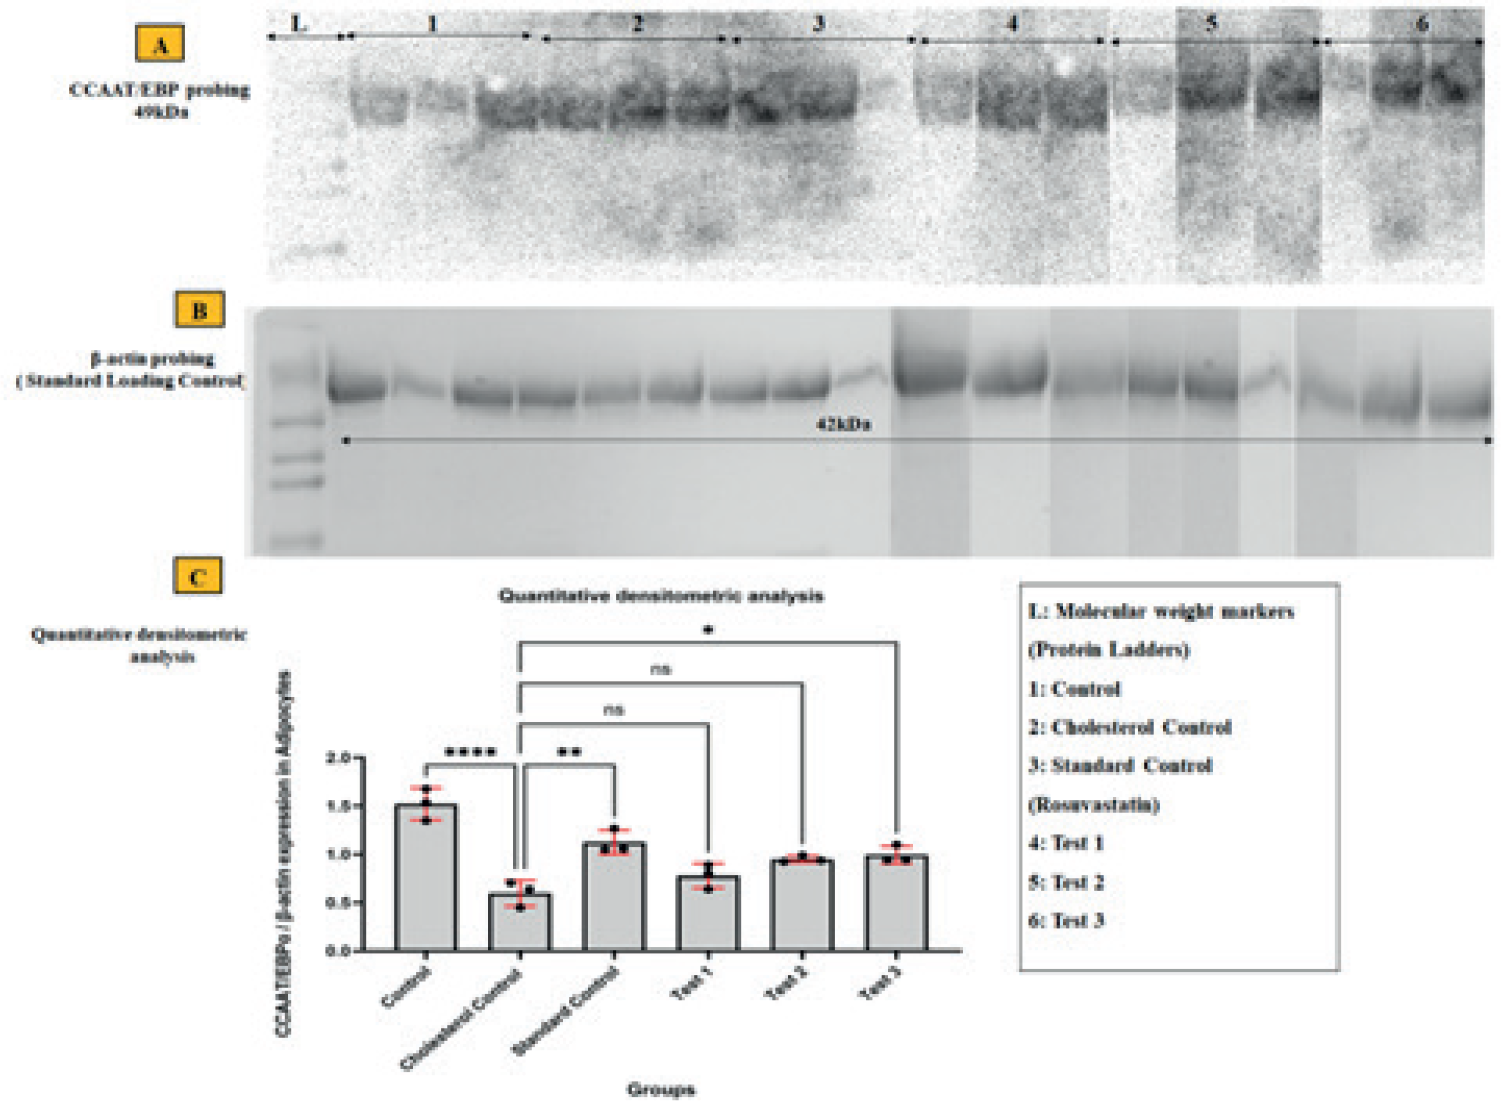
CCAAT/EBPα also plays a significant role in hyperlipidaemia management by directly affecting the appearance of genes encompassed in lipid formation and breakdown. Analysis was done by Bonferroni post hoc test (Figure 9).
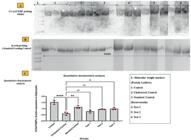
The Western blot analysis in illustrates the expression levels of CCAAT/EBPα protein across different experimental groups. Panel A (Western Blot for CCAAT/EBPα): The control group exhibits normal expression of CCAAT/EBPα, indicating a stable lipid metabolism condition. The cholesterol diet-induced group shows suppressed CCAAT/EBPα levels. The standard treatment group (Rosuvastatin-treated) shows partial recovery of CCAAT/EBPα expression, suggesting that statin therapy may help restore lipid metabolism balance. The test groups (Test 1, Test 2, Test 3) show a dose-dependent increase in CCAAT/EBPα expression, with Test 3 (400 mg/kg CRETE) showing the highest restoration. Panel B (β-Actin Loading Control): Ensure equal protein loading and confirming that observed variations in CCAAT/EBPα expression are relevant. Panel C (Quantitative Densitometry Analysis): The cholesterol-induced group has a significantly lower CCAAT/ EBPα/β-actin ratio, emphasizing that prolonged hyperlipidaemia suppresses adipogenic transcription factors. Test 3 (400 mg/kg CRETE) exhibits a statistically significant increase in CCAAT/EBPα expression (p<0.05, 1.255 ± 0.083), suggesting that higher doses of CRETE may effectively restore lipid regulatory mechanisms through the CCAAT/EBPα pathway. Data are presented as mean ± SEM, with statistical significance denoted as follows: *p˂0.05, **p < 0.01, ***p < 0.001, ****p < 0.0001; ns = not significant. In this study, the standard control group was treated with Rosuvastatin. Data from three images per group were analysed using ANOVA, followed by Bonferroni's post hoc test.
DISCUSSION
The Crateva religiosa bark extracts has different yields according to solvents to be used like 3.05% w/w with hexane, 11.98% w/w with ethyl acetate, and 15.81% w/w with ethanol.
Preliminary phytochemicals screening revealed the presence of important secondary metabolites like tannins, steroids, flavonoids, phenolic compounds, and terpenoids in both ethyl acetate and ethanol extract. In contrast, the hexane extract exhibited a low yield and lacked significant active constituents, leading to its exclusion from further research.
Quantitative analysis showed that the total phenolic content was 29.47 µg/mg equivalents to gallic acid in ethyl acetate extract and 81.19 µg/mg equivalents to gallic acid in CRETE. Similarly, the total flavonoid content measured 8.78 µg/mg equivalents to quercetin in ethyl acetate extract and 49.08 µg/mg equivalents to quercetin in CRETE, as mentioned in Table I. Plants with potential antihyperlipidemic effects generally possess high concentrations of phenols, flavonoids, carotenoids, and sterols, which provide antioxidant benefits. These phytochemicals have crucial role in managing hyperlipidaemia by lowering triglyceride levels, minimizing reactive oxygen species, inflammation and oxidative stress (Islam et al., 2021). CRETE exhibited the highest levels of total phenols and flavonoids contents hence it was chosen for subsequent investigations related to treatment of hyperlipidaemia.
GC-MS analysis of CRETE has given the confirmation for the presence of stigmasterol, gamma-sitosterol and lupeol as the key bioactive molecules (Table II) (Figure 1). These constituents are commonly found in traditional herbal remedies for treating hyperlipidaemia, attributed to their strong antioxidant properties that help mitigate oxidative stress. Consequently, plant extracts abundant in phenols and flavonoids are anticipated to exhibit considerable efficacy in managing hyperlipidaemia (Kumar et al., 2012).
Effects of CRETE were observed in dose dependent manner with respect of 100, 200 and 400 mg/kg doses on nourishing a cholesterol-rich meal to rats for nine weeks. During week 9th, the weight of cholesterolfed rats increased significantly. Nevertheless, the percentage change in weight was steady during weeks 3-6 but significantly reduced between the weeks 6-9 in contrast to control group (p<0.05) (Figure 2A). Percent change in food consumption per week was significant from week 0-6 and 0-9 suggesting its significance when compared to control group (Figure 2B) (Fang et al., 2015).
On the 9th week, at the same time as an increase in TC to 331.22 ± 1.97 (p less than 0.001 related to control), an increment (p less than 0.001) in TG and LDL-c levels to 165.15 ± 2.01 and 72.88 ± 1.51 mg/dl respectively occurred. However, cholesterol-rich diets decreased HDL-c levels up to 49.55 ± 6.36 within the cholesterol-induced group (Table III). Comparatively, all doses of CRETE effectively normalized TC, TG, and LDL-c levels. HDL-c values rose significantly after treatment with respective drugs, especially for high dose drug (133.48 ± 3.72), followed by medium dose (124.85 ± 3.72) and low-dose groups (113.10 ± 1 .45); all p<0 .001(Gamucci et al., 2012).
Atherogenic indices (AC, AIP, CRI-I & CRI-II), which are based on plasma lipid ratios, are commonly associated with dyslipidaemias and cardio-metabolic disorders. However, plasma HDL-c levels and plasma lipid ratios have a significant negative association. In 9th week, the negative control group exhibited CRI-I (p < 0.001; 6.77 ± 0.34), CRI-II (p < 0.01; 1.48 ± 0.07), AIP (p < 0.001; 0.53 ± 0.02), and AC (p < 0.001; 330.23 ± 0.81). Compared to the negative controls, all test groups receiving CRETE showed significant normalization of above discussed values (Table IV) (Adamu et al., 2020).
Serum biochemical findings from this study highlight the impact of cholesterol induction on oxidative stress markers. MDA is a well-established marker of lipid peroxidation, reflecting oxidative damage to cell membranes. In this study, the cholesterolinduced control group exhibited significantly elevated MDA levels (p < 0.0001) compared to the normal control, confirming excessive oxidative stress. The standard and test groups significantly reduced MDA levels, suggesting their potential in mitigating lipid peroxidation and protecting liver tissues from oxidative injury. GSH is a crucial non-enzymatic antioxidant that counteracts oxidative damage. The cholesterol-induced group showed a significant decline in GSH levels (p < 0.01), indicating weakened antioxidant defence mechanisms. However, the standard and test treatments restored GSH levels (p < 0.001 to p < 0.0001), suggesting their efficacy in replenishing the antioxidant system and reducing oxidative stress-related damage.
SOD and catalase are essential enzymatic antioxidants that neutralize reactive oxygen species. No significant difference in SOD levels was observed between the control and cholesterol-induced groups. However, test and standard groups showed a mild but significant increase in SOD levels (p < 0.05 to p < 0.01). Catalase was markedly reduced in the cholesterol-induced group (p < 0.001), signifying oxidative stress-related enzyme suppression. Treatment with the standard drug and test formulations significantly restored catalase activity (p < 0.05 to p < 0.0001). The results indicate that excess cholesterol leads to oxidative stress, as evidenced by increased MDA and compromised antioxidant defences (GSH, SOD, and catalase). Treatment with standard and test groups demonstrated antioxidant properties, effectively reducing oxidative damage. These findings suggest the potential of these treatments in ameliorating cholesterol-induced oxidative stress and protecting tissue from oxidative injury, which may be beneficial for managing hyperlipidaemia-related dysfunction (Figure 3) (Meharie, Amare, Belayneh, 2020).
Adipocyte sizes in different experimental groups were determined microscopically and significant differences were observed. The cholesterol induced control group showed much larger adipocytes than the control group, with ****p less than 0.0001 at 552.44 ± 103.07 against 36.62 ± 2.68 for the normal control. This indicates the increased size of fat cells as a consequence of hyperlipidaemia. The concomitant administration of plant extracts and standard drugs partially restored indices of adiposity and size of adipocytes, an indication of its therapeutic effect of reducing fat accumulation (Figure 4) (Andrich et al., 2018).
The observed differences in adipocyte morphology are crucial, as hypertrophic adipocytes are associated with inflammation and metabolic dysfunction. The significant decrease in adipocyte size in the treated groups suggests that the interventions may help regulate lipid metabolism and maintain healthy adipose tissue architecture. The statistical analysis using ANOVA with Bonferroni’s post-hoc test confirms the robustness of these findings, reinforcing the potential efficacy of the tested treatments in mitigating adipocyte hypertrophy.
This was further supported by liver histopathology. The Control group exhibited a normal liver architecture, while the Negative Control group displayed severe disorganization, including vacuolated cells and large lipid droplets (Figure 5) (Clark et al., 2011).
The histological analysis of skeletal muscle fibres highlights the effects of a cholesterol-rich diet on muscle structure and the potential benefits of treatment groups. The control group (Figure 6A) showed normal muscle fibres with spindle-shaped nuclei positioned at the edges, indicating healthy tissue. In contrast, the cholesterolinduced control group (Figure 6B) exhibited clear signs of damage, including vacuolization and muscle fibre degeneration, likely due to lipid accumulation.
The standard treatment group (Figure 6C) and the test groups (Figures 6D-F) maintained a more uniform muscle structure, resembling the control group. This suggests that the treatments may have helped protect against muscle deterioration.
The quantitative analysis (Figure 6G) supports these findings. Although the cholesterol-induced control group showed structural changes, the average muscle fibre size remained similar across all groups, as indicated by the lack of significant differences (ns). This suggests that while the cholesterol-rich diet caused muscle damage, it did not significantly alter fibre size. The consistency in muscle fibre size across the treated groups further indicates that the interventions helped preserve normal muscle structure without causing abnormal growth or shrinkage.
Overall, the results suggest that a cholesterol-rich diet negatively affects skeletal muscle, but the tested treatments may help maintain muscle integrity. Further studies could explore the mechanisms involved, such as their impact on lipid metabolism and inflammation (Iqbal et al., 2014).
The enzyme activity assays for HMG-CoA reductase and AMPK offer valuable mechanistic insights into the cholesterol-lowering potential of CRETE (Hardie, 2014). The cholesterol-induced control group exhibited a significant increase in HMGCoA reductase activity compared to the normal control, which aligns with the expected elevation of cholesterol synthesis in hyperlipidaemia (Loh et al., 2018). However, administration of CRETE (Test 1, Test 2, and Test 3) led to a substantial reduction in enzyme activity, bringing it to levels comparable to the cholesterolinduced group (p < 0.0001) (Figure 7). This suggests that CRETE may directly inhibit HMG-CoA reductase, thereby reducing cholesterol biosynthesis. AMPK is a key regulator of lipid metabolism, playing an essential role in fatty acid oxidation and cholesterol balance (Villarroya, Iglesias, Giralt, 2007). Unlike its effect on HMG-CoA reductase, CRETE low dose treatment (Test 1) did not significantly alter AMPK activity compared to the cholesterol-induced control (ns, non-significant). In contrast, the standard control group exhibited a notable increase in AMPK activity (p < 0.0001). These results suggest that CRETE’s cholesterol-lowering action is independent of AMPK activation, indicating that its primary mechanism involves direct inhibition of cholesterol biosynthesis rather than AMPKmediated metabolic regulation. The enzyme activity assays provide stronger evidence that CRETE lowers cholesterol levels primarily by inhibiting HMG-CoA reductase rather than activating AMPK. However, to further substantiate these findings, additional studies for Western blot analysis to evaluate PPARγ and CCAAT/EBPα protein expression in adipocytes were done, which could reveal potential adipogenic or lipid metabolism-related pathways.
PPARγ and CCAAT/EBPα protein levels were assessed across different groups using Western blotting to evaluate their impact on hyperlipidaemia management. PPARγ plays a key role in fat metabolism by supporting the transformation of preadipocytes into mature fat cells and enhancing lipid storage. In the early phase of hyperlipidaemia, its levels rise due to increased fat accumulation due to cholesterol diet. However, prolonged hyperlipidaemia and metabolic stress can lead to reduced PPARγ expression as fat cells become dysfunctional due to lipotoxicity. Findings from this study represented that control group has maintained normal PPARγ levels, indicating balanced lipid metabolism. Cholesterol induced group showed reduced PPARγ levels, likely due to long-term hyperlipidaemia causing fat cell dysfunction. Standard treatment group displayed partial improvement in PPARγ expression. Test groups (Test 1, Test 2, Test 3) demonstrated a dose-dependent rise in PPARγ levels, with Test 3 showing the greatest recovery. The highest CRETE dose significantly enhanced PPARγ expression (p < 0.01, 0.982 ± 0.0123), indicating its potential role in regulating lipid metabolism through the PPARγ pathway (Figure 8). (Huesca-Gomez et al., 2023; Castrejon-Tellez et al., 2016, Kim et al., 2012).
CCAAT/EBPα is vital for proper instruction of genes involved for lipid synthesis as well as degradation. It has a multifunctional role in the regulation of adipogenesis as well as the metabolism of lipids. Analysis of Western blot exposed that the appearance of CCAAT/EBPα in the Cholesterol induced group differed from that in the Control group. CCAAT/EBPα is down regulated in the cholesterol-induced group; highlighting metabolic deregulation in hyperlipidaemia (Guo, Li, Tang, 2015; Pedersen et al., 2007). Various dosages of CRETE had distinct effects on CCAAT/EBPα expression. Notably, the expression level of CCAAT/EBPα meaningfully amplified in the high dose groups, with *p value less than 0.05 ((1.255 ± 0.083) (Figure 9). These findings suggest that CRBE may support lipid metabolism by upregulating adipogenic transcription factors like CCAAT/EBPα, making it a potential therapeutic candidate for managing hyperlipidaemia. Overall, CRETE was shown to modulate protein levels involved in the lipid metabolism pathway. Up-regulation of PPARγ and CCAAT/EBPα at higher doses indicates that the extract may benefit lipid metabolism via enhanced lipid storage regulation, energy expenditure promotion, and lipid breakdown facilitation (Lee et al., 2019; Barnstable, Zhang, Tombran-Tink, 2022).
CONCLUSION
CRETE showed considerable hypolipidemic potential through normalization of oxidative stress and lipid profiles, and improved the histopathological conditions in hyperlipidaemic rats. The therapeutic effect of CRETE is facilitated through modulation of the lipid metabolism pathways by up-regulation of PPARγ and CCAAT/EBPα but not by activation of AMPK. These findings suggest that CRETE could turn into a useful therapeutic agent in managing of hyperlipidaemia and its related problems.
ACKNOWLEDGMENTS
We would like to extend our sincere appreciation to I.T.S College of Pharmacy, Ghaziabad, for giving essential facilities to conduct the research work.
FUNDING STATEMENT
ETHICS APPROVAL
All animal-related experiments and procedures were directed according to the guidelines set through the ethical board of ITS College of Pharmacy, Ghaziabad, India. The institution ensured that all activities complied with its regulations for the maintenance and management of investigational rats.
HUMAN AND ANIMAL RIGHTS
Human subjects were not included in this experiment. Animals’ experiment was carried out following the protocols detailed in the eighth edition of the Guide for the Care and Use of Laboratory Animals and published by National Academy of Sciences, The National Academies Press, Washington DC, USA.
DATA AVAILABILITY STATEMENT
All data is available within the article or its supplementary materials.
REFERENCES
- Adamu BA, Emiru YK, Sintayehu B, Araya EM, Periasamy G, Gebrelibanos Hiben M. In vivo Hepatoprotective and in vitro Radical Scavenging Activities of Extracts of Rumex abyssinicus Jacq. Rhizome. J Exp Pharmacol. 2020;12:221-231.
- Andreadou I, Schulz R, Badimon L, Adameova A, Kleinbongard P, Lecour S, et al. Hyperlipidaemia and cardio-protection: Animal models for translational studies. Br J Pharmacol. 2020;177:5287-5311.
- Andrich DE, Ou Y, Melbouci L, Leduc-Gaudet JP, Auclair N, Mercier J, et al. Altered Lipid Metabolism Impairs Skeletal Muscle Force in Young Rats Submitted to a Short-Term High-Fat Diet. Front Physiol. 2018;9:1327.
- Andrus SB, Fillios LC, Mann GV, Stare FJ. Experimental production of gross atherosclerosis in the rat. J Exp Med. 1956;104:539-54.
- Ashafa AO, Orekoya LO, Yakubu MT. Toxicity profile of ethanolic extract of Azadirachta indica stem bark in male Wistar rats. Asian Pac J Trop Biomed. 2012;2:8117.
- Barnstable CJ, Zhang M, Tombran-Tink, J. Uncoupling Proteins as Therapeutic Targets for Neurodegenerative Diseases. Int J Mol Sci. 2022;23:5672.
- Basu D, Huggins LA, Scerbo D, Obunike J, Mullick AE, Rothenberg PL, et al. Mechanism of Increased LDL (Low-Density Lipoprotein) and Decreased Triglycerides with SGLT2 (Sodium-Glucose Cotransporter 2) Inhibition. Arterioscler ThrombVasc Biol. 2018;38:2207-2216.
- Bhardwaj S, Bhattacharjee J, Bhatnagar MK, Tyagi S. Atherogenic Index of Plasma, Castelli Risk Index and Atherogenic Coefficient- New Parameters In Assessing Cardiovascular Risk, Int J Pharm Biol. 2013;3:359-364.
- Blainski A, Lopes GC, De Mello JC. Application and analysis of the folin ciocalteu method for the determination of the total phenolic content from Limonium brasiliense L. Molecules. 2013;18:6852-65.
- Bruckert E. New advances in lipid-modifying therapies for reducing cardiovascular risk. Cardiology. 2002;97(2):59-66.
- Busiello RA, Savarese S, Lombardi A. Mitochondrial uncoupling proteins and energy metabolism. Front Physiol. 2015;6:36.
- Castrejon-Tellez V, Rodriguez-Perez JM, Perez-Torres I, Perez-Hernandez N, Cruz-Lagunas A, GuarnerLans V, et al. The Effect of Resveratrol and Quercetin Treatment on PPAR Mediated Uncoupling Protein (UCP-) 1, 2, and 3 Expression in Visceral White Adipose Tissue from Metabolic Syndrome Rats. Int J Mol Sci. 2016;17:1069.
- Clark BA, Alloosh M, Wenzel JW, Sturek M, Kostrominova TY. Effect of diet-induced obesity and metabolic syndrome on skeletal muscles of Ossabaw miniature swine. Am J Physiol Endocrinol Metab. 2011;300:e848-57.
- Coelho M, Oliveira T, Fernandes R. Biochemistry of adipose tissue: an endocrine organ. Arch Med Sci. 2013;9:191-200.
- Debril MB, Renaud JP, Fajas L, Auwerx J. The pleiotropic functions of peroxisome proliferator-activated receptor gamma. J Mol Med (Berl). 2001;79:30-47.
- Dhingra D, Lamba D, Kumar R, Nath P, Gauttam S. Antihyperlipidemic Activity of Aloe succotrina in Rats: Possibly Mediated by Inhibition of HMG-CoA Reductase. ISRN Pharmacol. 2014;2014:243575.
- Elmowafy M, Ibrahim HM, Ahmed MA, Shalaby K, Salama A, Hefesha H. Atorvastatin-loaded nanostructured lipid carriers (NLCs): strategy to overcome oral delivery drawbacks. Drug Deliv. 2017; 24: 932-941.
- Fajas L, Debril MB, Auwerx J. Peroxisome proliferatoractivated receptor-gamma: from adipogenesis to carcinogenesis. J Mol Endocrinol. 2001;27:1-9.
- Fang L, Guo F, Zhou L, Stahl R, Grams J. The cell size and distribution of adipocytes from subcutaneous and visceral fat is associated with type 2 diabetes mellitus in humans. Adipocyte. 2015;4:273-9.
- Fava F, Lovegrove JA, Gitau R, Jackson KG, Tuohy KM. The gut microbiota and lipid metabolism: implications for human health and coronary heart disease. Curr Med Chem. 2006;13:3005-21.
- Gamucci O, Lisi S, Scabia G, Marchi M, Piaggi P, Duranti E, et al. Haptoglobin deficiency determines changes in adipocyte size and adipogenesis. Adipocyte. 2012;1:142-183.
- Ghezzi AC, Cambri LT, Botezelli JD, Ribeiro C, Dalia RA, de Mello MA. Metabolic syndrome markers in wistar rats of different ages. DiabetolMetabSyndr. 2012;4:16.
- Giustarini D, Fanti P, Matteucci E, Rossi R. Micromethod for the determination of glutathione in human blood. J Chromatogr B Analyt Technol Biomed Life Sci. 2014;964:191-4.
- Gregory M, Divya B, Mary RA, Viji MM, Kalaichelvan VK, Palanivel V. Anti-ulcer activity of Ficus religiosa leaf ethanolic extract. Asian Pac J Trop Biomed. 2013;3:554-6.
- Guo L, Li X, Tang QQ. Transcriptional regulation of adipocyte differentiation: a central role for CCAAT/ enhancer-binding protein (C/EBP) β. J Biol Chem. 2015;290:755-61.
- Hardie DG. AMP-activated protein kinase: maintaining energy homeostasis at the cellular and whole-body levels. Annu Rev Nutr. 2014;34:31-55.
- Huesca-Gomez C, Torres-Paz YE, Fuentevilla-Alvarez G, Gonzalez-Moyotl NJ, Ramirez-Marroquin ES, Vasquez-Jimenez X, et al. Expressions of mRNA and encoded proteins of mitochondrial uncoupling protein genes (UCP1, UCP2, and UCP3) in epicardial and mediastinal adipose tissue and associations with coronary artery disease. Arch Endocrinol Metab. 2023;67:214-223.
- Iqbal D, Khan MS, Khan A, Khan MS, Ahmad S, Srivastava AK, et al. In vitro screening for β-hydroxy-βmethylglutaryl-CoA reductase inhibitory and antioxidant activity of sequentially extracted fractions of Ficus palmate Forsk. Biomed Res Int. 2014;2014:762620.
- Islam SU, Ahmed MB, Ahsan H, Lee YS. Recent Molecular Mechanisms and Beneficial Effects of Phytochemicals and Plant-Based Whole Foods in Reducing LDL-C and Preventing Cardiovascular Disease. Antioxidants (Basel). 2021;10:784.
- Jezek P, Jaburek M, Porter RK. Uncoupling mechanism and redox regulation of mitochondrial uncoupling protein 1 (UCP1). Biochim Biophys Acta Bioenerg. 2019;1860:259-269.
- John J, Nampoothiri M, Kumar N, Mudgal J, Nampurath GK, Chamallamudi MR. Sesamol, a lipid lowering agent, ameliorates aluminium chloride induced behavioral and biochemical alterations in rats. Pharmacogn Mag. 2015;11:327-36.
- Khandelwal KR. Practical Pharmacognosy. 9th Edition, Delhi: Nirali Prakashan; 2002. 149-153.
- Kim JA, Montagnani M, Chandrasekran S, Quon MJ. Role of lipotoxicity in endothelial dysfunction. Heart Fail Clin. 2012;8:589-607.
- Krause BR, Newton RS. Lipid-lowering activity of atorvastatin and lovastatin in rodent species: triglyceride-lowering in rats correlates with efficacy in LDL animal models. Atherosclerosis. 1995;117:237-44.
- Kumar DG, Deepa P, Rathi MA, Meenakshi P, Gopalakrishnan VK. Modulatory effects of Crataeva nurvala bark against testosterone and N-methyl-Nnitrosourea-induced oxidative damage in prostate of male albino rats. Pharmacogn Mag. 2012;8:285-91.
- Kumar V, Sharma P, Bairagya HR, Sharma S, Singh TP, Tiku PK. Inhibition of human 3-hydroxy-3methylglutaryl CoA reductase by peptides leading to cholesterol homeostasis through SREBP2 pathway in HepG2 cells. Biochim Biophys Acta Proteins Proteom. 2019;1867:604-615.
- Kupfer D, Munsell T. A colorimetric method for the quantitative determination of reduced pyridine nucleotides (NADPH and NADH). Anal Biochem. 1968;25:10-16.
- Lee JE, Schmidt H, Lai B, Ge K. Transcriptional and Epigenomic Regulation of Adipogenesis. Mol Cell Biol. 2019;39:e00601-18.
- Loh K, Tam S, Murray-Segal L, Huynh K, Meikle PJ, Scott JW, et al. Inhibition of Adenosine Monophosphate-Activated Protein Kinase-3-Hydroxy3-Methylglutaryl Coenzyme A Reductase Signaling Leads to Hypercholesterolemia and Promotes Hepatic Steatosis and Insulin Resistance. Hepatol Commun. 2018;3:84-98.
- Lowry OH, Rosebrough NJ, Farr AL, Randall RJ. Protein measurement with the Folin phenol reagent. J Biol Chem. 1951;193:265-75.
- Mahmoodi MR, Najafipour H. Associations between serum vitamin D3, atherogenic indices of plasma and cardiometabolic biomarkers among patients with diabetes in the KERCADR study. BMC Endocr Disord. 2022;22:126.
- Meharie BG, Amare GG, Belayneh YM. Evaluation of Hepatoprotective Activity of the Crude Extract and Solvent Fractions of Clutiaabys sinica (Euphorbiaceae) Leaf Against CCl4-Induced Hepatotoxicity in Mice. J ExpPharmacol. 2020;12:137-150.
- Mengesha T, Gnanasekaran N, Mehare T. Hepatoprotective effect of silymarin on fructose induced nonalcoholic fatty liver disease in male albino wistar rats. BMC Complement Med Ther. 2021;21:104.
- Meriga B, Ganjayi MS, Parim BN. Phytocompounds as Potential Agents to Treat Obesity-Cardiovascular Ailments. Cardiovasc Hematol Agents Med Chem. 2017;30.
- Nadkami KM. Indian Materia Medica. Bombay: Popular Prakashan; 2017. 388.
- Niki E, Yoshida Y, Saito Y, Noguchi N. Lipid peroxidation: mechanisms, inhibition, and biological effects. Biochem Biophys Res Commun. 2005;338(1):668-76.
- Nortjie E, Basitere M, Moyo D, Nyamukamba P. Extraction methods, quantitative and qualitative phytochemical screening of medicinal plants for antimicrobial textiles: a review. Plants. 2022;11:2011.
- Odukoya JO, Odukoya JO, Mmutlane EM, Ndinteh DT. Ethnopharmacological Study of Medicinal Plants Used for the Treatment of Cardiovascular Diseases and Their Associated Risk Factors in sub-Saharan Africa. Plants (Basel). 2022;11:1387.
- OECD Guidelines for the testing of chemicals, revised draft guidelines 423: Acute Oral toxicity- Acute toxic class method, revised document, CPCSEA, Ministry of Social Justice and Empowerment, Govt. of India. 2000.
- Ohkawa H, Ohishi N, Yagi K. Assay for lipid peroxides in animal tissues by thiobarbituric acid reaction, Anal Biochem. 1979;95:351-358.
- Parveen M, Azeem M, Aslam A, Azam M, Siddiqui S, Tabish M, et al. Isolation, Identification, Spectral Studies and X-ray Crystal Structures of Two Compounds from Bixa orellana, DFT Calculations and DNA Binding Studies. Crystals. 2022;12(3):380.
- Pedersen TA, Bereshchenko O, Garcia-Silva S, Ermakova O, Kurz E, Mandrup S, et al. Distinct C/EB Palpha motifs regulate lipogenic and gluconeogenic gene expression in vivo. EMBO J. 2007;26:1081-93.
- Ross FA, Jensen TE, Hardie DG. Differential regulation by AMP and ADP of AMPK complexes containing different γ subunit isoforms. Biochem J. 2016;473:18999.
- Roy A, Khan A, Ahmad I, Alghamdi S, Rajab BS, Babalghith AO, et al. Flavonoids a Bioactive Compound from Medicinal Plants and Its Therapeutic Applications. Biomed Res Int. 2022;2022:5445291.
- Ruotolo G, Howard BV. Dyslipidemia of the metabolic syndrome. Curr Cardiol Rep. 2002;4:494-500.
- Sikarwar MS, Patil MB. Antihyperlipidemic activity of Salacia chinensis root extracts in triton-induced and atherogenic diet-induced hyperlipidemic rats. Indian J Pharmacol. 2012;44:88-92.
- Sztolsztener K, Bzdęga W, Hodun K, Chabowski A. N-Acetylcysteine Decreases Myocardial Content of Inflammatory Mediators Preventing the Development of Inflammation State and Oxidative Stress in Rats Subjected to a High-Fat Diet. Int J Inflam. 2023;2023:5480199.
- Tao C, Sifuentes A, Holland WL. Regulation of glucose and lipid homeostasis by adiponectin: effects on hepatocytes, pancreatic β cells and adipocytes. Best Pract Res Clin Endocrinol Metab. 2014;28:43-58.
- Tipple TE, Rogers LK. Methods for the determination of plasma or tissue glutathione levels. Methods Mol Biol. 2012;889:315-24.
- Tungmunnithum D, Thongboonyou A, Pholboon A, Yangsabai A. Flavonoids and Other Phenolic Compounds from Medicinal Plants for Pharmaceutical and Medical Aspects: An Overview. Medicines (Basel). 2018;5:93.
- Unger RH, Clark GO, Scherer PE, Orci L. Lipid homeostasis, lipotoxicity and the metabolic syndrome. Biochim Biophys Acta. 2010;1801:209-14.
- Varga T, Czimmerer Z, Nagy L. PPARs are a unique set of fatty acid regulated transcription factors controlling both lipid metabolism and inflammation. Biochim Biophys Acta. 2011;1812:1007-22.
- Villarroya F, Iglesias R, Giralt M. PPARs in the Control of Uncoupling Proteins Gene Expression. PPAR Res. 2007;2007:74364.
- Vogel HG. Drug Discovery and Evaluation: Pharmacological Assays. Second Edition. SpringerVerlag 2002.
- Yan Y, Gu X, Xu HE, Melcher K. A Highly Sensitive Non-Radioactive Activity Assay for AMP-Activated Protein Kinase (AMPK). Methods Protoc. 2018;1:3.
- Zhou M, Zhu L, Cui X, Feng L, Zhao X, He S, et al. The triglyceride to high-density lipoprotein cholesterol (TG/HDL-C) ratio as a predictor of insulin resistance but not of β cell function in a Chinese population with different glucose tolerance status. Lipids Health Dis. 2016;15:104.