 Pɸ-mi-pa loaded PVA/HA electrospun nanofibers from a statistically designed experiment using machine learning algorithms
Abstract
Bacteriophages, which infect bacterial cells, have a unique ability to reduce bacterial colonization, particularly in antibiotic-resistant biofilm infections. This study aims to fabricate optimized bacteriophage-loaded nanofibers composed of polyvinyl alcohol (PVA) and hyaluronic acid (HA) using machine learning techniques. A comparative analysis was conducted to determine the most efficient machine learning algorithm for this purpose. The eXtreme Gradient Boosting (XGBoost) algorithm was used to optimize three sets of bacteriophage-loaded nanofibers-GA1, GA2, and GA3-at varying sonication times. The nanofibers were characterized using Fourier-transform infrared spectroscopy (FTIR), scanning electron microscopy (SEM), X-ray diffraction (XRD), differential scanning calorimetry (DSC), mucoadhesion analysis, thermogravimetric analysis, tensile strength analysis, and a bacteriophage release assay. SEM analysis revealed that GA3 exhibited homogeneous, well-aligned, defect-free polymer fibers with smooth surfaces, whereas GA1 and GA2 contained bead-like structures. Thermal degradation occurred between 300 °C and 368 °C, with GA1 displaying the highest tensile strength. Predicted values for mucin adsorption and bacteriophage release closely aligned with experimental data, confirming the accuracy of the XGBoost model. Finally, the release of MDR-specific phage Pɸ-Mi-Pa from the optimized nanofibers was highest at pH 5, which is similar to vaginal pH. These findings highlight the potential of these nanofibers for phage therapy, particularly in improving the prognosis of antibiotic-resistant biofilm infections.
Keywords:
Artificial neural network; Bacteriophages; Electrospun; Hyaluronic acid; Nanofibers; Polyvinyl alcohol.
INTRODUCTION
Bacteriophages are viruses that infect bacterial cells and reduce the colonization of antibiotic-resistant biofilms. Bacterial infections caused by resistant strains can develop when bacterial cells organize into biofilms-dense microbial communities encased in an extracellular polymeric substance that serves as a physical barrier, protecting them from antibiotics (Silva et al., 2021). Bacteriophages offer distinct advantages over antibiotics. Unlike antibiotics, which require chemical synthesis, bacteriophages are naturally occurring, cost-effective, and widely accessible. Their mechanism of action involves adsorption onto bacterial cells, followed by the injection of their deoxyribonucleic acid (DNA), which leads to bacteriophage replication and subsequent bacterial cell lysis. Due to this targeted approach, bacteriophage therapy presents a promising alternative to conventional antibiotics for combating resistant bacterial infections (Jolivet-Gougeon, Bonnaure-Mellet, 2014).
Phage therapy has gained popularity due to its effective mechanism of bacterial elimination; however, it also presents certain challenges, one of which is its poor stability in solution during long-term storage (Malik et al., 2017). A potential solution to this issue is the application of electrospinning, a technique that produces highly stable and easily fabricated fibers. Electrospun fibers are porous and capable of accommodating high concentrations of bacteriophages. Once loaded, these fibers serve as carriers for targeted bacteriophage delivery to the infection site. Electrospinning bacteriophage-loaded solutions with polymers such as polyvinyl alcohol (PVA) and hyaluronic acid (HA) enhances bacteriophage stability and ensures safe and effective antibacterial action (Luraghi, Peri, Moroni, 2021).
The electrospinning process involves applying high voltage and low current to a polymer solution, causing the polymer to stretch under electric forces and ultimately form fibers on a metal collector (Cardoso-Daodu et al., 2022). Nanofibers for drug delivery have broad applications, including wound healing, cancer management, and infection treatment. Nanofibers closely resemble the extracellular matrix and help prevent the systemic accumulation of free drugs or bacteriophages by providing sustained local release at the target site. Factors such as morphology, surface area, and porosity directly influence drug release, making it necessary to fine-tune these properties by adjusting processing conditions. Key parameters that may be optimized for effective phage delivery include polymer concentration, sonication duration, needle-to-collector gap distance, polymer solution flow rate, applied voltage, and needle diameter (Luraghi, Peri, Moroni, 2021).
To optimize the independent factors in the electrospinning process, machine learning algorithms such as artificial neural networks (ANNs), random forest (RF), and eXtreme Gradient Boosting (XGBoost) can be applied (Cardoso-Daodu et al., 2022). Among these, XGBoost is particularly notable for its efficiency and flexibility as a machine learning model (Khamparia, 2020). In this study, the relationship between the input factors (polymer concentration and sonication time) and the dependent variables (percentage mucin adsorption and bacteriophage release) was analyzed using the XGBoost algorithm. Khatti et al. (2017) demonstrated XGBoost can accurately determine the optimal polymer concentration and sonication time required for ideal experimental conditions. These optimized values were subsequently used to develop bacteriophage-loaded nanofibers designed for efficient phage delivery to the target site.
This study aims to develop optimized bacteriophage-loaded PVA/HA nanofibers by identifying the best-performing machine learning algorithms and subsequently applying optimization algorithms to enhance the formulation process. The novelty of this work lies in the statistical design of specific experimental processes to optimize drug delivery. Furthermore, this study goes beyond statistical prediction and optimization of experimental conditions using artificial intelligence. It provides detailed specifications for the preparation of nanofibers with exceptional properties and functional features. To the best of our knowledge, no previous study has explored this approach. The successful formulation of optimized bacteriophage-loaded PVA/HA nanofibers through statistically designed experiments could pave the way for improved prognosis in the treatment of antibiotic-resistant biofilm infections, such as bacterial vaginosis, via phage therapy.
MATERIAL AND METHODS
Material
PVA was purchased from Sigma-Aldrich (St. Louis, USA), while HA was obtained from Surfachem (UK). Acetic acid was sourced from DBS Chemicals (India), and sodium chloride and ethanol were purchased from Fisher Scientific (Loughborough, UK). Disodium hydrogen phosphate and potassium dihydrogen orthophosphate anhydrous (98% extra pure) were obtained from Loba Chemie PVT. LTD, while phosphate buffer was purchased from Loba Chemie (Mumbai, India).
Design of experiments
The experiment was designed using a three-variable, five-level central composite design (CCD) and implemented with Design-Expert® software (version 13, Stat-Ease, Inc., Minneapolis, USA). The independent variables were polyvinyl alcohol (PVA) concentration, hyaluronic acid (HA) concentration, and sonication time (hours). The measured responses included mucin adsorption and bacteriophage release. The coding of both the independent variables and responses was computed using the following equation (Equation 1 and Table I):
Where:
xi = coded value of independent variable
Xi = actual value of independent variables
∆Xi = step change in Xi
Machine learning modelling
A computational model was developed to optimize electrospun fiber blends for bacteriophage loading using three machine learning algorithms: ANNs, XGBoost, and RF. These algorithms analyzed dependent variables (mucin adsorption and bacteriophage release) as functions of independent variables (PVA/PCL concentration, HA concentration, and sonication time). All modeling and analysis were performed using the R programming language (version 4.2.1) via RStudio software (Nami, Imeni, Panahi, 2021).
Artificial neural networks
ANNs are complex computational models designed to mimic the human brain and are widely applied in predictive modeling across various fields, including health care. These networks are trained to predict outcomes by learning from data. In this study, a supervised feed-forward neural network model was developed using the “neuralnet” library in R. The dataset was preprocessed, split into training and test sets, and iteratively trained using different activation functions, network architectures, and training algorithms. The sigmoid and Tanh activation functions, which are the default functions in “neuralnet”, were iteratively tested. The equations for the sigmoid and Tanh activation functions are presented in Equations (2) and (3), respectively (Odukoya et al., 2022).
Where:
x = inputs
S = sigmoid activation function
Tanh(x) = Tanh activation function
The sigmoid activation function was ultimately chosen due to its superior performance. Furthermore, to determine the optimal parameters, the network was trained iteratively using different architectures and training algorithms, including backpropagation, resilient backpropagation with weight backtracking (RPROP+), resilient backpropagation without weight backtracking (RPROP-), and stochastic average gradient (SAG) algorithms. Among these, RPROP+ was selected for its enhanced performance. The best-performing network architecture was 3-7-4-1, consisting of three neurons in the input layer, seven neurons in the second layer, four neurons in the third layer, and one neuron in the output layer (Rustam, Gunawan, Kresnowati, 2020).
eXtreme gradient boosting algorithm
XGBoost is a scalable and highly efficient machine learning algorithm that leverages parallel and distributed computation for training. It operates using a method known as combination multiple classification and regression tree (CART). Due to these features, XGBoost has been demonstrated to outperform conventional machine learning algorithms in numerous studies and even in machine learning competitions (Azevedo, Rocha, Pereira, 2024).
XGBoost was implemented in R following these steps:
-
1. Data preparation: The dataset was saved in CSV format using Microsoft Excel.
-
2. Package installation and loading: Relevant R packages, namely “xgboost”, “caret”, “readr”, “stringr”, “CaTools”, and “metrics”, were installed and loaded.
-
3. Data normalization: The min-max normalization method was applied to ensure all data were on the same scale. The normalized value for each variable was calculated using:
-
4. Data splitting: The dataset was divided into training (70%) and test (30%) sets.
-
5. Model training: The XGBoost model was trained using the training dataset with default parameters, including a maximum depth of 3, 70 iterations for the mucin response, and 150 iterations for the bacteriophage response.
-
6. Prediction: The model was used to predict new response values, and predicted values were compared to actual values.
-
7. Model evaluation: The model’s performance was assessed by computing the root mean square error (RMSE), the mean absolute error (MAE), and the R-squared (R2) values.
-
8. Variable importance: The model’s variable importance ranking was generated and displayed.
Random forest
RF is a supervised machine learning algorithm that integrates the results of multiple decision trees to make predictions. It is widely used in healthcare-related tasks due to its robustness against overfitting, particularly when dealing with high-dimensional data and small sample sizes (Barardo et al., 2017). The RF algorithm was implemented in R software after loading the “caret”, “MASS”, and “randomForest” libraries, along with the dataset. Min-max normalization was applied to rescale data to values between 0 and 1. Hyperparameter tuning was performed to optimize model performance, and the best hyperparameter values were selected. The chosen hyperparameter values were as follows: the number of variables tried at each split was set to 1, the number of trees was 480, the node size was 1, and the maximum number of nodes was 2.
Evaluation
In this study, the developed models were evaluated using R2 and RMSE as performance metrics. An R2 value close to 1 indicates a strong correlation between predicted and experimental results, signifying a good model fit. Conversely, error values (i.e., RMSE and MAE) should be as close to zero as possible to ensure high predictive accuracy (Amenaghawon, Yerimah, 2020). The evaluation metrics were computed using the following equations:
Where:
y = experimental value
ŷ = predicted value
n = number of points,
Additionally, the linearity of data was assessed using linear regression and the K-nearest neighbor (KNN) algorithm.
Optimization of the response variables
XGBoost models were further optimized using genetic algorithm (GA) and particle swarm optimization (PSO). Genetic algorithms are population-based stochastic optimization methods that operate on the principles of biological evolution. The model parameters used for optimization included a population size of 100, a maximum of 1,000 iterations, an elitism value of 10, a crossover probability of 0.8, and a mutation probability of 0.1. RMSE was used to compute fitness functions. PSO is an optimization algorithm inspired by the social behavior of birds, where each particle adjusts its velocity based on its own experience and that of the population. PSO was implemented using the PSO library in R, with a population size of 100, a maximum of 1,000 iterations, and other default parameters (Chen, Chi, 2010).
Phage isolation and purification
Bacterial isolates of Pseudomonas aeruginosa were obtained from septic wound specimens deposited at the Medical Microbiology Laboratory, Abuja University Teaching Hospital (9° 3’ 28.26’’ N, 7° 29’ 42.288’’ E). Samples were identified and screened for antibiotic sensitivity using the Kirby-Bauer method. For phage isolation, sewage and canal water samples were collected from the sewage treatment plant of the Department of Works and Services, Federal Medical Center, Jabi Abuja. Additionally, canal/stagnant water samples were collected from water bodies near Abuja University Teaching Hospital. Three multidrug-resistant (MDR) isolates (Pɸ 51, Pɸ 120, and Pɸ 133) were selected from the screening process and used for phage isolation, following standard procedures (Pallavali et al., 2017).
The Adams double-layer agar method and spot assay were employed to assess the efficacy of the obtained phage filtrates against MDR P. aeruginosa isolates, expressed in plaque-forming units (PFU/mL). Three distinct clonal variants of P. aeruginosa (Pɸ-Mi-Pa 51b, Pɸ-Mi-Pa 120b, and Pɸ-Mi-Pa 133b) exhibiting clear, well-defined plaques were further purified through optimization and biokinetic measurements, followed by amplification against their specific host bacterial strains. For formulation, a cocktail of phage isolates was incorporated into the electrospun nanofibers (Pallavali et al., 2017).
Development of electrospun nanofibers
HA was weighed and dissolved in 100 mL of normal saline. PVA was prepared by dissolving 60% acetic acid and 40% deionized water to obtain a 20% PVA solution. Each solution was stirred separately at room temperature for 1 hour at 300 rpm, followed by heating at 80 °C for 2 h. The temperature was then reduced to 40 °C, with stirring continued at 300 rpm for 1 h (Xue et al., 2019). Three blends of XGBoost-optimized formulations were prepared with variations in sonication times to produce nanofibers GA1, GA2, and GA3. The respective sonication times for GA1, GA2, and GA3 were 36, 23, and 29 minutes, respectively.
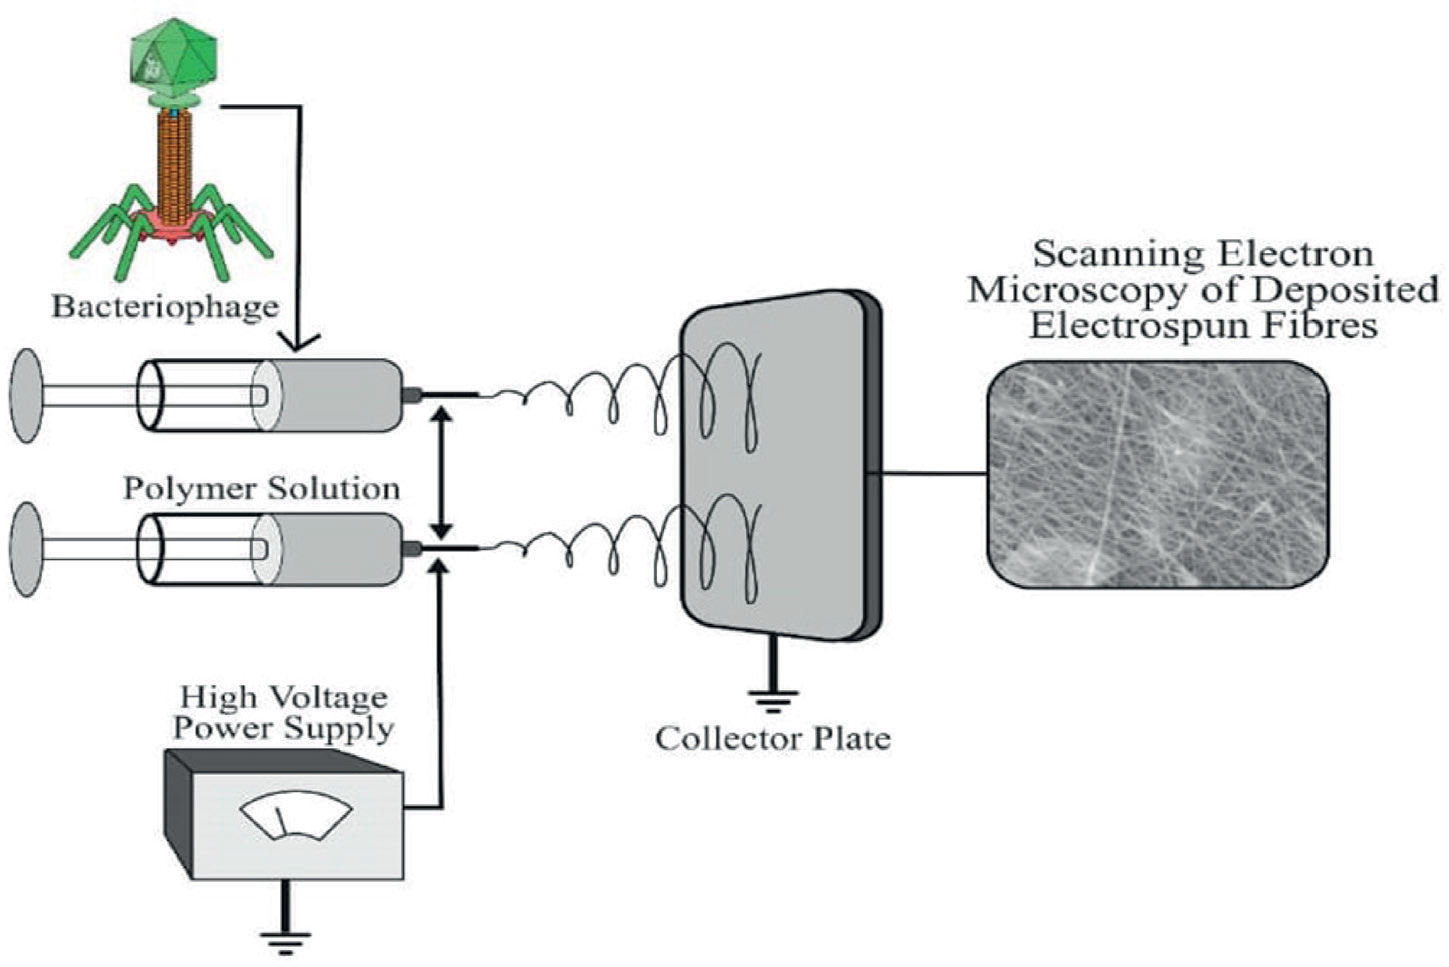
The PVA/HA mixture was prepared by mixing PVA and HA with sodium cocoamphoacetate in a beaker and stirring for 2 h to achieve a homogeneous blend. The solution was then left undisturbed for 24 h before electrospinning to ensure complete dissolution. The polymer blend was sonicated for varying durations using an ultrasonicator (Table 2) (Shenzhen Derui, China). Exactly 5 mL of each polymer blend was drawn into two 10 mL plastic syringes, each fitted with a 1.2 mm internal diameter needle (Xue et al., 2019). Syringes were mounted on a syringe pump and clamped onto an electrospinning machine (Nano Labs Instruments NLI® Basic Electrospinning Series). The high-voltage power supply was connected to the syringe needle, with an electrode wire from the voltage generator pinned near the tip of the first needle, which was then connected to the second needle.
Electrospinning of the prepared solutions was conducted with a flow rate of 1 mL/h for 5 h, under a voltage of 30 kV, and a gap distance of 15 cm between the needle tip and the metal collector covered with aluminum foil. Nanofibers collected on the aluminum foil were carefully removed and stored in airtight zip-lock polyethylene bags after 5 h. Suitable samples were withdrawn intermittently for analysis. Recovered GA1 nanofibers were electrosprayed with a 1 × 10⁹ plaque-forming units (PFUs) bacteriophage cocktail, consisting of three clonal variants of
MDR P. aeruginosa-specific phages (Pɸ-Mi-Pa 051b, Pɸ-Mi-Pa 120b, and Pɸ-Mi-Pa 133b). These phages demonstrated clear lytic zones against MDR P. aeruginosa strains Pa 051, Pa 120, and Pa 133, respectively. Phage purification was performed using the double agar layer method, and the purified phages were stored at high titers in a refrigerator at 4 °C (Figure 1) (Santos et al., 2009).
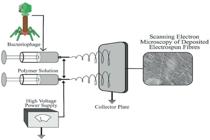
Schematic diagram illustrating the electrospinning of bacteriophage-loaded PVA/HA nanofibers.
Electrospun fiber characterization
Scanning electron microscopy
Scanning electron microscopy (SEM) was used to generate images of the electrospun fibers by scanning their surface with a focused beam of electrons. Field emission SEM (FEG-SEM) was performed using a Phenom World Eindhoven Phenom ProX Scanning Electron Microscope to examine the morphologies of both bacteriophage-loaded and blank electrospun fibers. Images were captured at an accelerating voltage of 16 kV (Qvortrup, 2019).
Differential scanning calorimetry
Differential scanning calorimetry (DSC) analysis was conducted to determine the melting and crystallization behavior of the electrospun fibers. Nanofiber samples (5 mm × 5 mm) were carefully weighed, placed in an aluminum pan, and hermetically sealed. The analysis was performed within a temperature range of 35 °C to 250 °C, using the Mettler Toledo STAR SW 13.00 software for data processing. Samples were scanned under a nitrogen atmosphere at a heating rate of 10 °C/min. A DSC curve was plotted to illustrate the thermal transition phases of the nanofibers (Cardoso-Daodu, Ilomuanya, Azubuike, 2022).
X-ray diffraction
X-ray diffraction analysis of PVA-loaded electrospun fibers was performed using an X-ray diffractometer (D/MAX-2500X, Rigaku, Tokyo, Japan) with Cu Kα characteristic radiation at a wavelength of 1.5418 nm, operating at 40 kV and 15 mA, with a scanning speed of 4° per minute. The XRD analysis was conducted to examine the physical form of the polymers, and the fiber samples were scanned within the 2 θ range. The resulting XRD plot was obtained for further characterization of the samples (Cardoso-Daodu, Ilomuanya, Azubuike, 2022).
Fourier transform infrared spectroscopy
Infrared spectra of electrospun fibers were obtained using a Fourier Transform Infrared Spectrometer (Cary 630 FTIR Spectrometer, Agilent Technologies, Santa Clara, CA, USA) within the 4,000 cm-1 to 500cm-1 range. Electrospun fibers were desiccated in a vacuum oven at 450 °C and packed over diamond crystals for evaluation. Each spectrum was recorded with 20 scans, followed by smoothing on the necessary fibers to reduce interference while preserving peak integrity. Additionally, the uptake band was analyzed to assess potential chemical interactions resulting from the combination of compounds (Santos et al., 2009).
Thermo-gravimetric analysis
Thermal stability of the nanofibers was analyzed using thermo-gravimetric analysis (TGA) with a Perkin Elmer® TGA4000. Precisely 5 mg of each sample was weighed and placed in aluminum pans, with the initial and final weights recorded to determine the percentage weight change corresponding to temperature variations. Thermal scanning was conducted at a heating rate of 10°C/min, with the temperature increasing from 30 °C to 950 °C at a consistent rate of 10 °C/min (Kizildag, 2021).
In vitro mucoadhesion analysis of electrospun scaffolds
Mucoadhesive properties of the electrospun fibers were evaluated using periodic and Schiff’s calorimetry. A phosphate buffer solution (pH 5.5) was prepared, and standard mucin solutions were formulated at concentrations of 0.25, 0.125, 0.0625, 0.03125, and 0.01625 mg per 100 mL of buffer. For the analysis, 1 mL of mucin solution (0.125 mg/mL) was added to 5 mL of buffer, and 5 mg of electrospun fiber was placed inside a test tube. The mixture was stirred on a magnetic stirrer at 37°C for 1 h. Following this, the solution was transferred to test tubes and centrifuged for 90 minutes-first at 4,000 rpm for 30 min, then at 3,000 rpm for the remaining 1 h. After centrifugation, 3 mL of the supernatant was extracted using a 1 mL pipette and transferred to fresh sample bottles. 2 mL of the supernatant was then measured and transferred into a beaker, followed by the addition of 200 µL of periodic acid. Samples were incubated at 37 °C for 2 h, and absorbance readings were taken after 30 minutes of incubation using a UV/VIS spectrophotometer at λ = 555 nm (Stie et al., 2022).
Tensile strength analysis
The tensile strength of the electrospun scaffolds was evaluated using a universal testing machine (Instron-series 3369®, Norwood, MA, USA) equipped with a 50 kN load cell. The scaffolds were cut into 15 mm × 10 mm sections and analyzed under controlled conditions at a temperature of 20°C and humidity of 60%. Measurements were performed in triplicate, and the mean tensile strength was calculated (Ilomuanya et al., 2023).
Bacteriophage release assay
The release of the Pɸ-Mi-Pa cocktail from a 4 cm2 electrospun fiber scaffold was evaluated. Scaffolds were transferred into tubes containing 5 mL of 50 mM phosphate-buffered saline (PBS) at pH 7.45 and pH 4.5, maintained at 37°C ± 1°C. The variation in pH was used to simulate release conditions in open wounds and intact skin, both of which exhibit different pH environments. At specific time intervals (2, 4, 6, 8, 10, 12, and 24 h), 2 mL of the sample was removed after centrifugation at 30,000 rpm for 30 min. An equal volume (2 mL) of fresh 50 mM phosphate-buffered saline was then added to maintain the release conditions. Samples from each time interval were analyzed using the bicinchoninic acid (BCA) assay to determine the concentration of released protein (Mendoza-Garcia, Izadifar, Chen, 2017).
Statistical analysis
The experiments were conducted in triplicate and the results were reported as mean ± standard deviation (SD). Statistical differences between the mean values of GA and PSO results were assessed using one-way analysis of variance (ANOVA) or two-way ANOVA, followed by Tukey or Bonferroni post-hoc tests, respectively, when applicable. All statistical analyses were performed using GraphPad® Prism 6 software (GraphPad Software, La Jolla, CA, USA) (Vonasek et al., 2017).
RESULTS
Architecture and training of artificial neural network
The ANN was trained using both the logistic (sigmoid) transfer function and the Tanh transfer function. The logistic transfer function was selected for the ANN model due to its superior performance compared to the Tanh activation function, as it yielded the highest R2 value and the lowest RMSE value. Table II presents the training results for different network architectures and hyperparameters of the ANN models, with mucin adsorption and bacteriophage release as response variables. Findings indicate the RPROP+ algorithm consistently outperformed backpropagation, RPROP-, and SAG, with 3-7-4-1 emerging as the best-performing architecture. High R2 values suggest the model accurately fits data, meaning the variance in mucin adsorption and bacteriophage release can be explained by the independent variables (PVA/PCL, HA concentration, and sonication time) in the model. Since a high R2 value alone does not guarantee strong predictive power, the ANN RPROP+ model was further compared with other machine learning models, including RF and XGBoost, to assess its reliability and accuracy.
A comparison of the three machine learning algorithms in Table III identified XGBoost as the best-performing algorithm, while RF had the lowest performance. XGBoost achieved the lowest RMSE values for mucin adsorption (0.0066) and bacteriophage release (0.0085). Additionally, it recorded the highest R2 values, with 0.9847 for mucin adsorption and 0.9638 for bacteriophage release. Consequently, XGBoost was selected for further training and validation.
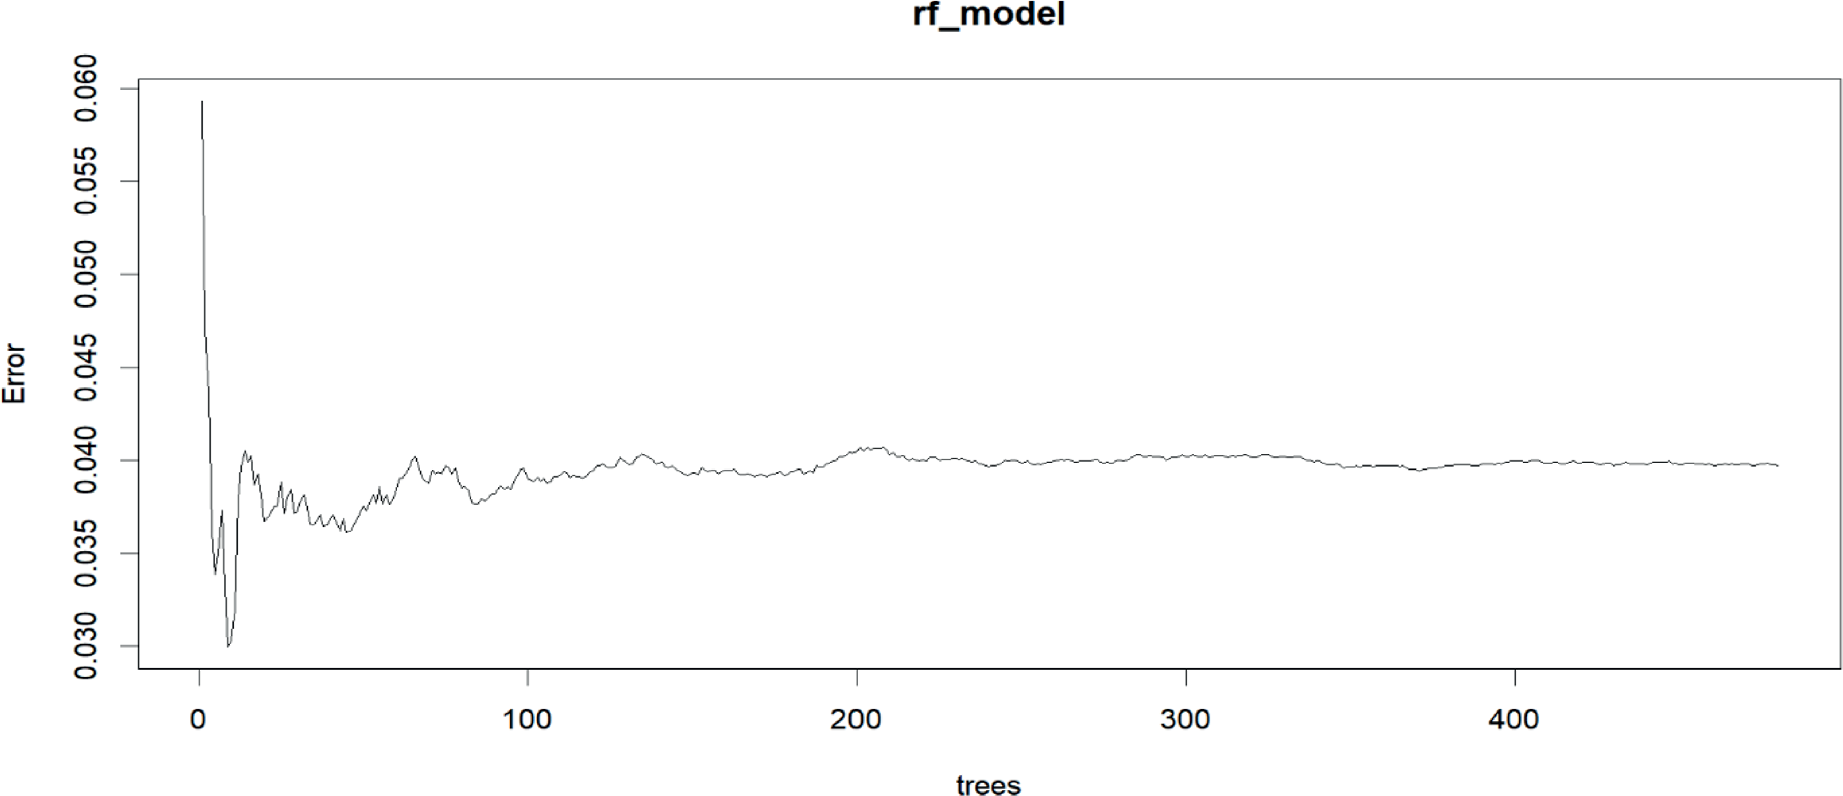
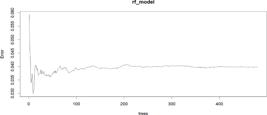
Figure 2 illustrates the relationship between errors and the number of trees. A sharp reduction in errors from 0.060 to 0.035 was observed as the number of trees increased from zero. However, the errors fluctuated irregularly before stabilizing at values between 0.038 and 0.039 when the number of trees reached 100 or more.
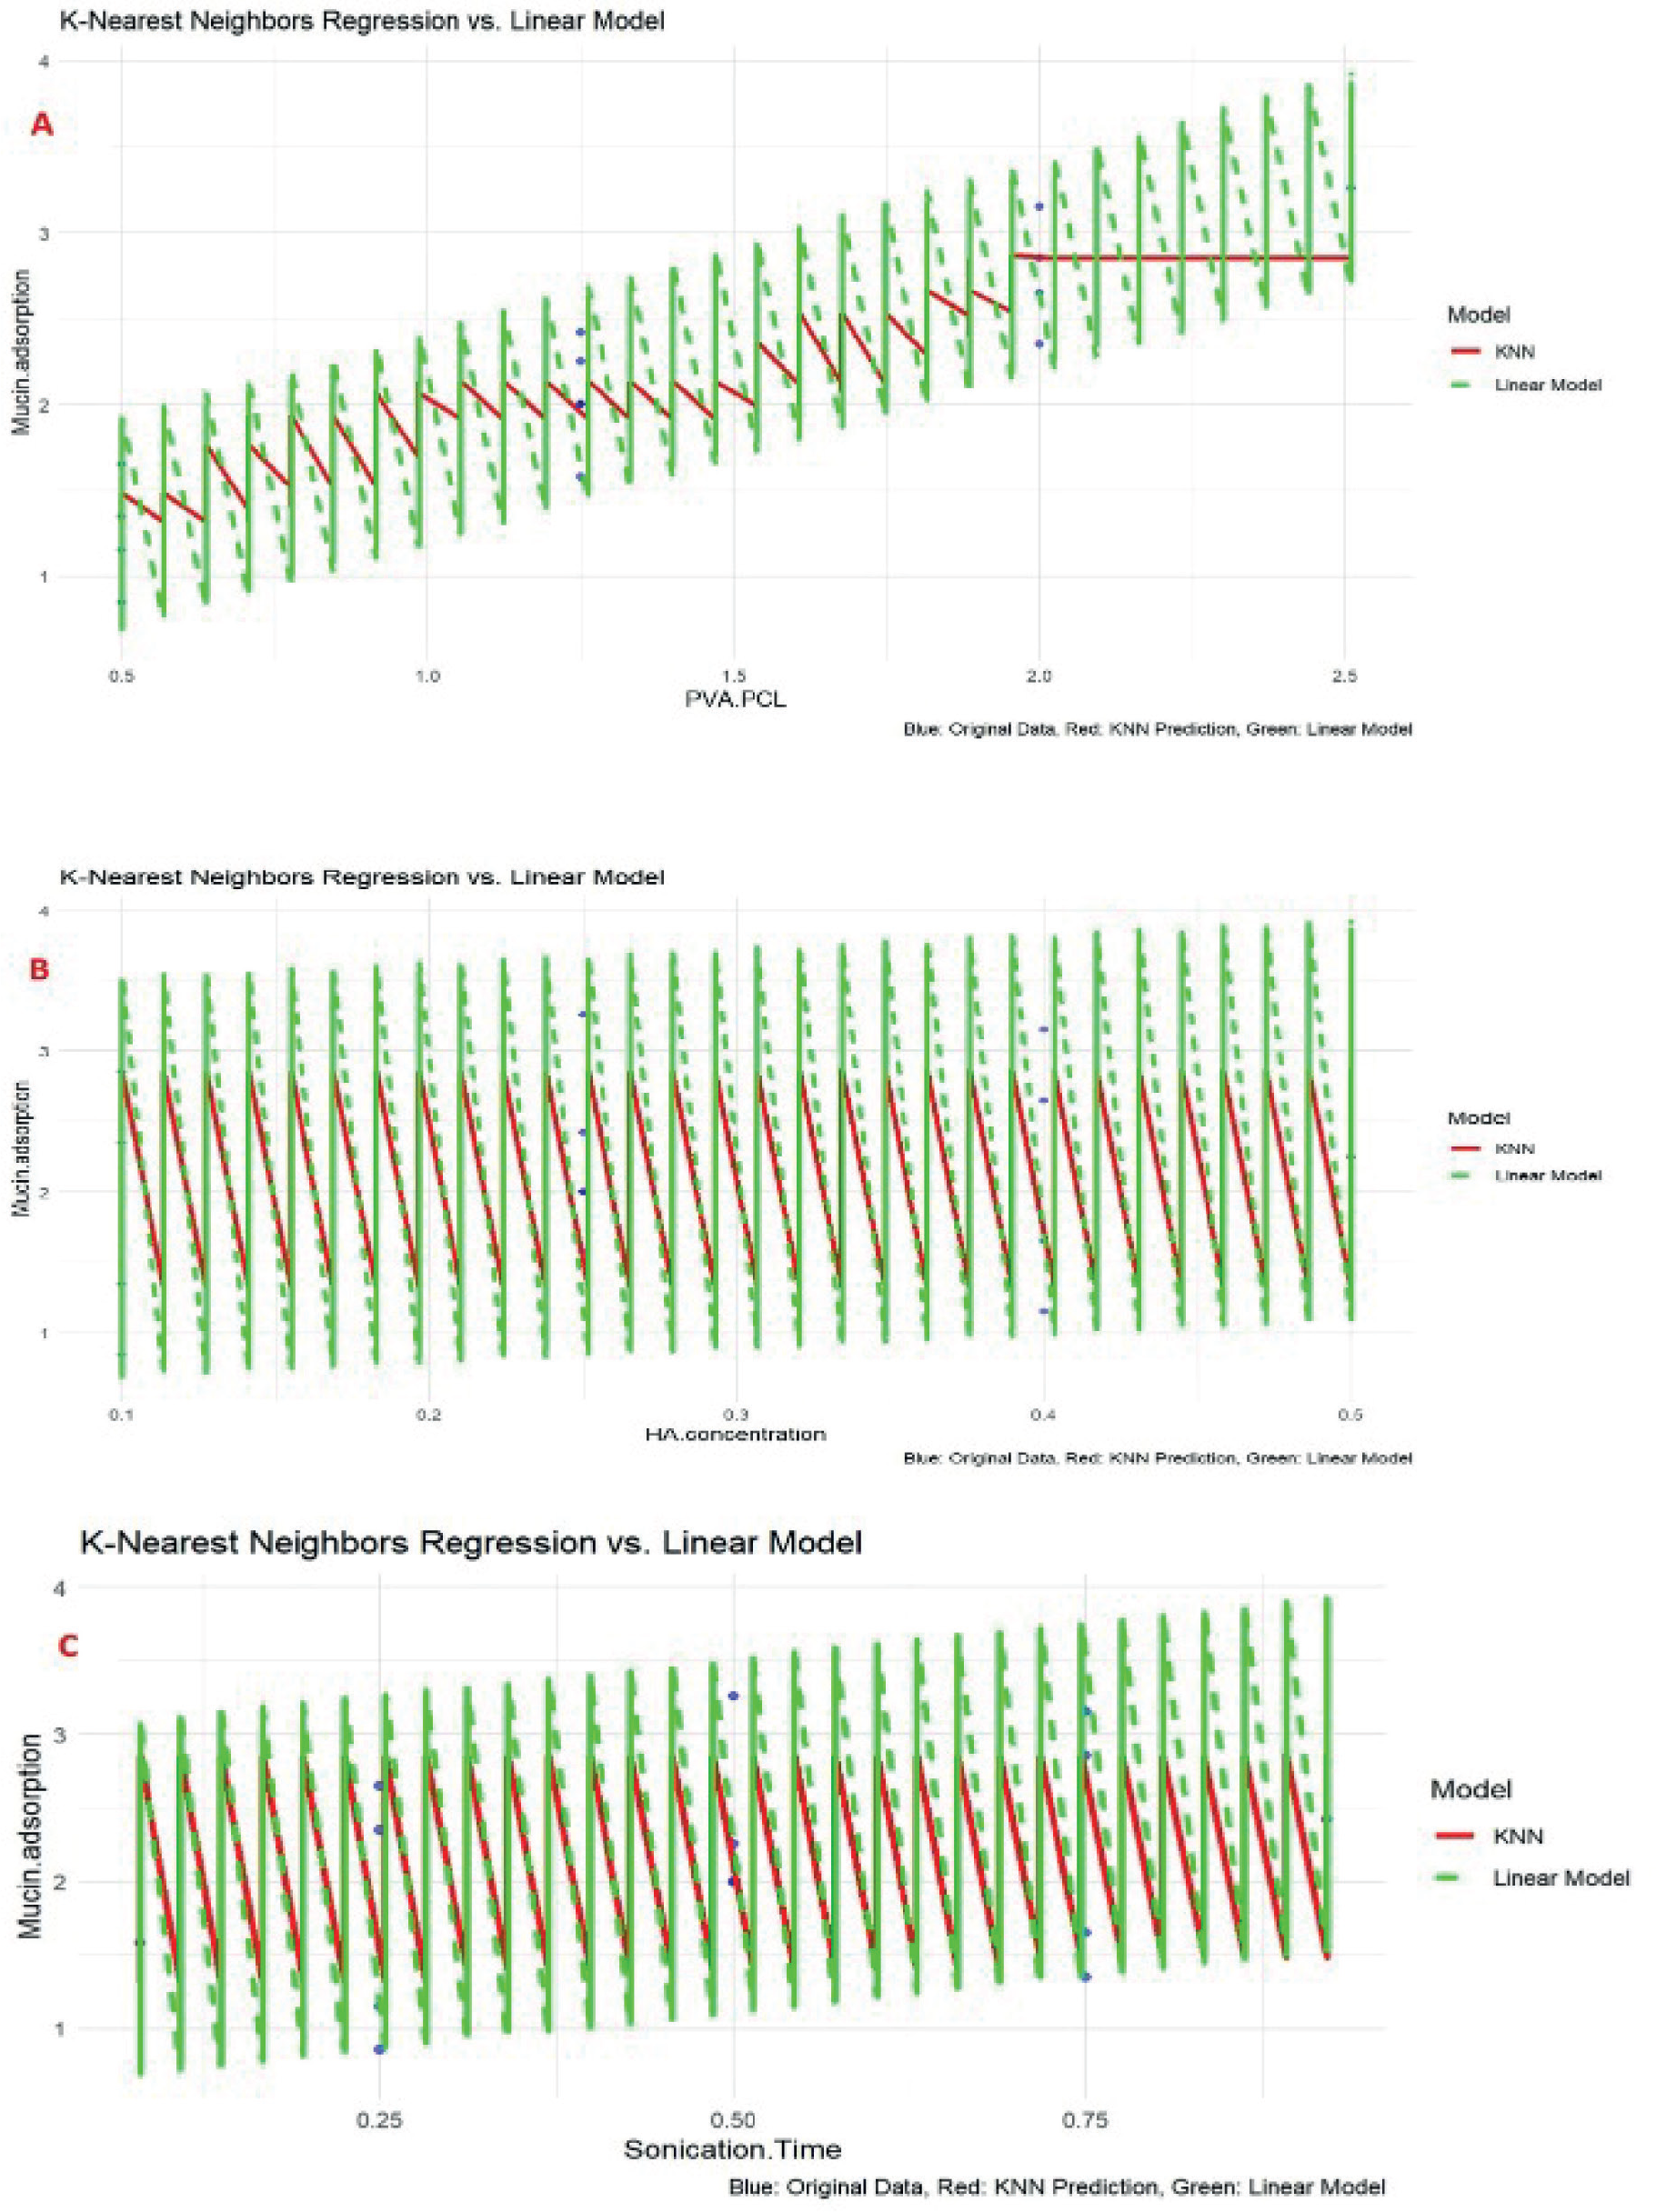
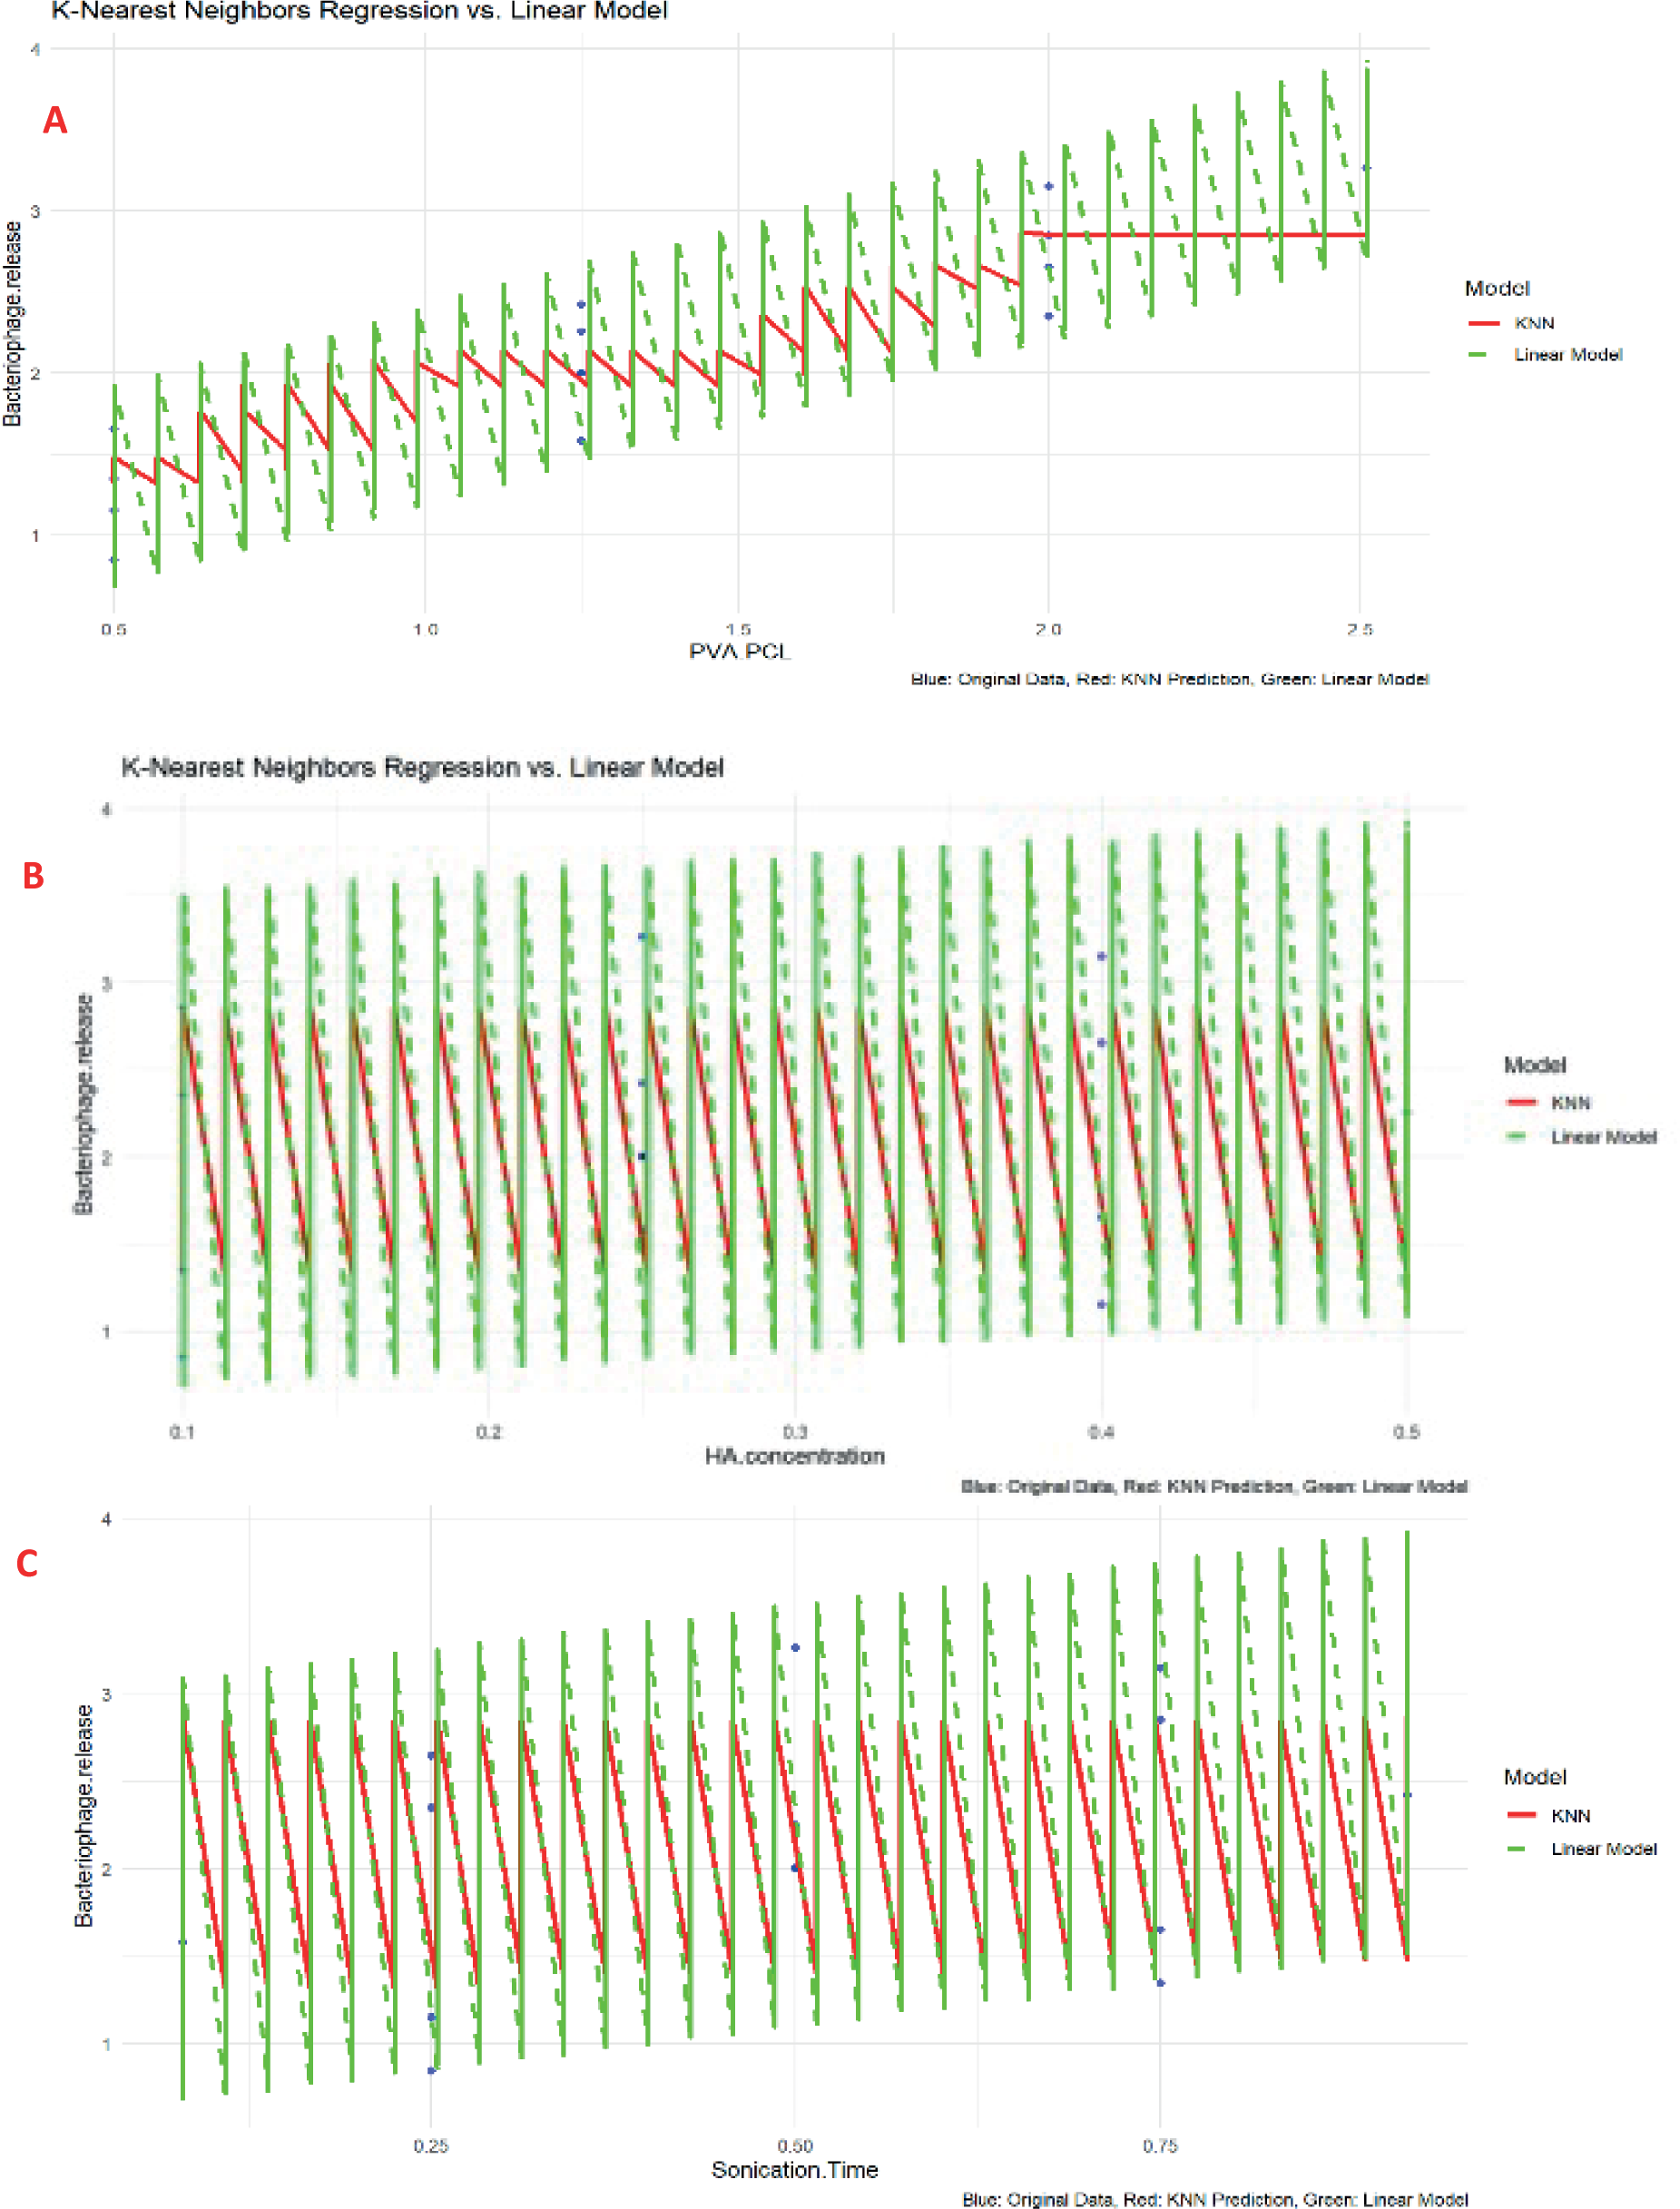
Furthermore, the need to determine the linearity of the data necessitated modeling with K-nearest neighbor (KNN) and linear regression models. A close examination of Figures 3a, 3b, and 3c reveals that the dashed lines, representing the linear regression model, deviate significantly from the blue data points, which correspond to the original values. This deviation indicates a nonlinear relationship between the independent variables (PVA/PCL, HA concentration, and sonication time) and the dependent variable (mucin adsorption), making the KNN model the preferred choice. Similarly, in Figures 4a, 4b, and 4c, a notable deviation is observed between the dashed lines, representing the linear regression model, and the original data points. This suggests the relationship between the independent variables and bacteriophage release is better captured using the nonlinear KNN model.
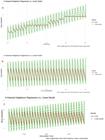
(A) K-nearest neighbor regression versus linear model (PVA/PCL), (B) K-nearest neighbor regression versus linear model (HA concentration), and (C) K-nearest neighbor regression versus linear model (sonication time).
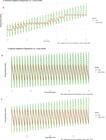
(A) K-nearest neighbor regression versus linear model, (B) K-nearest neighbor regression versus linear model (HA concentration), and (C) K-nearest neighbor regression versus linear model (sonication time).
Since the dashed lines deviate significantly from the blue data points, this indicates the KNN model better captures the data patterns compared to the linear regression model. The data pattern is more accurately represented by the nonlinear KNN model. Therefore, the relationships between the independent variables (PVA/PCL, HA concentration, and sonication time) and the dependent variables (mucin adsorption and bacteriophage release) were found to be nonlinear.
Validation of the XGBoost Model Predictions
Table IV shows the mucin adsorption and bacteriophage release values predicted by the XGBoost algorithm as well as the experimental values for comparison. The predicted values closely matched the experimental results, demonstrating high accuracy with minimal deviation. These findings confirm the validity and reliability of the XGBoost model in predicting mucin adsorption and bacteriophage release.
The variable importance for the XGBoost model is presented in Table V. HA concentration emerged as the most influential factor for both mucin adsorption and bacteriophage release, with gain values of 0.6214 and 0.3784, respectively. This was followed by sonication time, which had gain values of 0.3784 for mucin adsorption and 0.3783 for bacteriophage release. PVA concentration was identified as the least important feature, exhibiting a minimal effect on both models.
Table VI shows the optimization algorithms used to derive the predicted maximum response were GA and PSO. The predicted values closely matched the mean experimental values obtained from the statistically designed experiments, further reinforcing the accuracy and reliability of the XGBoost model.
Table VII presents the comparison of the means for GA and PSO in mucin adsorption and MDR-specific phage Pɸ-Mi-Pa release. The comparison was conducted using the Wilcoxon rank sum exact test. For mucin adsorption, a p-value of 0.333 was obtained, indicating no statistically significant difference between GA and PSO at a 95%CI. Similarly, for MDR-specific phage Pɸ-Mi-Pa release, a p-value of 1 was obtained, further confirming no statistically significant difference between the two optimization algorithms.
Effect of input factors on the responses
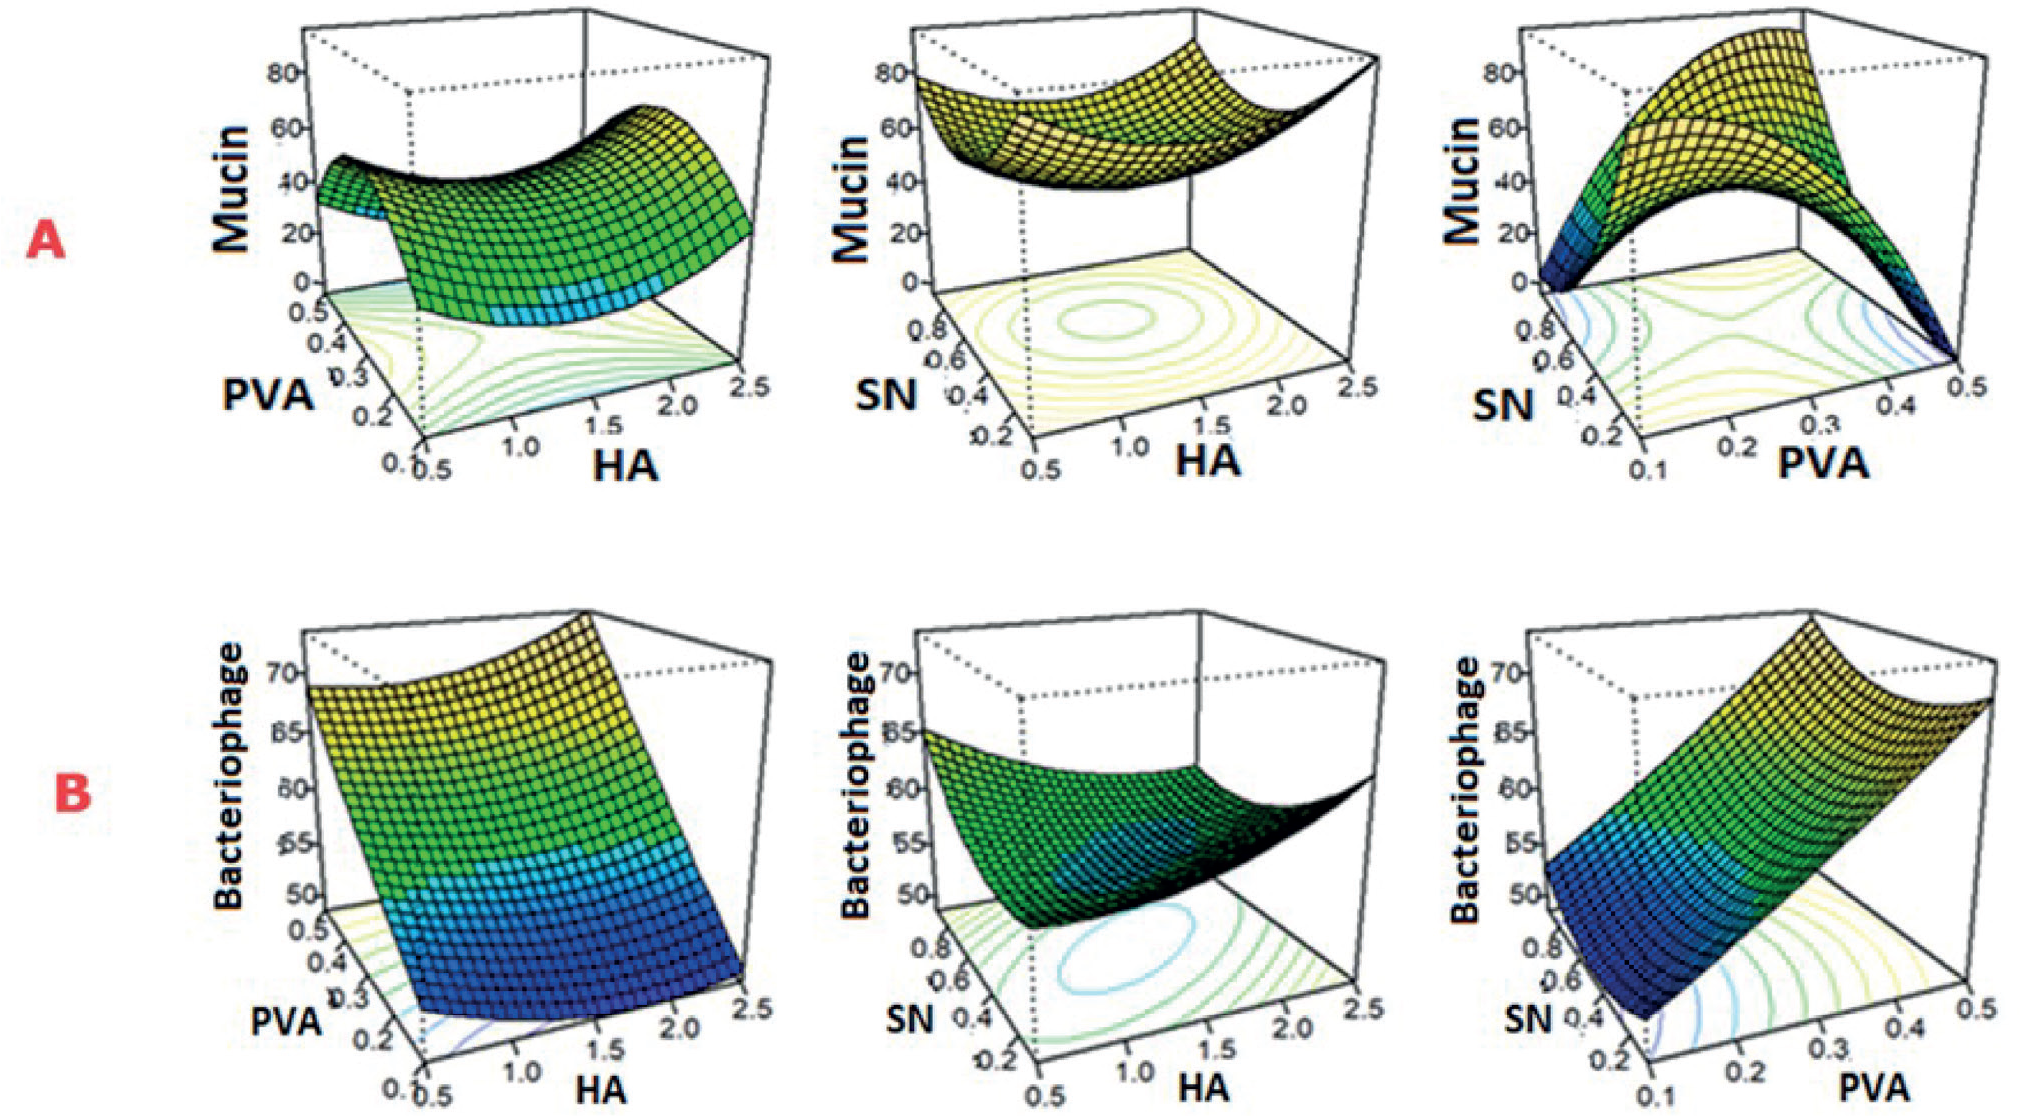
The 3D response surface plots (Figure 5A and 5B) illustrate the effects of input factors (PVA concentration, HA concentration, and sonication time) on mucin adsorption and MDR-specific phage Pɸ-Mi-Pa release, respectively. The plots indicate a nonlinear relationship between the input factors and both responses. An increase in PVA concentration combined with a decrease in HA concentration and sonication time initially maximized mucin adsorption until a point where further improvement was no longer observed.
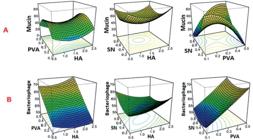
(A) Response surface plot showing the effect of PVA, HA, and SN (sonication time) on mucin adsorption. (B) Response surface plot showing the effect of PVA, HA, and SN (sonication time) on bacteriophage release.
The peak mucin adsorption occurred at PVA = 0.4, HA = 2.5, and sonication time = 0.7. Similarly, an increase in PVA concentration, along with an initial decrease in HA concentration and sonication time, resulted in enhanced MDR-specific phage Pɸ-Mi-Pa release. Peak bacteriophage release was observed at PVA = 0.5, HA = 2.5, and sonication time = 0.8, as shown in Figure 5.
Physio-morphological characteristics of isolated and purified P. aeruginosa-specific phages
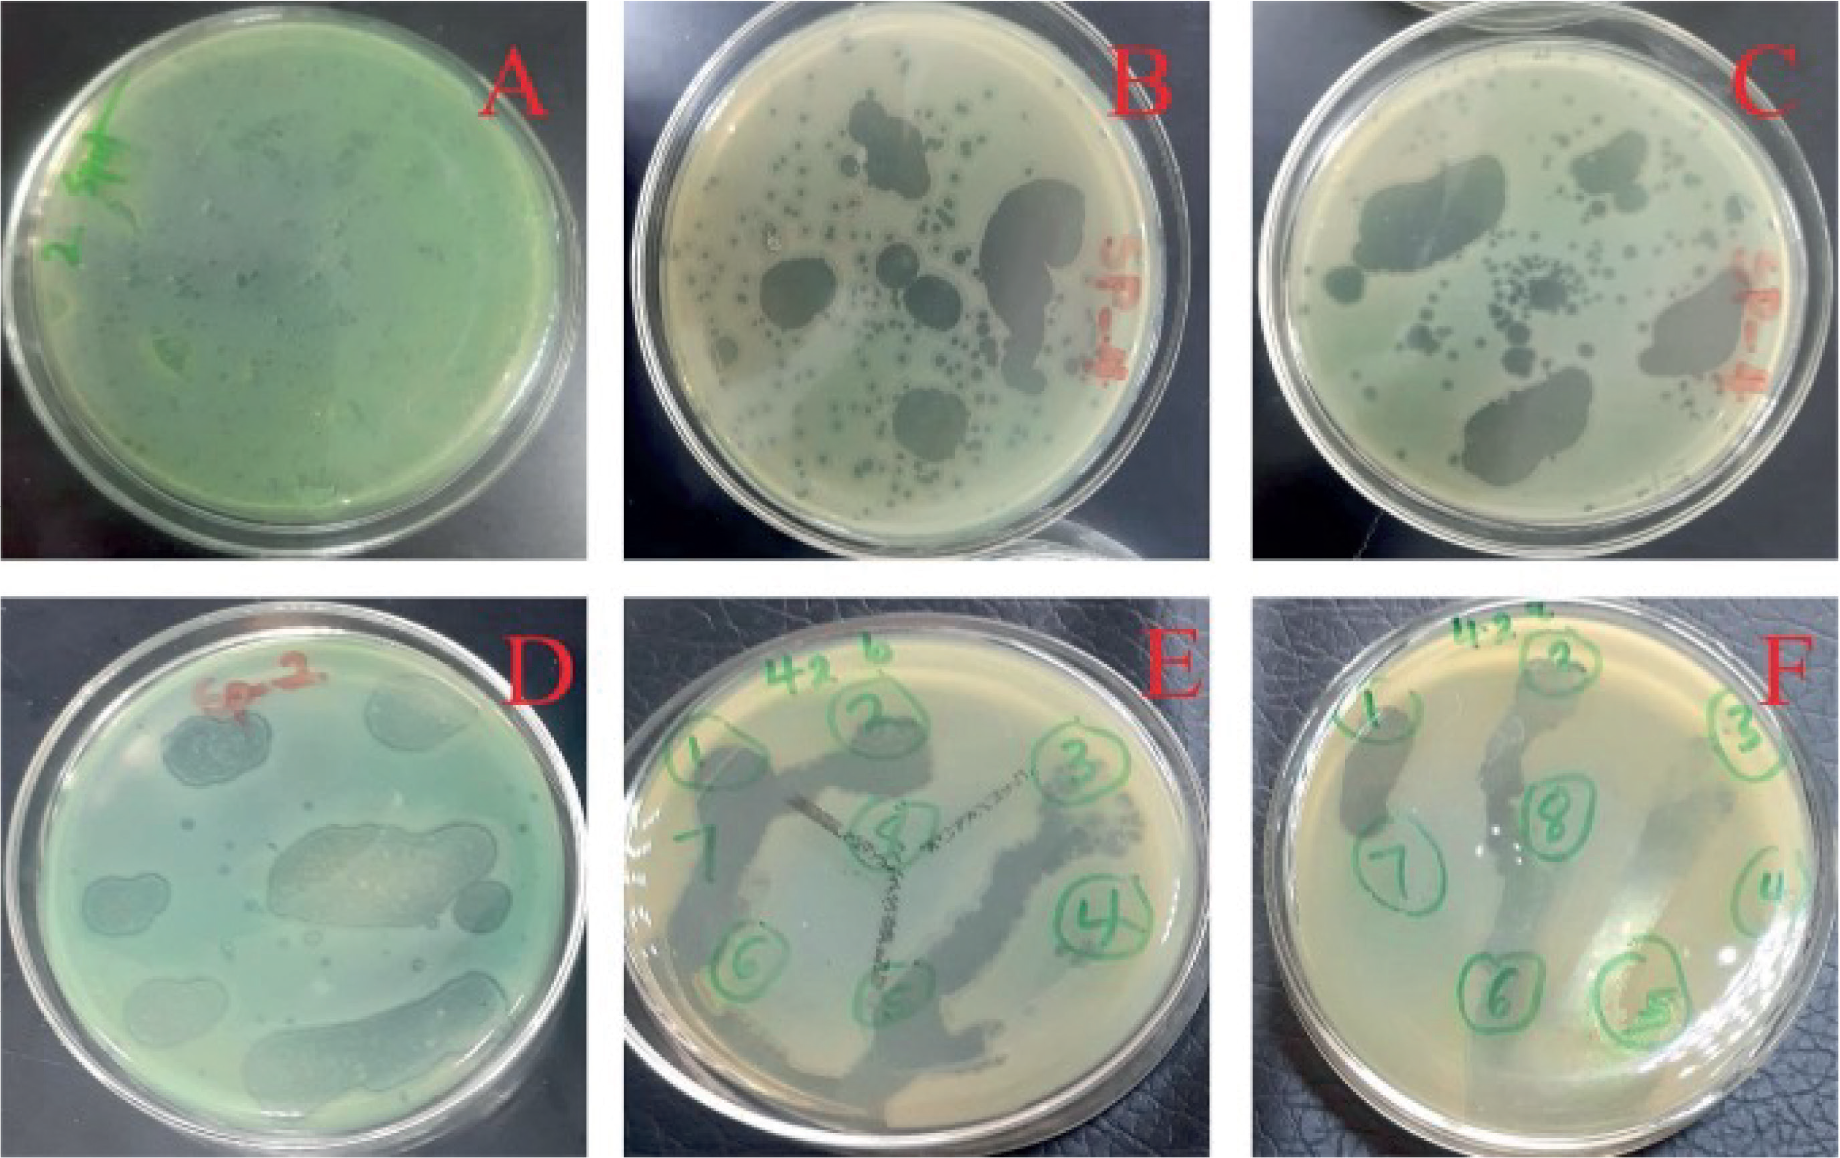
The characteristics of the isolated and purified phages, as presented in Table VIII and Figure 6, revealed a plaque size range of 0.5 to 2.1 mm, with plaque clarity varying from semi-turbid or semi-clear to clear. Phages exhibited a round shape, while plaque margins ranged from unobvious to regular.
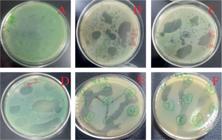
Double-layer plaque assay showing the morphology of (A) Pɸ-Mi-Pa051b, (B) Pɸ-Mi-Pa120b, and (C) Pɸ-Mi-Pa133b; Spot test of isolated MDR P. aeruginosa phages: (D) Pɸ-Mi-Pa051b, (E) Pɸ-Mi-Pa120b, and (F) Pɸ-Mi-Pa133b.
Physicochemical characterization
Scanning electron microscopy
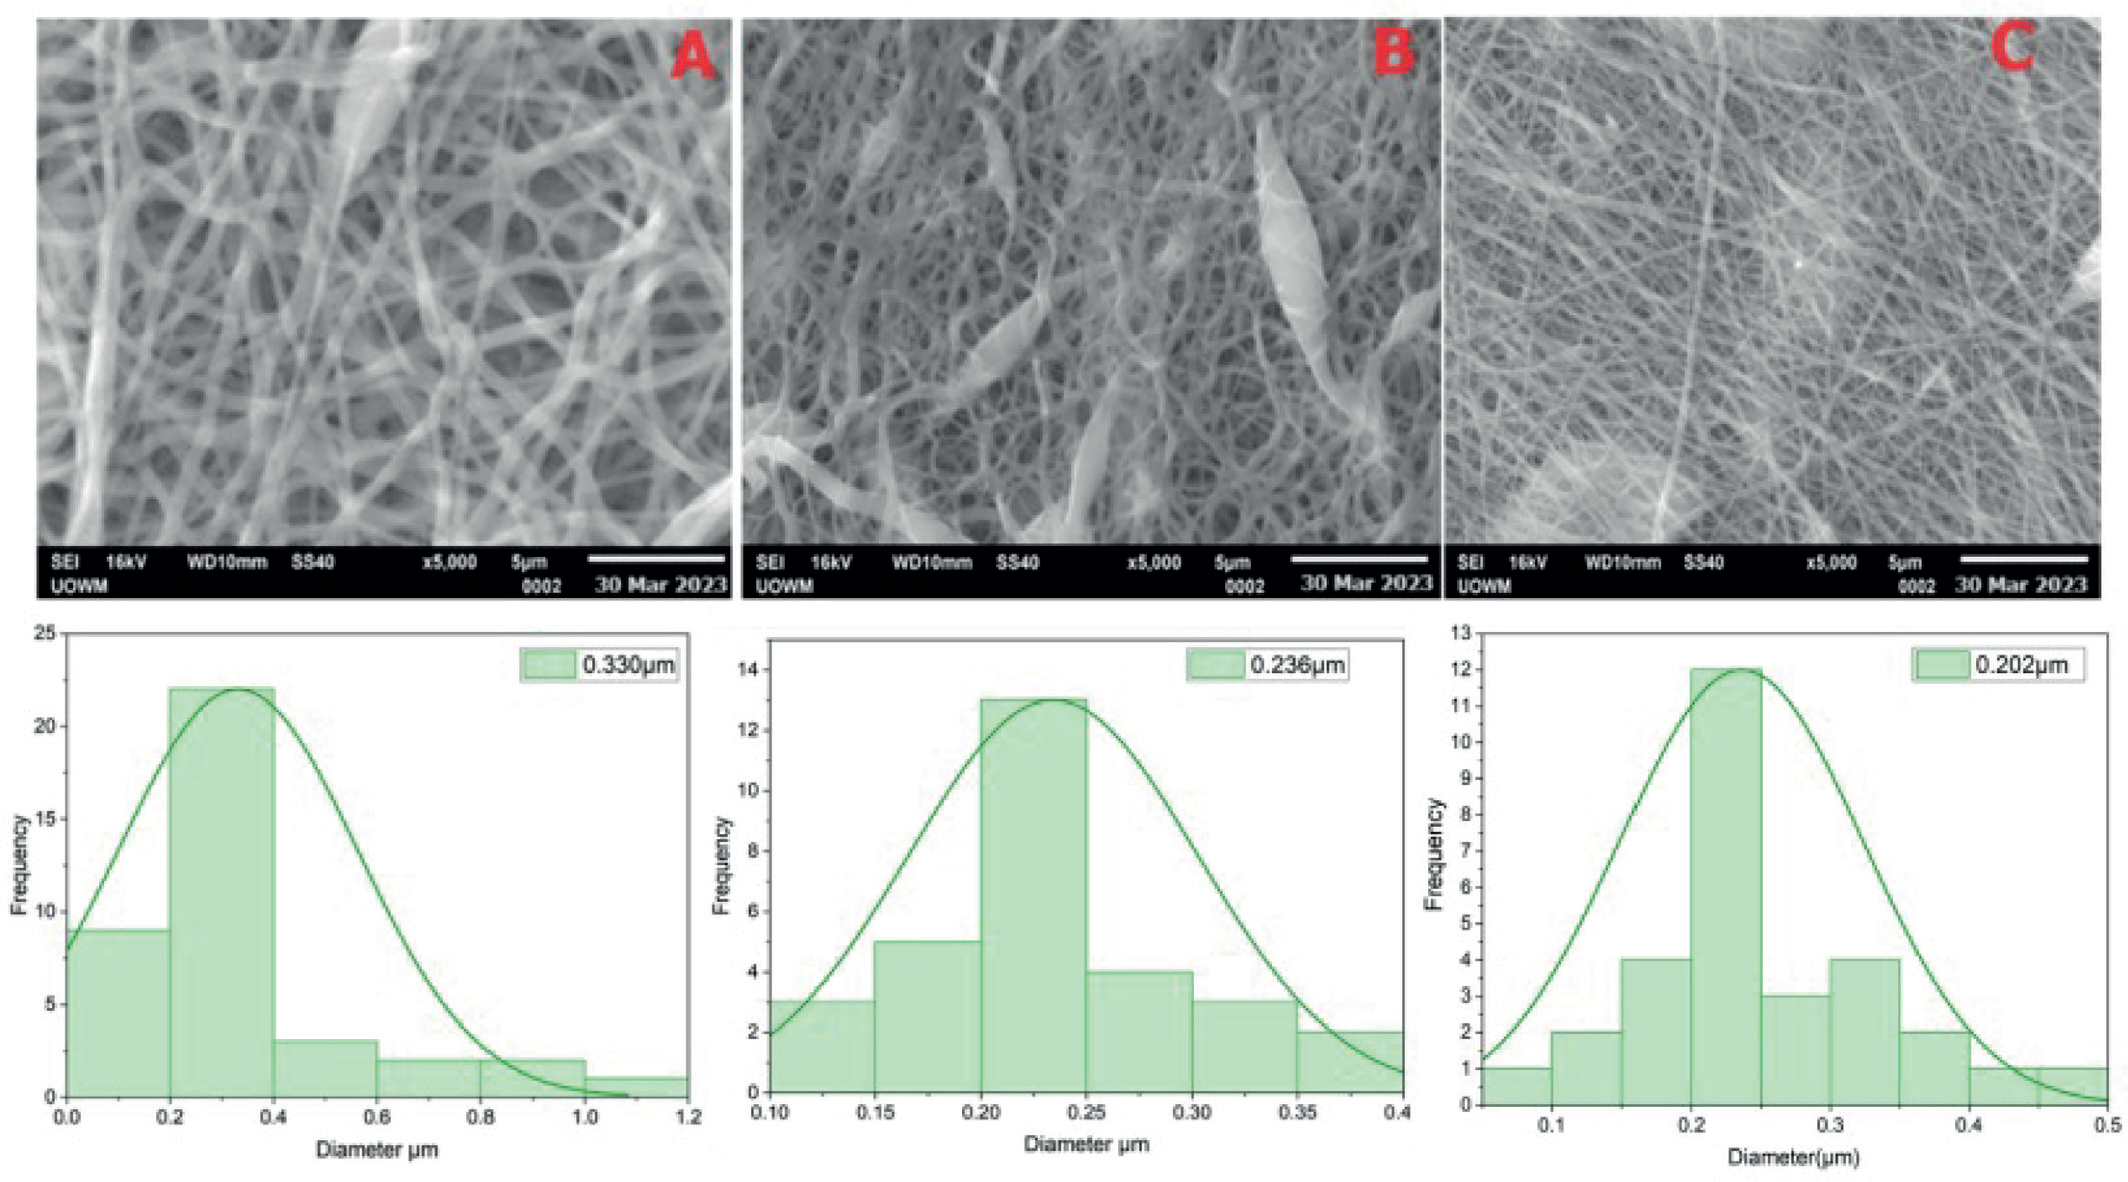
The scanning electron microscopic (SEM) images of the three MDR-specific phage Pɸ-Mi-Pa-loaded fibers (GA1, GA2, and GA3) fabricated using the optimized experimental parameters are shown in Figure 7A-C. The sonication times used for fabrication were 36 minutes for GA1, 23 minutes for GA2, and 29 minutes for GA3. The fibers were within the nanometer size range. The GA1 scaffold exhibited thick fibers with uniform size distribution and an average diameter of 330 ± 22 nm. The GA2 fibers were densely packed, with evidence of bead formation and an average diameter of 236 ± 25 nm. The GA3 fibers were thinner and closely packed, with an average diameter of 202 ± 16 nm. The fiber diameters were measured using ImageJ software.
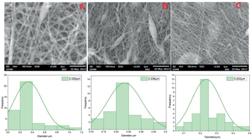
Scanning electron microscopic images of MDR-specific phage Pɸ-Mi-Pa-loaded fibers and their corresponding size distributions: GA1 (A), GA2 (B), and GA3 (C).
Thermo-gravimetric analysis
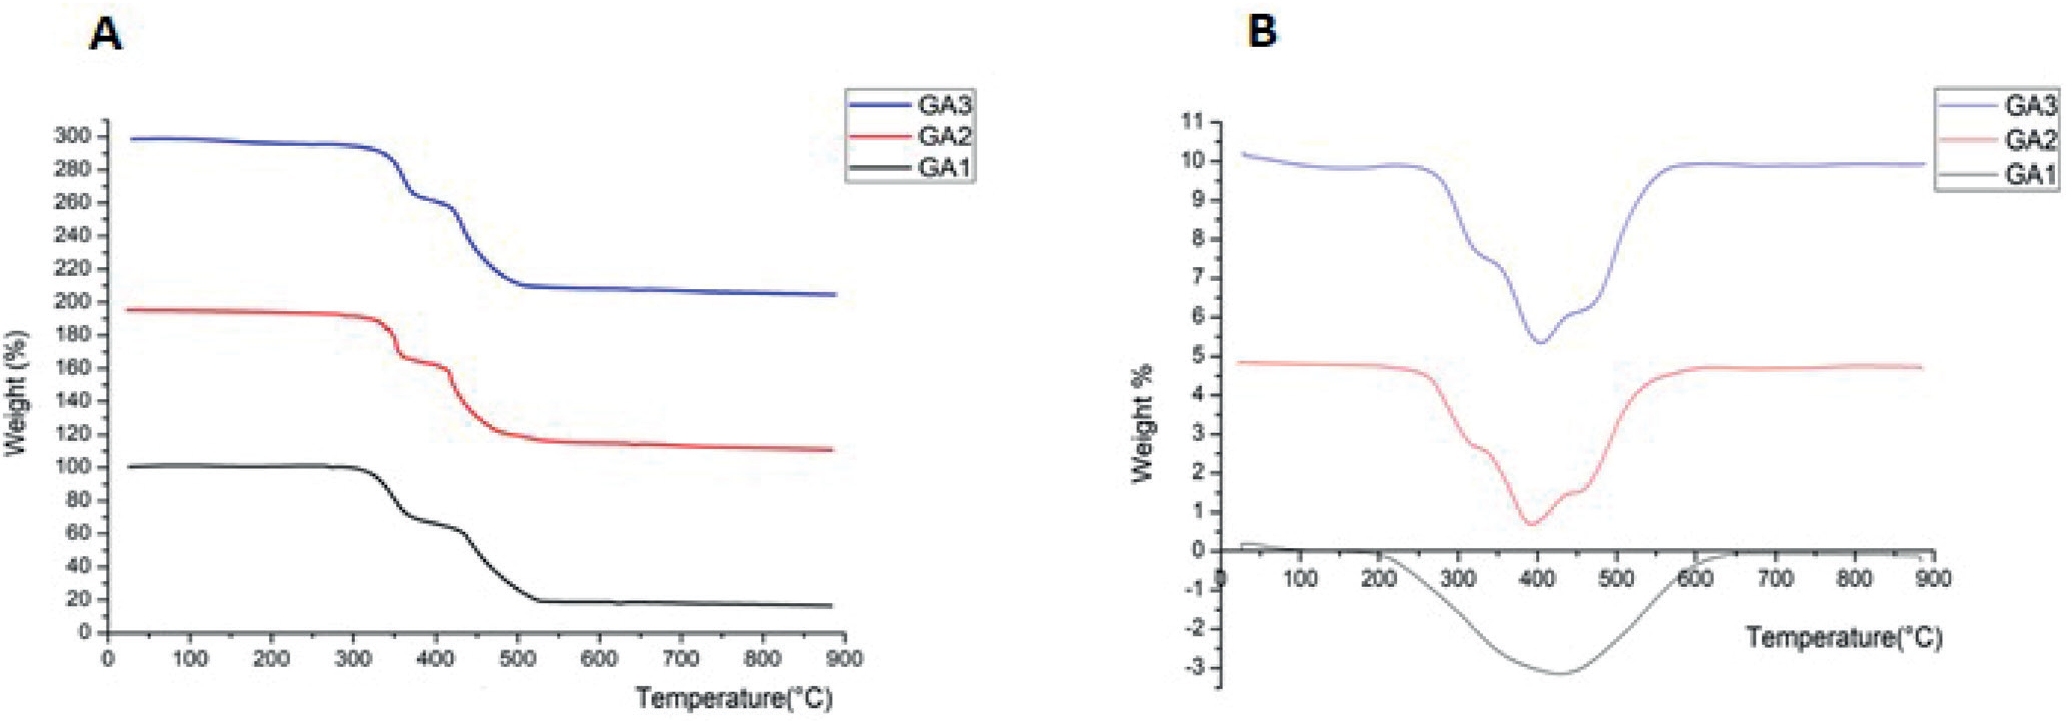
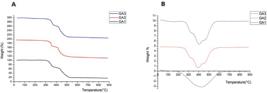
The thermal stability of the electrospun scaffolds was evaluated using TGA. The three fiber formulations, GA1, GA2, and GA3, underwent thermal degradation in two stages, with the first degradation occurring between 300 °C and 368 °C. The fibers exhibited thermal stability when analyzed via differential analysis, maintaining their structural integrity at temperatures up to 250 °C (Figure 8A and 8B).
Differential scanning calorimetry
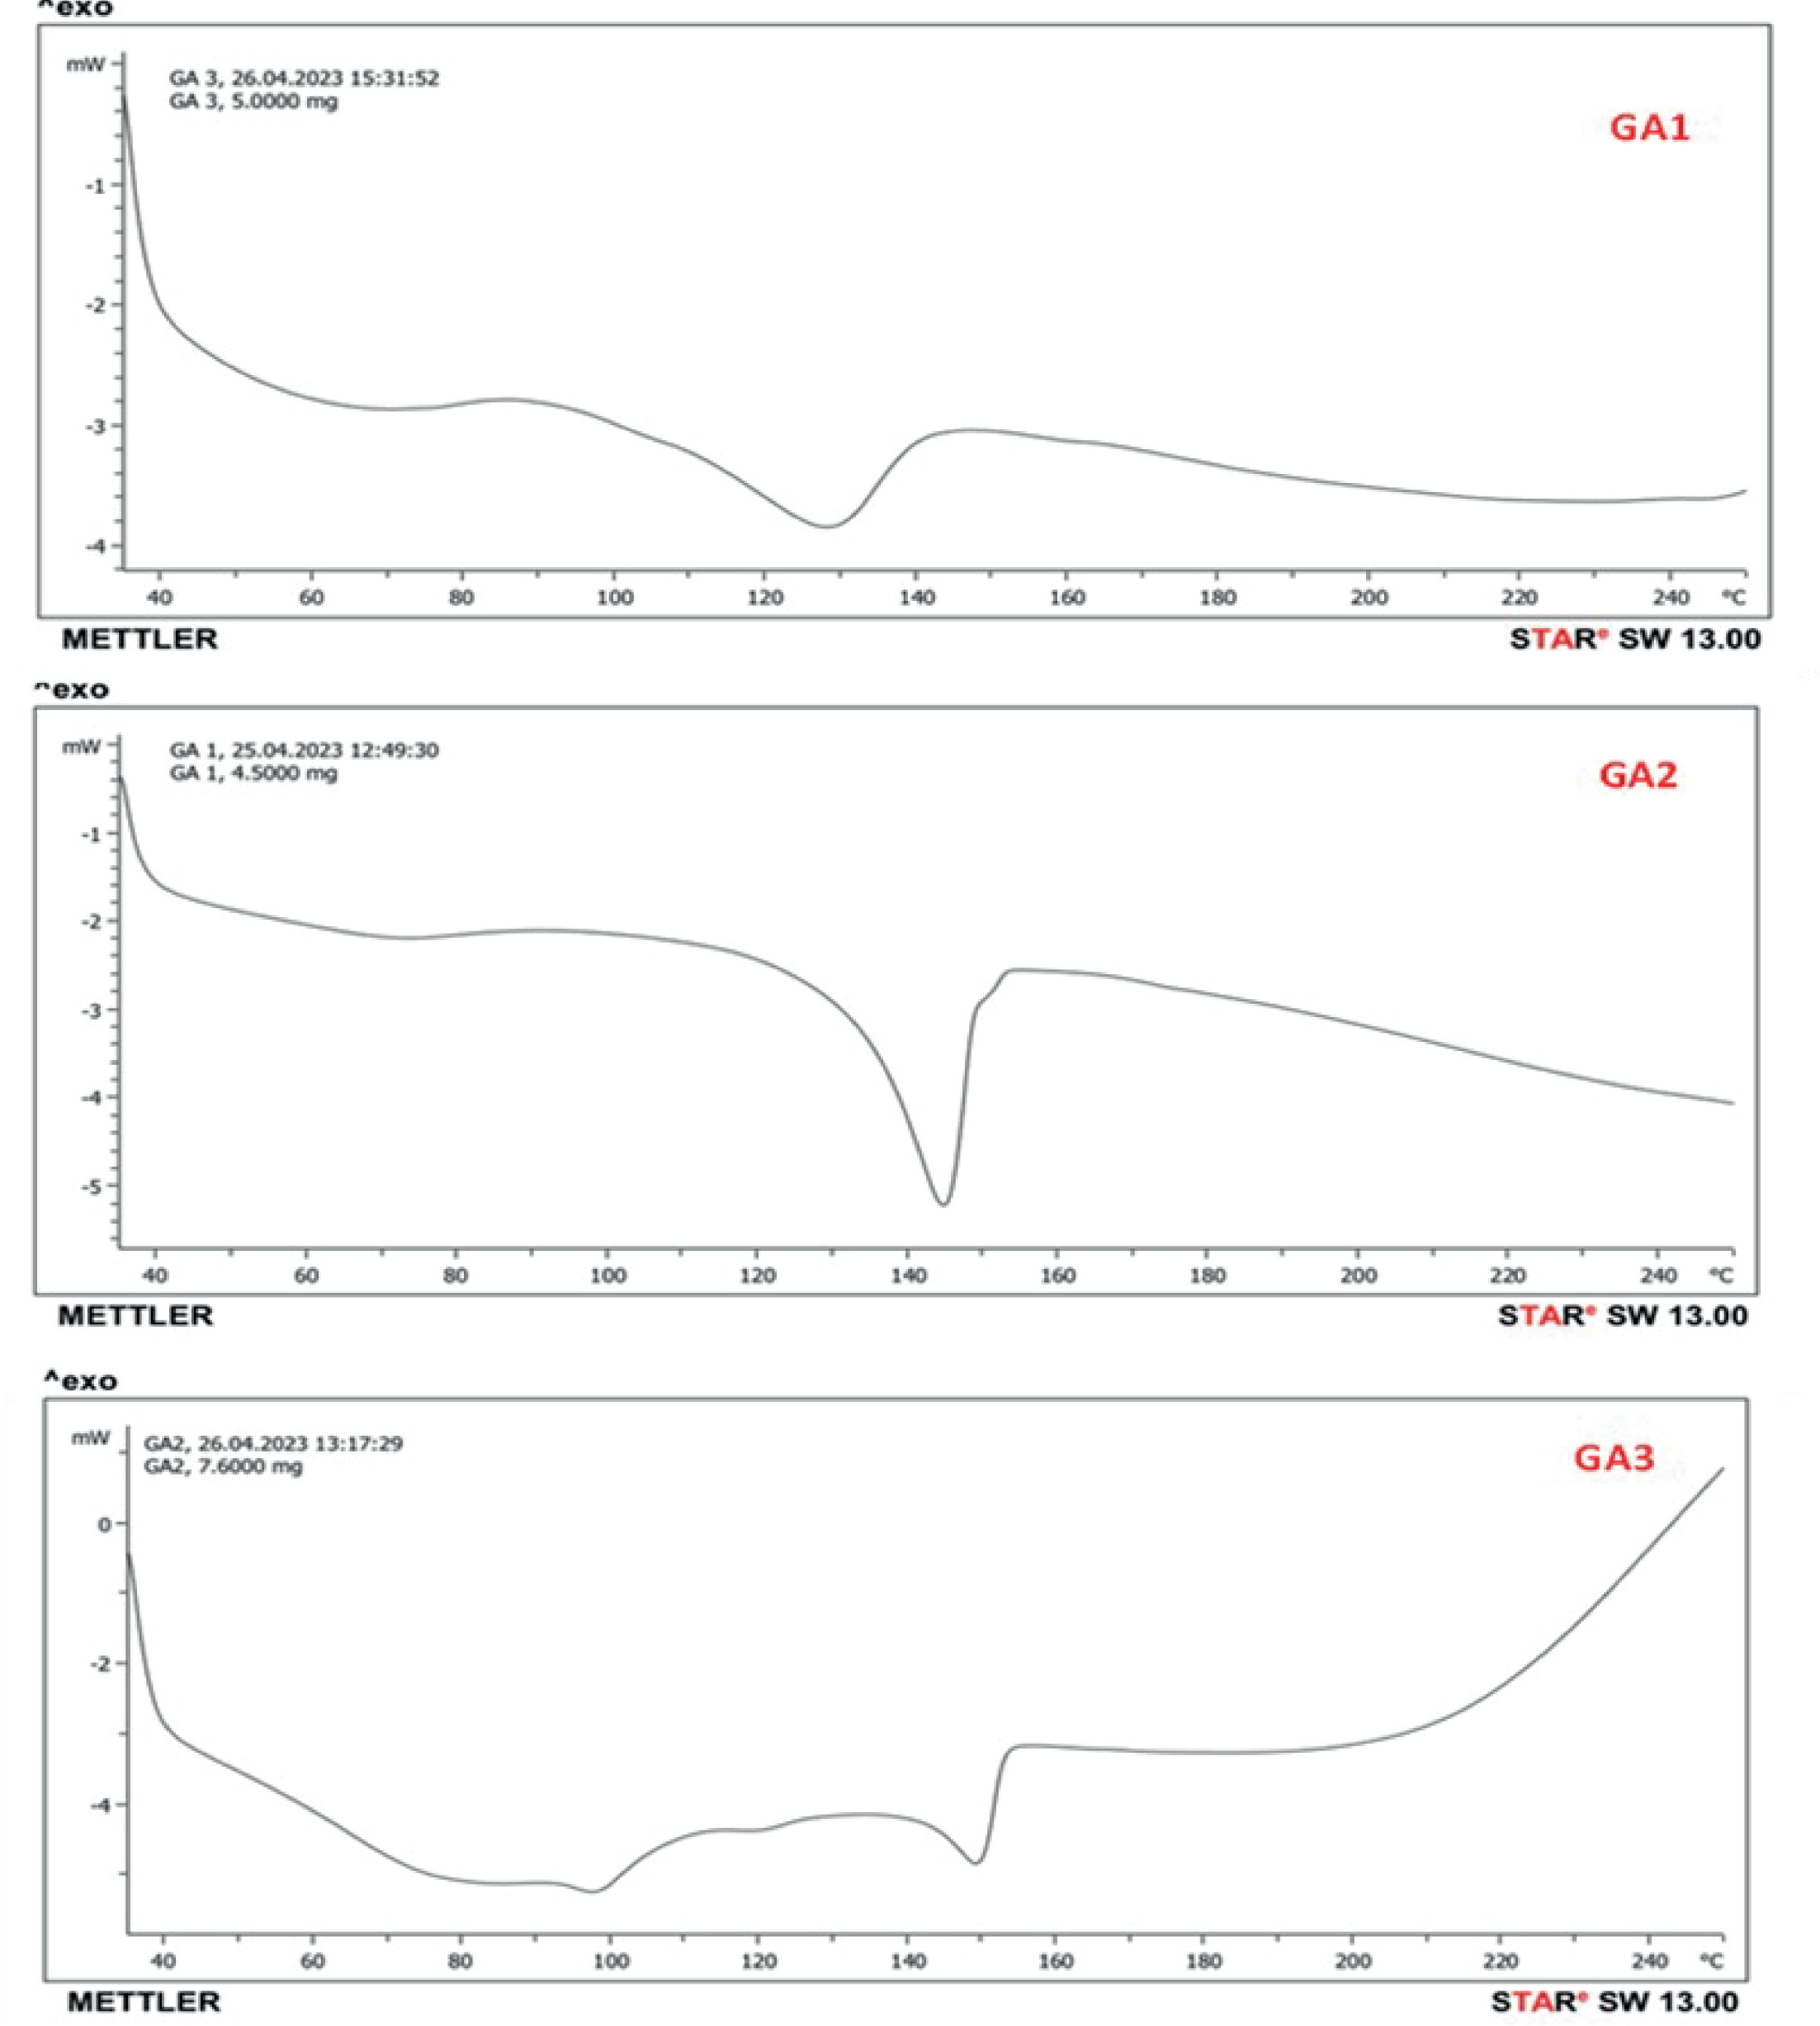
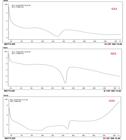
Chemical purity, melting range, and enthalpy variation of fibers were analyzed as part of the characterization process. The melting peak for GA1 was observed at 144.45 °C, while GA2 and GA3 exhibited melting peaks at 145 °C (Figure 9).
X-ray diffraction
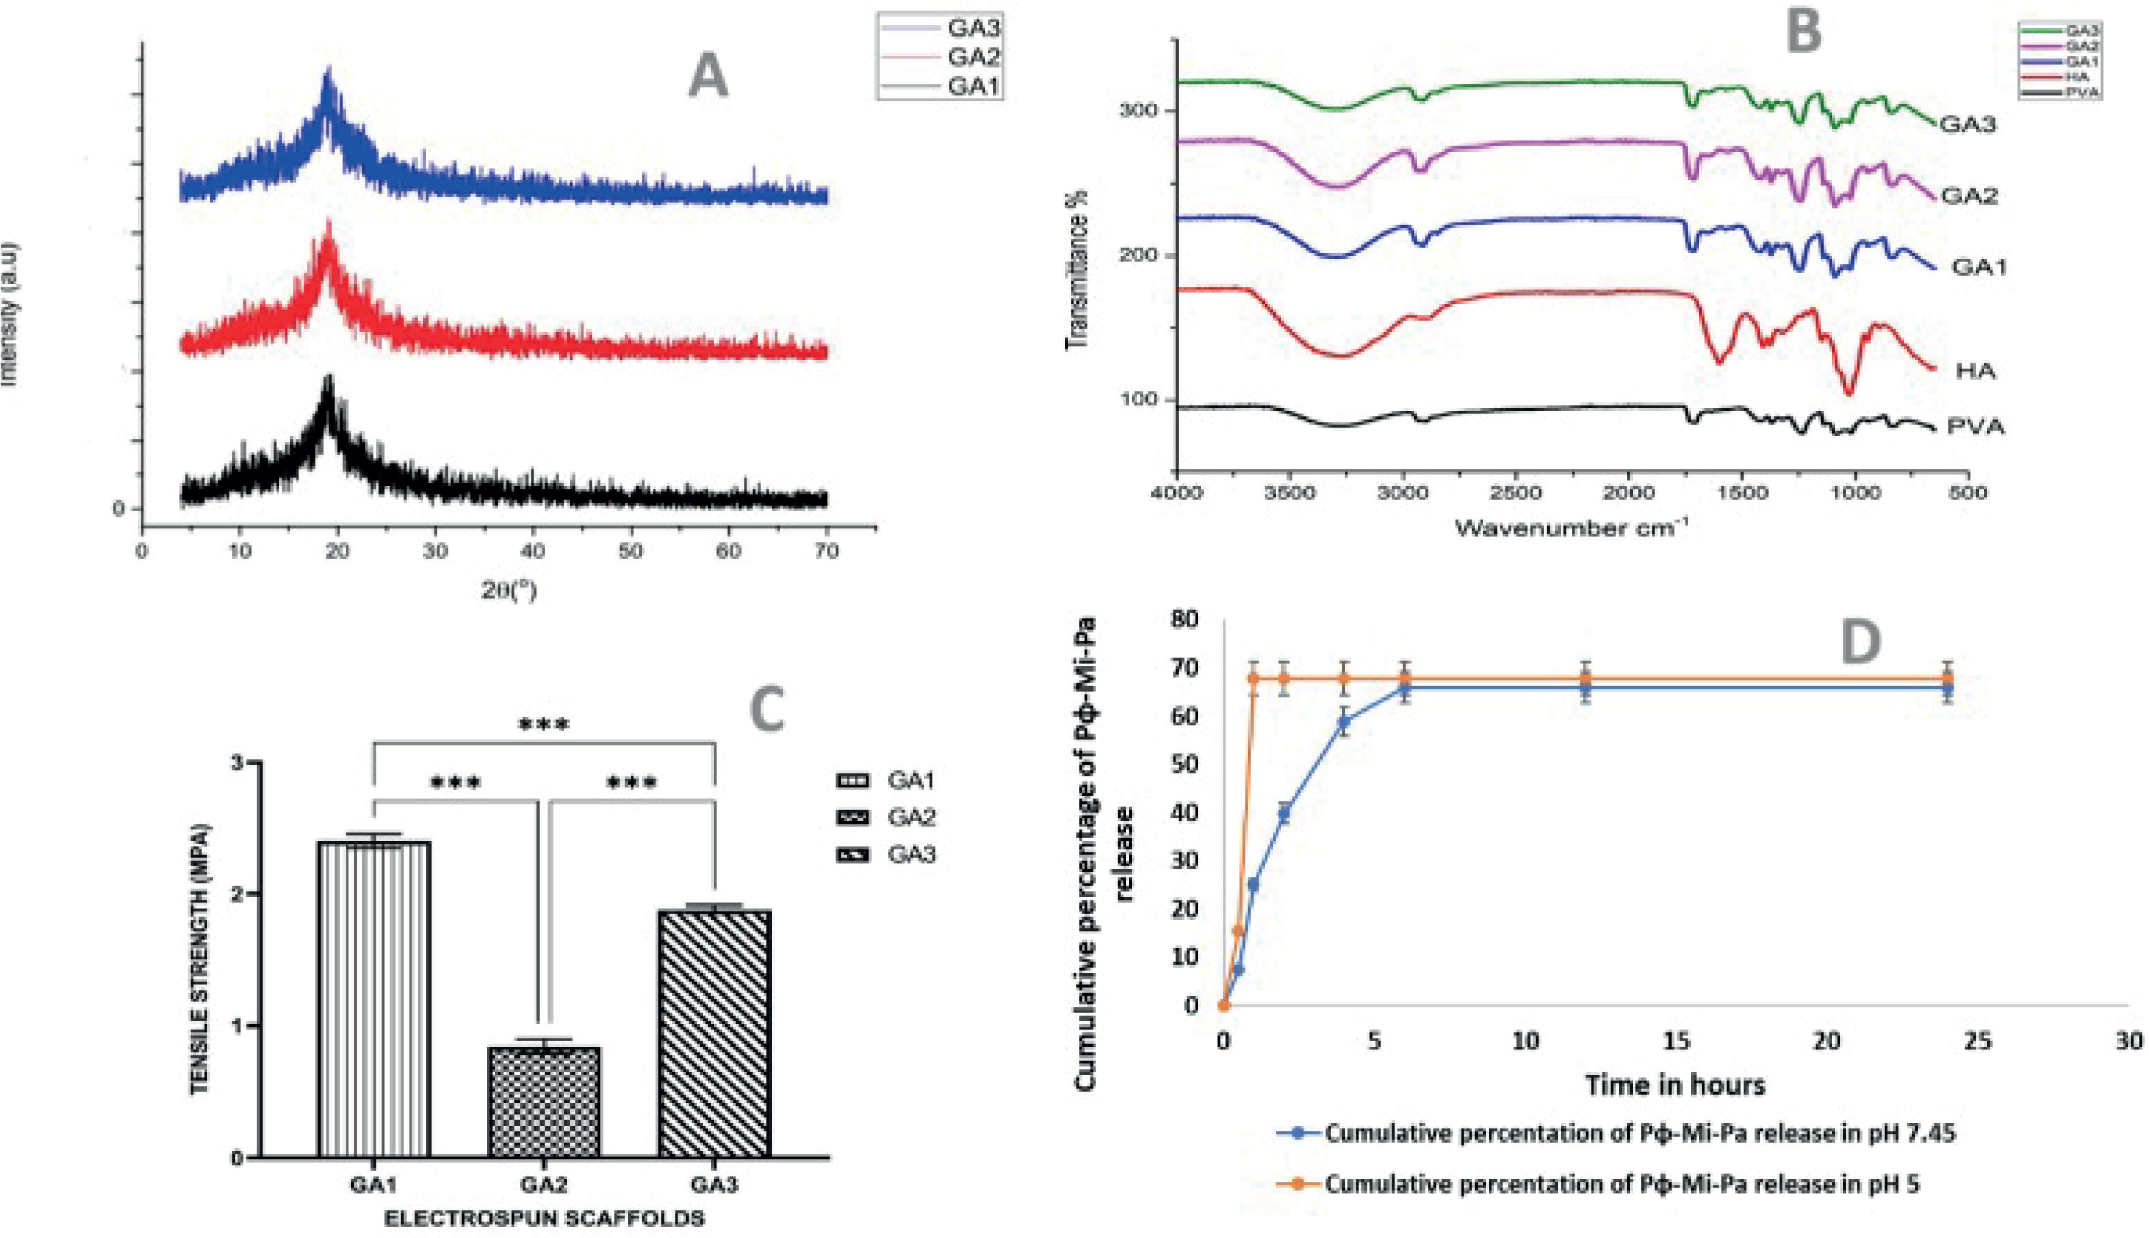
The XRD patterns of optimized nanofibers revealed all the samples were single-phase in nature. The sharp intensity peaks in the XRD patterns of GA1, GA2, and GA3 indicate the presence of well-ordered crystalline material (Figure 10A).
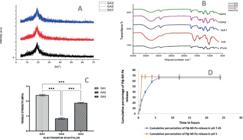
(A) X-ray diffraction, (B) Fourier transform infrared spectra, (C) ultimate tensile strength of optimized electrospun nanofibers, and (D) release profile of Pɸ-Mi-Pa bacteriophage from optimized electrospun nanofibers at pH 7.45 and pH 5 over different time intervals.
Fourier transform infrared spectroscopy
The FTIR spectra of three nanofibers (GA1, GA2, and GA3) were analyzed to determine peak intensities, wave numbers of absorption, and associated functional groups. The results indicated distinct vibrations in the spectra, with characteristic stretches, bands, and peaks corresponding to polysaccharide bonds, including C-H, O-H, C-C, C-O, and C=C functional groups (Figure 10B).
Ultimate tensile strength
The ultimate tensile strength of the optimized electrospun nanofibers was analyzed. The results showed GA1 exhibited the highest ultimate tensile strength at 2.40274 MPa, followed by GA3 with 1.88078 MPa, while GA2 had the lowest tensile strength at 0.8433 MPa (Figure 10C).
Bacteriophage release assay
Bacteriophages are used to induce passive or active lysis against bacterial species. Following lysis, the bacterium releases its intracellular contents along with newly replicated bacteriophages, which then infect additional host bacteria. In this study, bacteriophages were loaded onto PVA/HA electrospun fibers, and the release of viable bacteriophages was evaluated at two specific pH values: 7.45 and 5.0 (Figure 10D).
DISCUSSION
In this study, three machine learning algorithms were employed to optimize the experimental formulation design of MDR-specific phage Pɸ-Mi-Pa-loaded PVA/ HA nanofibers. Comparisons between machine learning algorithms are widely reported in literature (Odukoya et al., 2022). XGBoost consistently outperformed ANNs and RF. As a machine learning approach, XGBoost integrates the predictions of multiple weak learners to construct a highly robust predictive model, making it particularly effective for optimizing complex experimental designs.
Further investigation of the XGBoost model using SHAP(SHapleyAdditive exPlanations), an explainable machine learning tool, is essential to better understand the effect of each independent variable on the model’s predictions. Model explainability enhances the transparency and interpretability of machine learning models, allowing for the quantification of each independent variable’s contribution (Widanage et al., 2024). Our findings revealed that HA concentration is the most influential factor for both mucin adsorption and bacteriophage release, followed by sonication time, with PVA concentration being the least significant. These results highlight the critical role of HA in nanofiber formation, where small variations in HA concentration can significantly impact nanofiber properties. Consequently, both HA concentration and sonication duration should be carefully monitored and optimized.
Also, our study examined the linearity of the data using K-nearest neighbor and linear regression models and observed non-linearity of the data patterns indicating a non-linear relationship between the dependent and dependent variables. Three major parameters were chosen to be varied for this study, the percentage concentrations of polyvinyl alcohol, hyaluronic acid and sonication time. Table V, displays all 18 runs (with varied independent parameters). These three independent parameters varied over five levels and their resulting effect on mucin adsorption and MDR-specific phage Pɸ-Mi-Pa release were derived. It was observed that in run 17 which had a sonication time of 0.50 h, polyvinyl acid and hyaluronic acid concentration of 1.25 % and 0.25 % respectively, there was maximum mucin adsorption and MDR-specific phage Pɸ-Mi-Pa release
Bacteriophages are viruses that infect and replicate within bacteria, ultimately destroying them by increasing osmotic pressure within the bacterial cell structure. Due to their strain specificity, bacteriophages present a promising alternative to antibiotics for targeting bacterial infections (Kalelkar, Riddick, Garcia, 2022). In this study, MDR-specific phage Pɸ-Mi-Pa was incorporated into the nanofibers. Bacteriophage therapy is defined as the use of viruses to treat infections caused by pathogenic bacteria (El-Shibiny, El-Sahhar, 2017). Mucins are glycoproteins expressed on the human epithelial surface, functioning as biological and physical barriers that protect mucosal epithelia. Mucin was adsorbed onto the nanofibers to enhance their adhesion to the human epithelial surface. A smaller nanofiber diameter results in a larger surface area and higher porosity, which translates to greater mucin adsorption due to the formation of more active adsorption sites. The surface area and porosity of the nanofibers depend on multiple factors, including dielectric properties, surface charge, density, surface tension, viscosity, molecular weight, and polymer concentration. Additionally, the morphology, drug adsorption, and release properties of electrospun fibers are influenced by the electrospinning technique. Key factors affecting electrospinning include applied voltage, sonication duration of the polymer solution, flow rate, polymer concentration, type of collector, and the gap distance between the needle tip and the collector (Abadi et al., 2022). Environmental conditions, such as temperature and humidity, also play a significant role. This study examines the effect of polymer concentration and sonication time on mucin adsorption and MDR-specific phage Pɸ-Mi-Pa release.
The 3D response surface plots illustrating the effects of PVA concentration, HA concentration, and sonication time on mucin adsorption and MDR-specific phage Pɸ-Mi-Pa release are shown in Figure 5A & B, respectively. These plots indicate a nonlinear relationship between the input factors and both responses. An increase in PVA concentration combined with a decrease in HA concentration and sonication time initially maximized mucin adsorption until a certain point, beyond which no further improvement was observed. The peak mucin adsorption occurred at a sonication time of 0.7 h, with polyvinyl alcohol and hyaluronic acid concentrations of 0.4% and 2.5%, respectively. Conversely, an increase in PVA concentration, along with an initial decrease in HA concentration and sonication time, resulted in enhanced MDR-specific phage Pɸ-Mi-Pa release, as shown in Figure 5A & B. This led to a peak release at a sonication time of 0.8 h, with polyvinyl alcohol and hyaluronic acid concentrations of 0.5% and 2.5%, respectively. Drug adsorption and release are strongly influenced by fiber diameter, a finding consistent with previous studies. This further reinforces the critical role of polymer concentration in determining the properties and performance of nanofibers.
The optimization algorithms used for the experimental design optimization were PSO and GA. The optimized values for the dependent variables (mucin adsorption and bacteriophage release) were comparable between PSO and GA, indicating no statistically significant difference between the two methods. The predicted values for mucin adsorption (76.01%) and bacteriophage release (70.07%) closely matched the experimental values (76.56 ± 22.98% and 70.32 ± 4.56%), further demonstrating the accuracy and reliability of the XGBoost model (Zhou et al., 2023).
Electrospinning is a nanofiber fabrication technique that enables the formation of continuous fibers with specific dimensions. Loading MDR-specific phage Pɸ-Mi-Pa onto electrospun fibers creates a targeted delivery platform, allowing the bacteriophages to reach the infection site more effectively. This approach helps combat bacterial resistance and enhances the overall therapeutic efficacy of the formulation. Existing literature indicates that a moderate increase in polymer concentration leads to an increase in fiber diameter and thickness, as well as improved mechanical properties. However, at very low polymer concentrations, viscosity is also low, causing instabilities in the electric field between the needle and the collector. This disrupts the droplet’s surface tension, resulting in partial jet fragmentation and the formation of protrusions or nodules, known as the “beaded nanofiber effect.” Conversely, excessive polymer concentration may result in poor fiber formation and reduced surface area, both of which are undesirable. The bacteriophage loading mechanism onto nanofibers occurs via three primary pathways: nonspecific adsorption, protein-ligand binding, or electrostatic interactions. In this study, MDR-specific phage Pɸ-Mi-Pa was loaded via nonspecific adsorption, where loading efficiency directly influences the percentage of bacteriophage release. Once MDR-specific phage Pɸ-Mi-Pa is immobilized on the electrospun fiber, it is crucial to ensure that the bacteriophages remain viable and active until their release at the site of action (Opperman, Wojno, Brink, 2022).
SEM results revealed that GA3 fibers were homogeneous, well-aligned, and defect-free, with smooth surfaces, whereas GA1 and GA2 fibers exhibited beaded structures. GA1 fibers were thicker and had a larger fiber diameter than the other two nanofibers, which may be attributed to its longer polymer solution sonication time (36 min). In contrast, GA3, which had a sonication time of 29 min, was not as thick but displayed a denser and more compact fiber arrangement. The thickness, density, and alignment of the fibers are critical factors in ensuring reproducible fiber dissolution and controlled MDR-specific phage Pɸ-Mi-Pa release. The random fiber orientation enhances the mechanical properties of the nanofibers, improving their resistance to tensile forces during handling (Zhang et al., 2021). XRD analysis of GA1, GA2, and GA3 polymer fibers displayed a sharp and narrow peak at 19 °C, indicating that all samples were single-phase in nature. The sharp intensity peaks in the XRD patterns confirm the presence of well-ordered crystalline material, a characteristic feature of the PVA polymer (Pandey et al., 2021). The functional groups of PVA and HA were analyzed using FTIR spectroscopy. The peak at 839 cm-1 was attributed to C-H bending in alkanes. The bands observed at 1,021 cm-1, 1,025cm-1, 1,088cm-1, 1,140cm-1, and 1,245cm-1 correspond to C-O stretching in carboxylic acids. A ‘V bending’ of C-H was detected at 2,915 cm-1, while C=C stretching in alkynes and phenyl rings was observed at 1651 cm-1 and 1,655 cm-1 and 1,655 cm-1, respectively. Additional stretching vibrations were detected at 2,911 cm-1 and 3,291 cm-1, corresponding to C-H stretching in alkanes and O-H stretching in phenols.
Thermal degradation of GA1, GA2, and GA3 nanofibers was investigated to assess the stability of the electrospun scaffolds using thermo-gravimetric analysis (TGA). TGA is a widely applied technique used to measure changes in material mass as a function of temperature or time in a controlled heating environment (Stie et al., 2022). This analysis helps determine whether the materials meet decomposition requirements. All three nanofibers (GA1, GA2, and GA3) underwent thermal breakdown, with the first degradation occurring between 300 °C and 368 °C. The results confirm the nanofibers remain thermally stable at temperatures below 250 °C. The heating curve of the fibers followed a sigmoidal pattern, indicating a correlation between mass variation and temperature change (Ojo et al., 2024). The tensile strength of the fibers is influenced by their anisotropy, which refers to nonuniformity in tensile strength depending on the fiber orientation within the collective fiber mat. Randomly arranged nanofibers exhibit lower tensile strength compared to those aligned in a single direction. Among the tested fibers, GA1 exhibited the highest tensile strength, which correlates with its longer sonication time. This suggests that increasing the sonication time of the polymer solution enhances tensile strength. This phenomenon can be explained by the effect of sound vibrations, which detangle and align polymer molecules, leading to crystalline structure modifications. These structural changes result in the formation of fibers with a higher elastic modulus and greater tensile strength (Bethwel et al., 2016). DSC results revealed that GA1 and GA3 fibers did not exhibit glass transition or crystallization points, while GA2 showed both glass transition and crystallization points.
GA1, which was selected as the optimal electrospun fiber, was loaded with Pɸ-Mi-Pa bacteriophage using the electrospraying technique. This method was chosen because it is simpler and milder than other loading techniques, ensuring that the bacteriophage remains viable throughout the process. At pH 7.4, bacteriophage release exhibited a gradual increase, reaching a plateau after 5 h. In contrast, at pH 5 (which closely resembles vaginal pH), there was a burst release of Pɸ-Mi-Pa bacteriophage within the first 5 min, followed by an immediate plateau. The release kinetics appeared to be faster at pH 5 than at pH 7.4, likely due to the acidic environment, as nanofibers are known to release drugs at an accelerated rate at lower pH levels (Altinbasak et al., 2023).
Based on statistically designed experiments using XGBoost, the optimal values derived were 1.567% for PVA, 0.366% for HA, and a sonication time of 0.485 h. Using these optimized parameters, three sets of bacteriophage-loaded nanofibers were successfully fabricated and characterized: GA1, GA2, and GA3, each produced with varying sonication times. Fiber diameters for GA1, GA2, and GA3 were 330 ± 22 nm, 236 ± 25 nm, and 202 ± 16 nm, respectively. GA1, which exhibited the highest tensile strength, was selected as the optimal nanofiber for MDR-specific phage Pɸ-Mi-Pa loading. The release profile of MDR-specific phage Pɸ-Mi-Pa was found to be higher in a pH 5.0 environment (similar to vaginal pH) compared to a pH 7.4 medium. The nanofibers exhibited a burst release effect, which then stabilized over 24 h. This study successfully fabricated optimized MDR-specific phage Pɸ-Mi-Pa-loaded nanofibers composed of polyvinyl alcohol (PVA) and hyaluronic acid (HA) using the XGBoost algorithm. These nanofibers demonstrate great therapeutic potential, serving as a prototype for future development and the translation of innovation from benchtop to bedside. Their application could significantly improve clinical prognosis and enhance the treatment of antibiotic-resistant biofilm infections, such as bacterial vaginosis, through phage therapy. The main limitation of this study is the small dataset size, which poses a risk of developing a model that may not generalize well to real-world data.
ACKNOWLEDGEMENTS
The authors would like to acknowledge the Department of Pharmaceutics and Pharmaceutical Technology for providing access to their facilities and equipment throughout the duration of this study.
Professional English language editing for this manuscript was provided byAptos Comunicação Editorial (contato@aptoseditorial.com) upon recommendation from the Brazilian Journal of Pharmaceutical Sciences.
-
FUNDING
This research was funded by MEDAFRICA Foundation Inc., Scotch Plains, NJ, USA, under award number 01/2021/22.
-
DECLARATION OF ORIGINALITY
The authors confirm that this manuscript has not been published and is not under consideration for publication elsewhere.
DATA AVAILABILITY
Data will be made available upon request.
REFERENCES
- Abadi B, Goshtasbi N, Bolourian S, Tahsili J, Adeli-Sardou M, Forootanfar H. Electrospun hybrid nanofibers: Fabrication, characterization, and biomedical applications. Front Bioeng Biotechnol. 2022;10:1-38.
- Altinbasak I, Kocak S, Colby A, Alp Y, Sanyal R, Grinstaff M, et al. pH-Responsive nanofiber buttresses as local drug delivery devices. Biomater Sci. 2023;11:813-821.
- Amenaghawon N, Yerimah L. Application of Plant Oils and Surfactants as Stimulating Agents for Optimum Citric Acid Production from Cassava Bagasse. Agric. Food Sci. 2020;11:32.
- Amenaghawon NA, Okhueleigbe KE, Ogbeide SE, Okieimen C. Modelling the Kinetics of Steam Distillation of Essential Oils from Lemon Grass (Cymbopogon Spp.). Int J Appl Sci Eng. 2014;12:107
- Azevedo B, Rocha A, Pereira A. Hybrid approaches to optimization and machine learning methods: a systematic literature review. Mach Learn. 2024;1:1-43.
- Barardo D, Newby D, Thornton D, Ghafourian T, Magalhães JP, Freitas A. Machine learning for predicting lifespan-extending chemical compounds. Aging. 2017;9:1721-1737.
- Bethwel T, Nermin F, Al-Oufy A, El-Messiry M. Effect of polymer concentration on the morphology and mechanical characteristics of electrospun cellulose acetate and poly (vinyl chloride) nanofiber mats. Alex Eng J. 2016;55:2975-2984
- Cardoso-Daodu I, Ilomuanya M, Amenaghawon A, Azubuike C. Artificial neural network for optimizing the formulation of curcumin-loaded liposomes from statistically designed experiments. Prog Biomater. 2022;11:55-65.
- Cardoso-Daodu I, Ilomuanya M, Azubuike C. Development of curcumin-loaded liposomes in lysine-collagen hydrogel for surgical wound healing. Beni-Suef Univ J Basic Appl Sci. 2022;11:1-13.
- Chen T, Chi T. On the improvements of the particle swarm optimization algorithm. Adv Eng Softw. 2010;41:229-239.
- El-Shibiny A, El-Sahhar S. Bacteriophages: the possible solution to treat infections caused by pathogenic bacteria. Can J Microbiol. 2017;63:11.
- Ilomuanya M, Bassey P, Ogundemuren D, Ubani-Ukoma U, Tsamis A, Fan Y, et al. Development of Mucoadhesive Electrospun Scaffolds for Intravaginal Delivery of Lactobacilli spp, a Tenside, and Metronidazole for the Management of Bacterial Vaginosis. Pharmaceutics. 2023;15:1263
- Ilomuanya M, Salako B, Ologunagba M, Shonekan O, Owodeha-Ashaka K, Osahon S, Amenaghawon N. Formulation and Optimization of Metronidazole and Lactobacillus spp. Layered Suppositories via a Three-Variable, Five-Level Central Composite Design for the Management of Bacterial Vaginosis. Pharmaceutics. 2022;14:2337.
- Jolivet-Gougeon A, Bonnaure-Mallet M. Biofilms as a mechanism of bacterial resistance. Drug Discov Today Technol. 2014;11:49-56.
- Kalelkar P, Riddick M, García J. Biomaterial-based antimicrobial therapies for the treatment of bacterial infections. Nat Rev Mater. 2022;7:39-54.
- Khamparia A. Comparison of RSM, ANN and Fuzzy Logic for extraction of Oleonolic Acid from Ocimum sanctum. Comput Ind. 2020;117:103200.
- Khatti T, Naderi-Manesh H, Kalantar SM. Application of ANN and RSM techniques for modeling electrospinning process of polycaprolactone. Neural Comput Applic. 2017;31:239-248.
- Kizildag N. Smart composite nanofiber mats with thermal management functionality. Sci Rep. 2021;1:4256
- Luraghi A, Peri F, Moroni L. Electrospinning for drug delivery applications: A review. J Control Release. 2021;334:463-484.
- Malik D, Sokolov I, Vinner G, Mancuso F, Cinquerrui S, Vladisavljević G, et al. Formulation, stabilization and encapsulation of bacteriophage for phage therapy. Adv Colloid Interface Sci. 2017;249:100-133.
- Mendoza García M, Izadifar M, Chen M. Evaluation of PBS Treatment and PEI Coating Effects on Surface Morphology and Cellular Response of 3D-Printed Alginate Scaffolds. J Funct Biomater. 2017;8:48.
- Nami Y, Imeni N, Panahi B. Application of machine learning in bacteriophage research. BMC Microbiol. 2021;21:193.
- Odukoya O, Nwaneri S, Odeniyi I Akodu B, Oluwole E, Olorunfemi G, et al. Development and Comparison of Three Data Models for Predicting Diabetes Mellitus Using Risk Factors in a Nigerian Population. Healthc Inform Res. 2022;28:58-67.
- Ojo OE, Ilomuanya MO, Cardoso-Daodu IM, Sekunowo OI, Gbenebor OP, Oladimeji IK, et al. Mupirocin/ hydroxyapatite composite suspended in transcutol P-spiked hydrogel: In vitro characterization and in vivo wound healing assessment. Am J Pharmacother Pharm Sci. 2024;11.
- Opperman CJ, Wojno JM, Brink AJ. Treating bacterial infections with bacteriophages in the 21st century. S Afr J Infect Dis. 2022;37:a346.
- Pallavali R, Degati V, Lomada D, Redd M. Isolation and in-vitro evaluation of bacteriophages against MDR bacterial isolates from septic wound infections. PLoS ONE. 2017;12:e0179245.
- Pandey A, Dalal S, Dutta S, Dixit A. Structural characterization of polycrystalline thin films by X-ray diffraction techniques. J Mater Sci: Mater Electron. 2021;32:1341-1368.
- Qvortrup K. Biological field emission scanning electron microscopy. New Jersey. Wiley. 2019. 100.
- Rustam R, Gunawan A, Kresnowati P. Artificial Neural Network Approach for the Identification of Clove Buds Origin Based on Metabolites Composition. Acta Polytech. 2020;60:440-447.
- Santos S, Carvalho C, Sillankorva S, Nicolau A, Ferreira E, Azeredo J. The use of antibiotics to improve phage detection and enumeration by the double-layer agar technique. BMC. 2009;9:148.
- Silva J, Dias R, Junior M, Marcelino M, Silva A, Carmo M, et al. A Rapid Method for Performing a Multivariate Optimization of Phage Production Using the RCCD Approach. Pathogens. 2021;10(9):1100.
- Stie B, Gätke J, Chronakis I, Jacobsen J, Nielsen H. Mucoadhesive Electrospun Nanofiber-Based Hybrid System with Controlled and Unidirectional Release of Desmopressin. Int J Mol Sci. 2022;23:1458.
- Vonasek E, Lu P, Hsieh Y, Nitin N. Bacteriophages immobilized on electrospun cellulose microfibers by non-specific adsorption, protein-ligand binding, and electrostatic interactions. Cellulose. 2017; 24:4581-4589.
- Widanage C, Mohotti D, Lee C, Wijesooriya K, Meddage D. Use of explainable machine learning models in blast load prediction. Eng Struct. 2024; 312: 118271.
- Xue J, Wu T, Dai Y, Xia Y. Electrospinning and Electrospun Nanofibers: Methods, Materials, and Applications. Chem Rev. 2019;8:5298-5415.
- Zhang H, Zhu L, Zhang F, Yang M. Effect of Fiber Content and Alignment on the Mechanical Properties of 3D Printing Cementitious Composites. Materials (Basel). 2021;14:2223.
- Zhou B, Yang R, Li H, Wang Y, Zhang C, Xiao Z, et al. Numeric and nonnumeric information input to predict adsorption amount, capacity and kinetics of tetracyclines by biochar via machine learning. Chem Eng J. 2023;471:144636.
Edited by
-
Associate Editor:
Marcílio Cunha Filho