 Unlocking Dabrafenib’s Potential: A Quality by Design (QBD) Journey to Enhance Permeation and Oral Bioavailability through Nanosponge Formulation
Abstract
This research aims to create dabrafenib (DBF)-loaded nanosponges (NSPs) using β-cyclodextrin (β-CD) and diphenyl carbonate (DPC) as linker to improve oral bioavailability. DBF-loaded β-CD NSPs were synthesized by finely adjusting the molar ratio of β-CD to DPC and optimizing the stirring rate and duration using design methodology. After being loaded with DBF, the produced β-CD NSPs were characterized in terms of particle size, zeta potential (Z.P), polydispersity index (PdI), and drug entrapment efficiency (E.E). Studies on compatibility were carried out with FTIR (Fourier Transform Infrared Spectroscopy) and DSC (Differential Scanning Calorimetry). Permeability, in vivo, and in vitro experiments were performed on the improved NSPs and the pure medication. After optimizing DBF-loaded β-CD NSPs, a formulation with a mean size of 158.0 ± 7.2 nm, PdI of 0.282 ± 0.0044, and E.E of 86.23 ± 2.45% was obtained, based on the assessments indicated earlier. Zeta sizer, SEM, spectrum analysis, in vitro release, and pharmacokinetic tests were among the other analyses that further validated the optimization. An area under the curve (AUC0-t) of 7.95-fold greater and a Cmax 7.356 times higher than those of the free drug was demonstrated by the optimized β-CD NSPs, which showed a notable boost. The use of DBF-loaded NSPs holds promise as an effective strategy for enhancing release and bioavailability in the treatment of melanoma.
Keywords:
Box-Behnken design; Cross-linker; Cyclodextrin; Solubility; Dabrafenib; Diphenyl carbonate; Quality by Design
INTRODUCTION
Melanomas are fast-growing, aggressive tumors that are the most lethal type of skin cancer. A mutation known as BRAFV600, which results in a valine-glutamine substitution at terminal 600 of the BRAF serine/threonine kinase, is present in about 50% of patients suffering metastatic melanomas(Davies et al., 2002; Radovic et al., 2012). Targeted therapy focuses on genetic mutations within molecules to stop melanoma cells from proliferating. High response rates are achieved when treating melanoma individuals who have BRAFV600 mutations by using BRAF inhibitors (BRAFi), which specifically target the BRAF V600E/K genetic abnormality (Flaherty et al., 2010; Robert et al., 2015). Dabrafenib (Tafinlar) is a BRAF inhibitor, a type of targeted therapy called a signal transduction inhibitor that reduces tumor size and extends survival in patients with advanced melanoma. The US FDA approved it in 2013 (Falchook et al., 2012). When a BRAFi is used with a MEK inhibitor, the average response time increases from 5.6 to 9.5 months (Long et al., 2017). A BCS Class II medicine with low solubility and high permeability is dabrafenib mesylate salt (DBF. MS), available for purchase. It appears white to slightly pink and is almost insoluble in aqueous solutions with a pH range of 4-8(Rai et al., 2020). It is categorized as a Class II drug and has poor aqueous solubility (0.00327 mg/mL), it exhibits an uncertain and delayed absorption rate, leading to significant differences between and within subjects. With three different pKa values (6.6, 2.2, and -1.5) and a log P value of 2.9, indicating significant lipophilicity, new solid forms of dabrafenib must be made to improve solubility (CHMP, 2015). The dissolution rate of a poorly water-soluble active compound ultimately dictates absorption speed, consequently influencing oral bioavailability(Dressman et al., 1998; Löbenberg, Amidon, 2000). The drug is also reported to have fast-fed variability. Thereby, it will lead to tremendous variability in bioavailability as the drug is administered orally.
Attempts have been made to increase DBF’s solubility and rate of dissolution. These include cocrystals, nanoconstructs based on human serum albumin, functionalized nanocarriers with folate and transferrin ligands, and gold nanoparticle carriers(Pham et al., 2021; Running et al., 2018). Though each of these methods has some benefits for managing the release, a significant disadvantage is their high cost, which makes it challenging for the patient to receive therapy. Moreover, no prior study has examined how formulation affects intestinal permeability and drug absorption.
Another proven technique for increasing drug solubility, dissolving rate, and enhancing the bioavailability of medications with limited water solubility is the production of nanosponges. Nanosponges (NSPs) are innovative hyper-cross-linked structures composed of solid nanoparticles with colloidal size and nanosized cavities. β-CD-based nanosponges are an obvious candidate for drug administration because of their long-lasting drug release, increased stability, high carrier capacity, and potential to include both hydrophilic and hydrophobic molecules with higher bioavailability by changing the drug’s pharmacokinetic properties(Sherje et al., 2017; Trotta, Zanetti, Cavalli, 2012; Utzeri et al., 2022). Extensive research has been conducted on nanosponges, encompassing drug delivery, preparation methods, and reported applications(Almutairy et al., 2021; Real et al., 2021; Utzeri et al., 2022). Therefore, the development of non-toxic formulations that can transport DBF to the intended site and release it gradually is necessary to minimize both nonspecific biodistribution and toxicity from drug overdose. NSPs are an affordable, scalable, and straightforward production technique. Consequently, given the substantial benefits, turning the drug into a sponge with nanoscale appears to be a viable choice.
The primary objective of this study was to enhance bioavailability by formulating β-CD NSPs encapsulating DBF and facilitating controlled release at the targeted site. The experiment design here investigated the effects of several process and formulation characteristics. The optimized formulation was investigated using DSC, SEM (Scanning Electron Microscopy), and FTIR. To improve bioavailability, permeability, pharmacokinetic, and in vitro release experiments were carried out. The new nanosponges (β-CD NSPs) demonstrated the ability to function as DBF nanocarriers, storing and releasing it gradually over an extended period.
MATERIAL AND METHODS
Material
Dabrafenib pure drug was acquired from Hetero Drugs Ltd., Hyderabad, India. Sigma Aldrich, US, supplied β-Cyclodextrin (β-CD), Diphenyl carbonate (DPC), and Glutaraldehyde (25% Aqueous Solution)). Solvents were acquired from S.D. Fine Chemicals, Hyderabad. Hi-media Pvt. Ltd. supplied the dialysis membrane (cut off MWt. 12 kDa).
Methods
Using diphenyl carbonate (DPC) as a cross-linking agent and an ultrasound-assisted technique, we created β-cyclodextrin (β-CD; polymer) based nanosponges (NSPs) with a 1:6 composition (β-CD: DPC) as per the earlier reports with slight modification(Aldawsari et al., 2023). In a 250 mL flask, anhydrous β-CD was dissolved in dimethyl formamide, and DPC was incorporated into the reaction mix and refluxed at 90 °C while stirring in an oil bath until liquefied. Following the reaction, the product was purified by Soxhlet extraction with ethanol for six hours, followed by a water wash and overnight drying at 60 °C of the resulting white powder. After the material was dried, a mortar and pestle were used to grind it into a fine powder. The resulting mixture was then combined with water once more. The colloidal fraction suspended in water was removed using the process of lyophilization (LABFREEZE; Model no: FD-10-80 Series).
Fabrication of Dabrafenib-loaded β-CD NSPs
Dabrafenib-loaded nanosponges (NSPs) were prepared via the lyophilization technique. NSPs (500 mg) were dispersed in 100 mL of distilled water using a mechanical stirrer (RQ 121-D, Remi India). 300 mg of the drug was added to this mixture and subjected to probe sonication (Sonics & Materials, Inc., Vibracell, 750) for 20 min in a cold environment to prevent aggregation.
Stirred continuously at 1000 rpm for 3 hours, and subsequently, performed sonication. The suspension was then centrifuged at 7500 rpm for 12 minutes (Micro III, Remi India Pvt., Ltd) to separate the uncomplexed drug. A lyophilizer (Skadi-Europe; Model no.: FD5508) was used to separate and freeze-dry the colloidal supernatant at a temperature of -20 °C and a pressure of 13.33 mbar. Following lyophilization, the resultant dry powder was kept in a desiccator.
Formulation by Design (FbD) methodology
It would be ideal to conduct a methodical analysis of the effects of many factors on the final product. From then on, dabrafenib-loaded β-CD NSPs were created using Quality by Design (QbD), a scientific approach with predetermined objectives. Regulatory agencies like the USFDA, TGA, and others endorse using QbD in product development. Both business and academia have given this much attention(Palanati, Bhikshapathi, 2023). As per ICH Q8, the predetermined goals encompass understanding risk beforehand, conducting trials, and managing information across the complete product life cycle (R2). Compared to conventional approaches, Quality-Based Development (QbD) ensures product quality at a reduced cost and facilitates a deeper understanding of the entire process(Yu et al., 2014). The term FbD (Formulation by Design) has supplanted QbD in the perspective of the formulation stage. Like QbD, FbD shares commonalities but differs by emphasizing critical formulation attributes (CFAs) instead of critical material characteristics or attributes (CMAs). This approach involves categorizing critical success factors (CFAs), critical process parameters (CPPs), and essential quality characteristics (CQAs) in addition to doing risk analysis and creating a quality-targeted product profile (QTPP). Generating a design space entail investigating screening factors via experimental strategy. The design space, representing a multidimensional relationship of variables, delineates feasible and non-feasible zones. Regulatory authorities do not consider operating within a design environment a deviation (Rangaraj et al., 2019; Shah et al., 2008; Shah et al., 2010).
Experimental Design
The experiment design is the systematic process of ascertaining how input elements (CFAs and CPPs) affect the CQA. Box-Behnken design (BBD) response surface techniques were utilized to optimize the relevant parameters. A block and factorial design that still needs to be completed (abbreviated as BBD) lowers the required sample size for coefficient estimates. They are regarded as being more affordable than other designs (Moin et al., 2020). To evaluate the impact of independent variables (A) Molar ratio (P: CL), (B) Stirring Speed (rpm), and (C) Stirring Duration (mins) on dependent variables (X) P.S, (Y) PdI, and (Z) E.E, Table I illustrates the use of a three-level, three-element BBD architecture. Design Expert® software (Version 12.0.2, Stat-Ease Inc., Minneapolis, MN, USA) was used to examine the response surface utilizing contour (2D), response surface designs, and predicted vs. actual plots.
Assess for the Optimal Formulation and Confirmation of the Design
The desirability function was employed to streamline the search process to identify the most workable preparation. The goal values produce an attractiveness value between 0 and 1. The more specific the anticipated outcomes are, the higher the value. In addition, pictorial optimization was carried out using the design space (Bagul et al., 2024). Design validation was accomplished by checkpoint testing. After finishing three confirmatory checks, the outcomes were compared to the estimated values.
HPLC analysis
Equipment
An undisturbed sustained Symmetry ODS C18 column (250 x 4.6 mm in diameter, 5-micron meter particle size), Shimadzu (Shimadzu Prominence pump model -LC-20AD) HPLC with Diode Array APG-M20 A detector, was used to complete the chromatographic separation. The DBF was measured at 224 nm using UV absorbance. The calibration curve (linearity R2 > 0.999) resulted by spiking DBF. The mobile phase comprises methanol and disodium hydrogen phosphate buffer 0.01 M (80:20) v/v. A membrane filter (0.45 µm) was used to riddle the mobile phase, and ultrasonication was used to degassing the filter. The 0.8 mL/min flow rate was maintained in an isocratic mode. After introducing 20 µL of samples, the eluents were examined at a wavelength of 224 nm. DBF was weighed to prepare the primary stock (1 mg/mL). Next, a calibration curve between 0.250 and 200 ng/mL was created using a secondary stock that contained 100 µg/mL. The primary stock (1 mg/mL) was prepared by weighing DBF and sorafenib (internal standard). Next, utilizing a secondary stock containing 100 µg/mL, a curve for calibration between 0.250 and 400 ng/mL was produced (Rai et al., 2020).
The linearity equation was found to be y = 5361.6x + 3500 with r2 value of 0.9997. Duplicates of 5 concentration levels of 0.25, 1, 10, 150, 300 and 400 ng/ml of DBF in movable phase on day-1and for 3 succeeding days were processed for the evaluation of precision. The % RSD findings for inter-day precision were 0.74, 0.98, 0.342, 0.781, 1.074 and 0.664 in respective concentrations. The % RSD findings of intra-day precision were 0.72, 0.049, 1.21, 0.894 and 0.162. % RSD values were found to be < 2.0 %. Recovery studies were executed at the concentration levels of 100, 150 and 200 ng/ml for thrice by spiking the drug and internal standard to the rat plasma. Then sample preparation was executed as mentioned in the manuscript and injected into the chromatographic system. The average recovery findings were found in between 98.23 to 99.02 %. System suitability of analyte and internal standard was processed and the parameters like retention time, theoretical plates, % RSD and resolution were evaluated, and the values were within the limits.
Evaluation and Physicochemical Characterization
Studying Phase Solubility
A phase solubility investigation was conducted with an aqueous solution containing different concentrations of β-CD (0-10 mM) to disperse excess medication. Conical flasks were shaken for 72 hours at 25°C at 100 rpm. The supernatant was collected, the filtrate was diluted, and then the filtrate was examined using a spectrophotometric (UV) method at 340 nm (Jasco V-630). The phase solubility graph was used to calculate the stability constant (Kc) accurately. (Russi et al., 2023).
Drug Entrapment efficiency (E.E)
The efficacy of encapsulation can influence the therapeutic efficacy, stability, and release kinetics of the loaded compounds within the nanosponges.
The amount of drug substance successfully encapsulated or entrapped within the nanosponges or nanocarriers throughout the formulation process is called entrapment efficiency. Drug loading is the amount of drug loaded per unit weight of the nanoparticle, indicating the percentage of the nanoparticle’s mass attributable to the encapsulated drug. Dichloro methane was used to dissolve a particular quantity of loaded drug (DBF)-containing nanosponges (NSPs). The complex was dissolved by subjecting the solution to sonication for 12 minutes. The resultant solution was then suitably diluted and subjected to High-Performance Liquid Chromatography analysis (HPLC). UV absorbance was used to detect the medication (DBF) at a wavelength of 224 nm-this analytical method aimed to determine whether DBF was present in the nanobubble formulation and at what concentration. The following formulae can be used to calculate the same.
Particle Size (P.S), Polydispersity Index (PdI), and zeta potential (ZP)
The P.S. and PdI of CDSNPs were ascertained via DLS (dynamic light scattering) analysis in a Malvern zeta sizer (Malvern Instruments, UK). The samples were diluted ten times, dispersed in double-distilled water, and examined on a Zeta sizer (Malvern) at 25 °C. Every measurement was done thrice, and particle size and the PdI values were computed(Anwer et al., 2023). The ZP values were calculated from the electrophoretic mobility as determined by Laser Doppler Electrophoresis after the NSPs samples were diluted with one mmol/L of NaCl solution and placed in electrophoretic cells.
Morphology using Scanning electron microscopy (SEM)
Using a Quanta FESEM 250 SEM, the structure of the nanosponges was captured. Before testing, the sample was mounted atop aluminum pin stubs after being double-sided carbon tape-mounted and Au-sputter coated utilizing an ion splutter. The samples were then analyzed at a working distance of 10 mm, with an acceleration current of 30 kV and a magnification of 500-10,000 folds.
Fourier-Transform Infrared (FTIR) Spectroscopy
The spectrum of FTIR was obtained using spectroscopy Perkin Elmer (Model 1600; USA). The drug in its pure form, the drug in its physical mixture, and the optimized drug loaded β-CD NSPs were all analyzed at wave numbers 4000-450 cm-1 with a resolution of 1.0 cm-1 (Swaminathan et al., 2013).
Differential Scanning Calorimetric study
DSC (DSC-60, Shimadzu Corp., Japan) was employed to ascertain the drug’s physical structure and the potential for chemical interactions with the excipients. Samples of 3-5 mg (drug, PM, and optimized drug loaded β-CD NSPs) were heated (range 50-400 °C, 5 °C/min) in crimped aluminum pans in a nitrogen environment before being subjected to DSC analysis following calibration using Indium and lead standards. The melting point (MP) and the enthalpy of fusion were computed automatically (Moin, et al., 2020).
Drug release (DR)
In vitro release studies of (PD) pure drug and optimized drug-loaded β-CD NSPs were conducted using a shake flask with a dialysis bag. After being enclosed in dialysis membranes, the samples were placed in a conical flask with phosphate buffer (pH 6.8), kept at 37 °C, and rotated continuously at 100 rpm. One milliliter (1 mL) sample was removed from the outer solution and replaced with brand-new PBS at pH 6.8 at predefined intervals. These aliquots were filtered and analyzed at 224 nm using HPLC analysis to measure drug release. Three duplicates of the experiment were carried out. Several kinetic models (0 order, 1st order, Higuchi, and Korsmeyer-Peppas models) were fitted to drug release data. The highest correlation coefficient (R2) was used to determine the most suitable model. The slope and R2 values were used to calculate the release-exponent value, representing the drug release mechanism (Aldawsari et al., 2023).
Stability studies
The optimized drug loaded β-CD NSPs were stored at various storage settings (5 ± 3 °C, 40 ± 2 °C, and 25 ± 2 °C) as per the ICH stability protocol. At specified time intervals( 0,15 days,1, 2, and 3 months), P.S, PdI, and E.E were assessed (Palanati, Bhikshapathi, 2023).
Ex-vivo permeability studies
Following a few minor modifications, an ex vitro study using an inverted intestinal pouch was carried out using earlier described techniques (Neerati, Kumar Bedada, 2015).The protocol (1447/PO/Re/S/11/CPCSEA-81/A) has been certified by the IAEC (Institutional Animal Ethical Committee).In brief, the male Wistar rats were randomly assigned to two groups (PD and drug-loaded β-CD NSPs), each including three animals. Both animal groups received anesthetic ether treatment following euthanasia. The intestines were surgically removed, and then 50 mL of ice-cold saline was washed afterward. A 5-cm section of the ileum was isolated after splitting the small intestine. One millilitre of samples containing PD and drug-loaded β-CD NSPs (1.5 mg) was placed into each of the conventional sacs on the mucosal side, and either side of the sacs was tied firmly. Sacs filled with pure drug dispersion and β-CD NSPs formulation were placed in a beaker containing 40 mL of PBS (pH 7.4) and experimented.
Samples (3 mL) were collected at predetermined periods (10 mins to 120 min) to quantify the sum of drug transit from the mucosal (M) to the serosal (S) side. The sum of drug transported from the M side to the S side was measured with established HPLC method as discussed previously at 224 nm. The apparent permeability coefficient (Papp) was computed using the following formula.
Where dQ/dt signifies the drug transport rate in the serosal medium, A is the gastrointestinal sacs’ surface area, and C0 is the starting concentration within the sacs.
SPIP (In-situ single-pass intestinal perfusion) technique
The invasive method and SPIP investigation were carried out using previously documented protocols(Neerati, Kumar Bedada, 2015).
In succinct terms, the animals were divided into two groups, each comprising three individuals. One group was treated with PD, and the other with the NS formulation. Rats were given thiopental sodium intraperitoneally at a dose of 50 mg/kg to induce anaesthesia. The rats’ abdominal sections were carefully cut 3-4.5 cm along the midline to separate an approximately 10 cm ileal segment, with the ileocaecal connection acting as a distal indicator. Both ends of the ileum were cut, and the lumen was cleaned with normal saline at 37 °C before cannulation with silk sutures holding the tube in place. The drug-free perfusion medium (PBS pH 7.4) was then supplied with a syringe pump (Olives India) at a rate of 1 mL/min for five minutes. Following this, PD (dispersed in 0.5% w/v Sodium carboxymethylcellulose) and the drug-loaded β-CD NSPs formulation were administered continuously at a 0.2 mL/min flow rate for 120 minutes. The intestine portion was wrapped with sterile cotton soaked with isotonic solution during the study. The perfusate sample was gathered and kept at -80 °C at predetermined intervals every ten minutes until analysis. Using an established HPLC technique, the drug concentrations in perfusion collections were measured with a maximum wavelength of 224 nm. The steady-state levels of outflow perfusate at the designated time points served as a basis for the calculations. A parallel tube theory computed the steady-state intestinal effective permeability (Peff).
Where Q = perfusion rate at a flow rate of 0.2 mL/min, r = radius of the intestinal segment (0.18 cm), and l = length of the intestinal segment which was 10 cm. Cin and Cout represent the solute concentrations at the inlet and exit, respectively.
Pharmacokinetic studies (PKs)
The Nutrition National Institute (NIN), situated in Telangana, India, provided the male Wistar rats used in the study, which had an approximate weight of 200 ± 20 g and an age of 4-5 weeks. Every animal study followed the “In accordance with the “Guidelines for Care and Use of Laboratory Animals,” the Institutional Animal Ethics Committee (IAEC) officially sanctioned the protocols designated by the assigned protocol number. 1447/PO/Re/S/11/CPCSEA-81/A. Animals were exposed to natural light/dark settings for one week, where they were acclimated to a relative humidity of 40-60 % and a temperature of 20 ºC ± 2 ºC. After that, they were randomly divided into three groups of six animals. The optimized drug-loaded β-CD NSPs (30 mg/kg BW), the vehicle, and the pure drug (dispersed in 0.5% w/v Sodium carboxy methylcellulose) were administered by oral route. Blood specimens (250 µL) were removed via the retroorbital plexus and placed into sterile test tubes impregnated with EDTA at predetermined intervals (0.25, 0.5, 1, 2, 4, 6, 12, 24 h). An Eppendorf centrifuge was used to centrifuge blood samples for ten minutes at 7500 rpm. The extracted plasma was processed and examined using high-performance liquid chromatography (HPLC).
The extraction of a sample for bioanalysis
DBF was recovered from plasma samples via the protein precipitation method. The drug was successfully extracted from plasma by adding acetonitrile (250 µL) to rat plasma (50 µL) and vortexed. The supernatant was centrifuged for 10 minutes at 8500 rpm and then analyzed using Chromatography at a λmax of 224 nm.
Data Analysis
Data analysis was performed using WinNonlin (version 3.1; Pharsight et al., USA) on the acquired concentration-time profile. The pharmacokinetic variables were examined using the non-compartmental methodology.
Statistical Analysis
The pharmacokinetic variables’ standard deviation (SD) was represented as Mean ±. The variables were further examined using GraphPad Prism’s statistical analysis program (GraphPad Software 8.05 Inc., CA).
RESULTS AND DISCUSSION
Formulation
Hyper-crosslinked cyclodextrin polymers, or NSPs, comprise colloidal-sized solid nanoparticles and nanoscale voids. When stirred, these nanostructured materials produce inclusion and non-inclusion complexes in water, resulting in nanoparticles that are consistently spherical in a nanosuspension. The addition of carbonate linkages to the primary hydroxyl groups of the parent β-CD unit was discovered by structural study of NSPs.(Tejashri, Amrita, Darshana, 2013).
Therefore, the medication molecules may be enclosed in the β-CD nanocaves. Cross-linking may suggest further contacts between the guest molecules and multiple β-CD units. Furthermore, the cross-linking possibly will create nano-channels for the polymer mesh in the NSP structure. The unique structural arrangement of nanosponges may account for their superior solubilization and protective qualities compared to the parent cyclodextrin(Tiwari, Bhattacharya, 2022). NSPs have been effectively employed by many researchers to increase the effectiveness and stability of anticancer compounds (Ansari et al., 2011; Swaminathan et al., 2013; Torne et al., 2010). The β-CD unit’s outermost primary hydroxyl bonds were substituted with hydrogen to form nanosponges (NSPs). This substitution enables the inclusion of drug compounds into the nanocavities. The cross-linking suggests more β-CD units and increased interactions between guest molecules.
Moreover, the cross-linked network could produce nano-channels in the NSPs polymer mesh structure. This distinctive fundamental arrangement could contribute to the heightened solubilization and protective capabilities of NSPs (Utzeri et al., 2022). Since lyophilization effectively increases stability, the NSPs were loaded using freeze-drying (Schwarz, Mehnert, 1997).
FbD-Based Approach
The objective of Dabrafenib-loaded β-CD NSPs was to improve bioavailability through sustained release. Consequently, a well-defined Quality Targeted Product Profile (QTPP) was established for the formulation and is outlined in Table II.
Experimental design
The study had fifteen runs, with three center locations (refer to Table III). Multiple linear regression created polynomial models by considering linear, quadratic, and two-factor interaction (2FI) factors. The model selection (CV) was done using the coefficient of variance, adjusted R2, and forecasted R2.
P.S. (Particle Size)
In the initial screening, the molar ratio of polymer to cross-linker, stirring speed, and stirring time emerged as the most influential variables impacting mean P.S, E.E, and PdI of dabrafenib β-CD NSPs. These independent variables were investigated individually, varying one at a time to establish their respective ranges. Through experimentation, the molar ratio of polymer to cross-linker (0.2-0.8), stirring speed (2500-5000 rpm), and stirring time (300-420) were identified. The mean particle size (Y1) ranged from 149.8 to 300.6 nm, the polydispersity index (Y2) ranged from 0.262 to 0.441, and the drug encapsulation (Y3) ranged from 66% to 88.1% across all batches. A linear model was fitted to the responses, and Design-Expert software’s ANOVA tests were used to confirm the model’s suitability.
The model F value of 96.44, which suggests a mere 0.01 percent possibility of being due to noise, indicates that the proposed model is ‘quadratic’ and proved noteworthy with an insignificant lack of fit (3.03). Compared to the pure error, there is a 25.76% chance that a lack of fit is insignificant. ANOVA found variables with a p-value of less than 0.0500 to impact the response significantly. The R2 corrected R2 and anticipated R2 estimates were, in order, 0.9943, 0.9840, and 0.9225. The model explored the design space with a sufficient precision of 30.406, exceeding the needed value of 4.
With p-values of less than 0.05, all the typical relationships (A, B, C, AB, A2, B2, C3) significantly affected the outcome. These variables are now regarded as being meaningful, and the subsequent equation for regression is given as follows:
Plots of the 3D response surface, contour, and perturbation functions were used to understand better the primary and interacting effects of all of the individual variables on P.S. 3D response surface plots, and matching contour plots were used further to highlight the link between the independent and dependent variables. Figure 1 illustrates the response surface and contour plots showing the variable effects on particle size (P.S). Furthermore, as shown in Figure 2, the two-dimensional perturbation plot shows the influence of the molar ratio of polymer to cross-linker, stirring speed, and stirring duration on mean particle size and comparison between predicted and actual mean particle size values. An increase in the molar ratio of cross-linker to polymer led to a corresponding reduction in particle size. As the plots show, stirring speed (B) and stirring duration (C) have less influence than A.

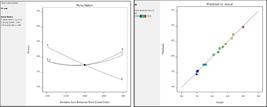
Two-dimensional perturbation plot showing the influence of molar ratio of polymer to cross-linker, stirring speed and stirring duration, on mean particle size and comparison between predicted and actual values of mean particle size.
PdI (Polydispersity index)
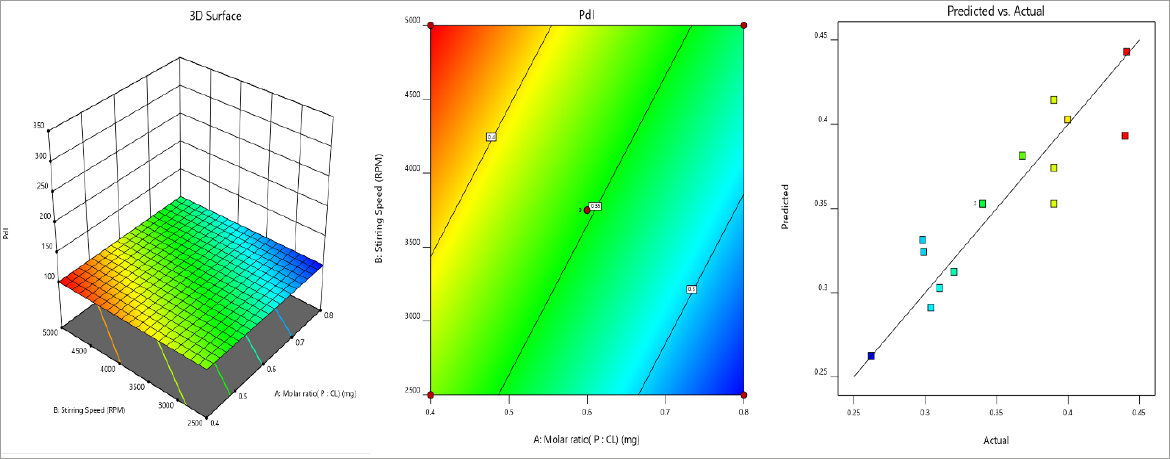
A dimensionless measure of the particle size distribution’s broadness is the Polydispersity Index (PdI). Typically, it falls between 0 and 1(Danaei et al., 2018). A value higher than 0.5 suggested that the particles throughout the framework are hetero-disperse or broadly spread. The developed formulations had PdIs ranging from 0.262 to 0.441. The model F value of 18.27, representing a 0.01% chance that is probably the result of noise, shows a slight lack of fit for the suggested “linear” model, which was significant. According to the F-value (0.71) for lack of fit, the absence of fit is not statistically significant based only on the pure error. The large F-value of the lack of fit has a 70.720 % probability of being caused by noise. Significant factors (p-value < 0.0500) were found via ANOVA, and non-significant variables were removed to enhance the model. In that order, the regression coefficient (R2, adjusted R2, and anticipated R2) values were 0.8329, 0.7873, and 0.6828. The model proved useful for examining the design space, as evidenced by the adequate precision of 13.897, higher than the necessary value of 4.
The model terms (A, C) were learned to have p-values less than 0.050, indicating a substantial impact on the outcome. Consequently, these terms are deemed necessary, and the resulting regression equation is as follows:
Positive coefficients indicate a positive connection, which implies that a rise in the associated variable or variables causes an increase in PdI. A negative correlation is implied by the negative coefficients (-0.0155), which show that a decline in the related variable or variables causes a reduction in PdI. The response surface plots (Figure 3) indicate that the homogenization speed significantly affected the PdI. Every formulation showed a PdI within acceptable bounds, at less than 0.3. Nonetheless, the high stirring speed of the polymer to cross-linker at a low molar concentration resulted in a minor rise in PdI. While faster churning initially results in more monodispersity, faster stirring gives the particles more energy, which reduces their repulsive forces and causes agglomeration. This observation aligns with a size expansion surpassing the ideal homogenization.
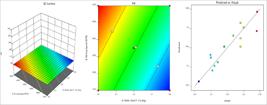
Graphical depiction of response surface, contour plots and predicted vs acutal plots illustrating variable effects on polydispersity index (PdI).
E.E (Drug Entrapment Efficiency)
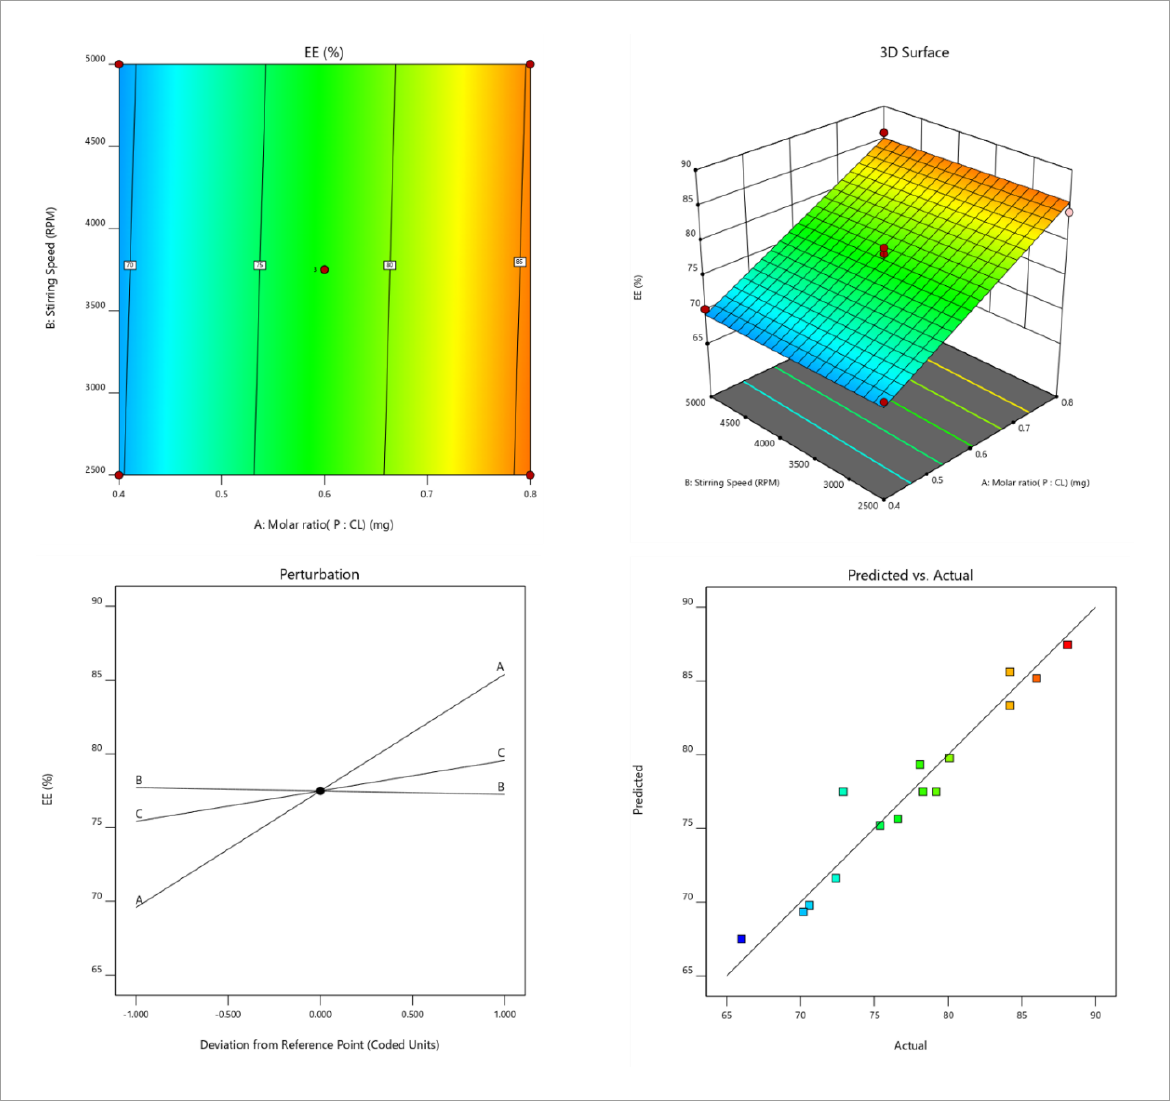
The independent variables’ impact on E.E. ranges from 66 to 88.2 percent. The same is explained using contour and surface response plots and the perturbation and Pred. Vs. Actual plots for P.S, PdI, and E.E are shown in Figure 4.

Graphical representation of response surface and contour plots depicting the impact of variables on drug entrapment efficiency (E.E).
The model F value of 55.39, representing a 0.01% chance that is probably the result of noise, shows that the suggested “ linear “ model was significant and had a negligible fit error.
According to the F-value (0.21) for lack of fit, the absence of fit is not statistically significant based only on the pure error. The lack of fit’s high F-value indicates a 99.2% likelihood that it is caused by noise. Significant factors (p-value < 0.0500) were found via ANOVA, and non-significant variables were removed to enhance the model. In that order, the regression coefficient (R2, adjusted R2, and anticipated R2 values were 0.9382, 0.9213, and 0.9105. The predicted R2 agrees with the adequate R2 with a difference of 0.2. The model proved useful for examining the design space, as evidenced by the adequate precision (signal-to-noise ratio) of 43.07, higher than the necessary value of 4.
The model terms (A, C) were found to have p-values less than 0.050, indicating a substantial impact on the outcome. These terms are therefore considered required, and the regression equation that results is as follows:
A positive connection is indicated by the positive coefficients, which imply that a rise in the associated variable or variables causes an increase in entrapment of the drug.
Exploration for optimized formulation
The design yielded solutions, which were assigned desirability values using the desirability function in numerical optimization. The optimal formulation (Fopt solution) had a maximum attractiveness of 0.970. The optimum parameters were the stabilizer ratio of 0.8%, 2800-rpm stirring speed, and 395 minutes of stirring duration. They narrowed the target values of Critical Quality Attributes (CQAs), namely low P.S. and PdI, and high entrapment efficiency allowed for further graphical customization. Additional Figure 5 presents the design space.

Graphical illustration of desirability and Overlay plot (yellow area denotes the feasible region).
Design confirmation
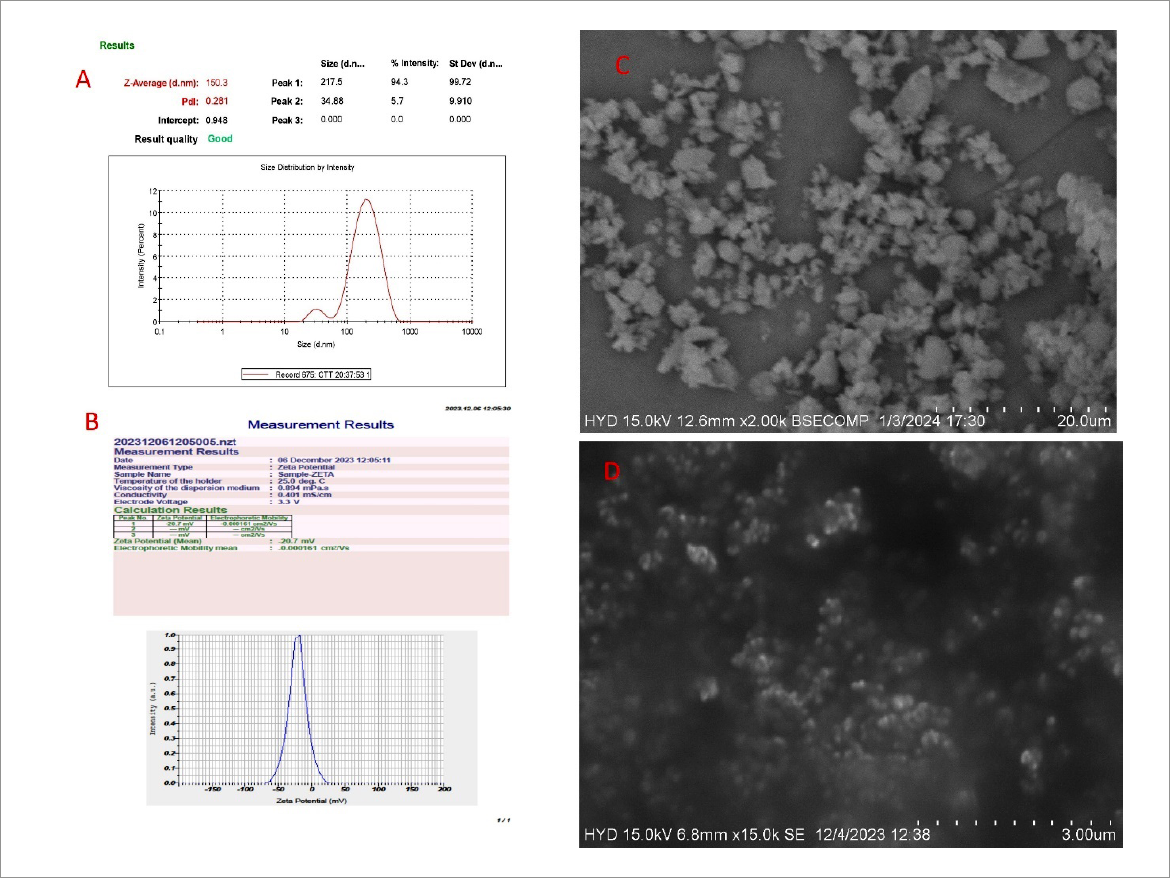
Three checkpoints were used to verify the model’s robustness and formulation accuracy during validation. As indicated in Table IV, the projected mean standards for size, PdI, and E.E values were mentioned, while the observed mean values were 150.3 nm, 0.281, and 86.76, respectively. The proposed model was validated by the close match between the software’s anticipated values and the results achieved from these formulations (Figure 6).

Characterization and evaluation of nanosponges (NSPs)
Phase solubility studies
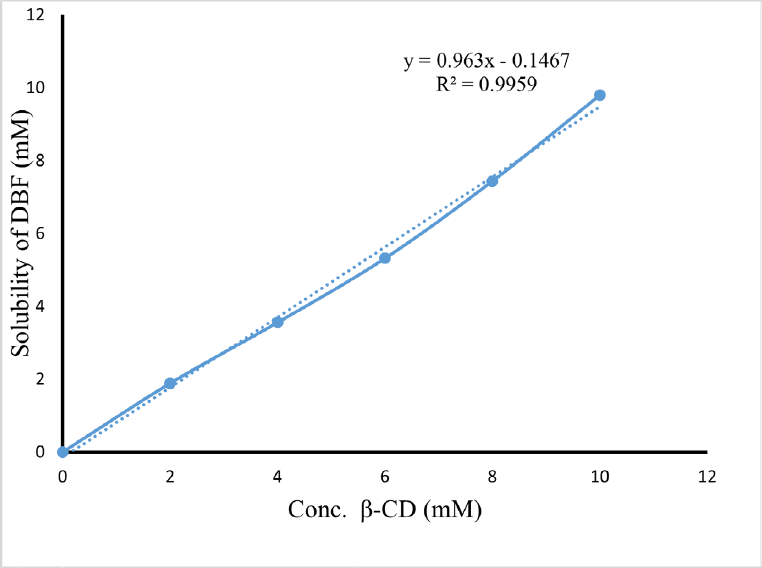
Phase solubility studies are essential for optimizing the inclusion complexes and determining a drug’s affinity for cyclodextrins (CDs). The molar ratio at which the medication forms a compound with CDs is commonly established using this technique. Figure 7 illustrates an AL-type system, with the solubility of DBF showing a linear increase with the concentration of β-CD. A 1:1 molar ratio inclusion complex (DBF: β-CD) is suggested by the slope value, which is less than 1. A stable inclusion complex between DBF and β-CD at a 1:1 molar ratio was generated as shown by the apparent stability constant, K1:1, which was determined to be 129.02 M−1. Intermolecular forces enabled connections with DBF through the cavity of β-CD.

Measurements of particle size (P.S.), polydispersity index (PdI), Zeta potential and Drug entrapment efficiency (E.E)
The range of particle sizes and nanosuspension uniformity were consistent because the produced formulation’s P.S. and PdI ranged from 158.0 ± 7.2 nm to 0.282 ± 0.044. A homogeneous system is indicated by a polydispersity value of less than 0.3. The stability of NSPs can be checked by measuring zeta potential, a property correlated with the double electric layer (DEL) on the surface of colloidal particles. The Z.P. of the optimized formulation was -24.13 ± 4.02 mV. The observed zeta potential decreases because of the stabilizer’s steric stabilizing action, which involves the creation of a polymeric coating around the particles. The small nanoparticle stability demonstrated that higher zeta potentials maintain the stability of the formulation. The Drug entrapment efficiency for the optimized NSPs was found to be 86.23 ± 2.45. The P.S., Zeta potential, SEM image of pure drug, and optimized NSPs are depicted in Figure 8.

Fourier Transform Infrared Spectroscopy (FTIR)
The FTIR spectra of pure drug, physical mixture, blank β-CD-NSPs, and drug-loaded β-C D-NSPs are presented in Suppl. Figure 1.
The wavelength and the corresponding groups seen in the spectra of β-CDs and drug are shown in suppl. Table I. In the FTIR spectra of drug-loaded β-CD NSPs, at 1740 cm-1 a new distinctive peak indicating the stretching vibration peak of carbonyl is observed. In β-CD NSPs loaded with drugs, the disappearance of the N-H stretching vibration peak at 3312 cm-1 and alterations in the -C=O peaks at 1719 cm-1, 1575 cm-1, and 1447 cm-1, as well as the benzene ring, indicate modifications or shifts. Moreover, the distinct displacement of the vibration absorption peak in β-CD signifies a strong interaction with drug-loaded β-CD NSPs.
Differential Scanning Calorimetry (DSC)
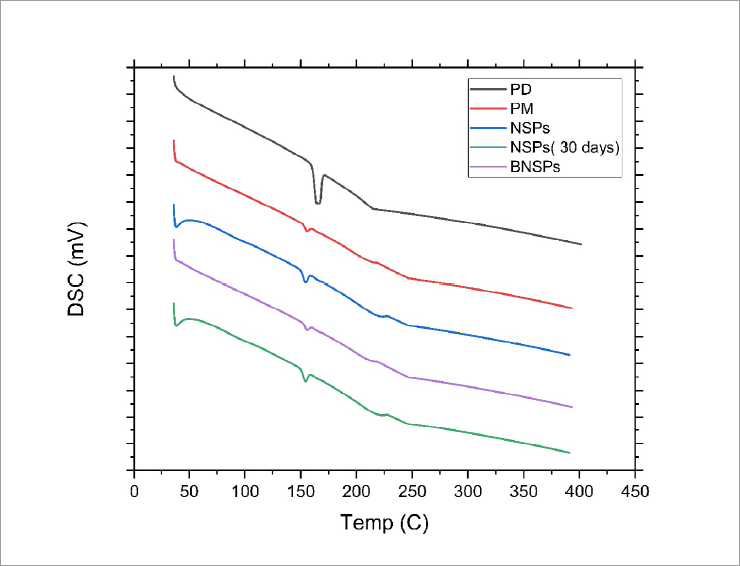
The melting point of the drug is indicated by an endothermic peak on the DSC curve (Suppl. Figure 2) at 166.88 °C. Endothermic peaks in the physical mixture’s thermogram are at 44.68 °C,163.53 °C, and 258.2 °C, indicating the melting temperatures of the drug and the β-CD. In the case of the optimized drug-loaded β-CD NSPs, the drug is entrapped in the cyclodextrins, indicating high thermal stability of the material(Liu, Li, Xuan, 2020).
Drug release (DR)
The DR study presents release data as cumulative drug release versus time in hours and measures dose forms’ possible in vivo accomplishment. The DR characteristics of DBF-loaded β-CD NSPs and pure DBF are depicted in Figure 9. When comparing the DBF release from the optimized β-CD NSPs to the pure medication, there is a notable (p < 0.05) improvement. Compared to the pure drug release (22.43 ± 65.5%), the optimized β-CD NSPs show a rapid drug release (62.94 ± 4.2%) after 8 hours. After 48 hours, the optimized β-CD NSPs and free drug release profiles are 88.48 ± 7.4 and 29.66 ± 5.66, respectively. NSPs’ cross-linked βCD creates a fluffy, porous structure that improves medication solubility and release. The structure of β-CD NSPs cross-linked with DPC improves the capacity of cyclodextrins to form multiplexes with guest molecules that can be tightly bound or help to release the drug under regulated conditions(Ansari et al., 2011; Trotta, et al., 2012).

The different DR kinetic models (Table IV) have the following regression coefficients: Korsmeyer Peppas model (0.9384), Higuchi model (0.8866), zero-order (0.6551), and first order (0.4402). With a (n) value of 0.597, the DR data matching the Korsmeyer Peppas kinetic model for the improved β-CD NSPs formulation indicated non-Fickian (anomalous transport) release. The most significant correlation coefficient (R2 = 0. 9384) supports the idea that diffusion and chain relaxation work together to control release (Kalam et al., 2022; Ritger, Peppas, 1987).
Stability studies
DBF β-CD NSPs stability studies were carried out at three distinct temperatures for three months (0, 0.5, 1, and 3). The data about the examination of the impact of stability conditions on P.S. (particle size), PdI, and E.E are presented in Table V. The particle size grew from 158.0 ± 7.2 on the first day to 172.14 ± 10.28 on the third month when stored at 5 ± 3 °C. From 0.5 to 3 months, there was a growth in size from 159.42 ± 6.24 nm to 186.38 ± 8.40 nm at a high temperature of 40 ± 2 °C. The formulation’s P.S rose marginally to 174.22 ± 6.63 nm (3rd month) from 162.98 ± 3.33 nm (0.5 months) while it was stored at 25 ± 2 °C(Sampathi, et al., 2022).
Short-term stability study of the NS formulation under different conditions with respect to particle size, PdI, and ZP
Ex vivo permeability studies
The mean apparent permeability (Papp) for PD and DBF β-CD NSPs is given in Table VI. The formulation proved better as compared to the PD with an apparent permeability enhanced by 2.11, 1.696, and 2.60-fold in different colonic segments (duodenum, jejunum, and ileum), respectively, signifying that drug absorption is more in the form of nanosponges due to improved mucosal permeability. DBF-loaded β-CD NSPs exhibited elevated permeability coefficient values in the duodenum and ileum. This disparity is likely attributed to variations in the expression of transporters along the intestinal tract. The drug loaded in NSPs may undergo distinct ionization compared to the pure drug. NSPs can potentially safeguard the loaded drug within βCD inclusion by preventing the depletion of uptake transporters. This protective effect may be linked to the influence of complexes on transporter capture, as reported previously (Mendes et al., 2015).
SPIP (In Situ Single-Pass Intestinal Perfusion Method)
Many drugs encounter challenges when given to animals or humans, including poor absorption, insolubility in water, and unstable physical properties, despite promising results in laboratory studies. The gut mucosa is an enormous obstacle and the primary cause of these problems. To evaluate formulation effectiveness in vivo, we used the perfusion methods for assessing the permeability of pure drug (PD) and DBF β-CD NSPs in the rat ileum.
The effective permeability (Peff), calculated based on steady-state (SS) drug concentrations in the perfusate, demonstrated a notable rise, increasing from 0.069 × 10⁻⁴ to 0.42 × 10⁻⁴ cm/s. The in situ SPIP approach helps predict intestine absorption in humans by simulating animal physiological parameters. Improvements in intestinal permeability were seen with NSP-based drug administration; these improvements were ascribed to compact particle size, surface area, improved dissolving, and higher solubility. This method holds promise for predicting human absorption, as reflected in increased intestinal permeability linked to NSP-based drug administration(Mendes et al., 2018).
Pharmacokinetic studies
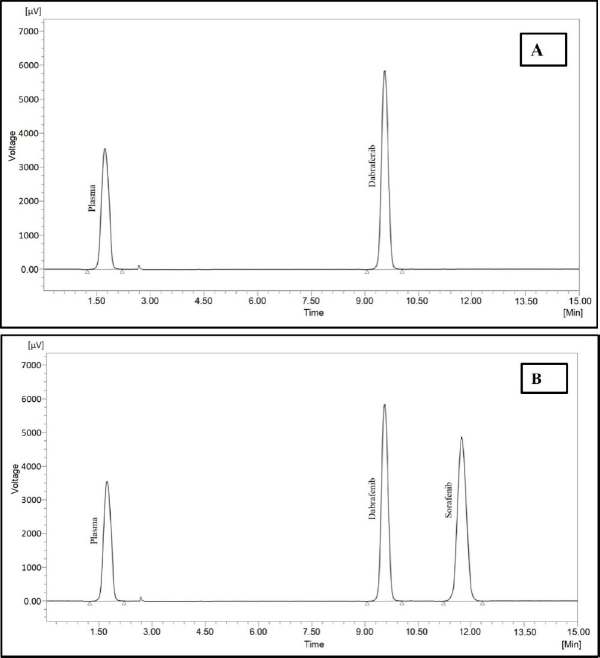
The plasma concentration of the drug against the time curve after oral administration of both the standard PD solution (0.25% w/v Sodium carboxymethylcellulose) and the optimized nanosponges is displayed in Figure 10. The related pharmacokinetic information is given in Table VII. The improved NSPs formulation exhibited significantly greater Tmax, Cmax (**p < 0.001), AUC0- 24 (**p < 0.001), and AUC0-∞ (**p < 0.001) values at the prescribed dose in contrast to the pure DBF suspension. Figure 10 shows that the DBF plasma nanosponges formulation showed a significantly higher area under the curve levels than those treated with pure drug. The bioanalytical chromatogram with a retention time of the drug and internal Standard (Sorafenib) was found to be 9.22 in and 11.41 min, respectively, as shown in Suppl. Figure 3.
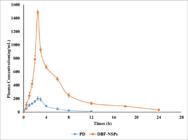
The maximum concentration (Cmax) (7.356-fold) and area under the curve (AUC0-t) (7.95-fold) of NSPs were significantly higher than those of the free drug. NSPs formulation exhibits sustained release performance by supporting extended retention and improving bioavailability. The formulation’s sustained release effect on DBF is confirmed by the longer half-life of the DBF-loaded NSPs compared to the DBF suspension (Omar, Ibrahim, Ismail, 2020; Zidan et al., 2018). Nonetheless, the pure drug suspension required less time to achieve the maximum plasma concentration (Cmax) than the optimized NSPs formulation. The NPS carriers help to increase Dabrafenib’s solubility and release, which results in notable improvements in pharmacokinetics (Lee et al., 2011).
CONCLUSION
This study aimed to develop DBF-loaded DPC-crosslinked β-CD NSPs for improved bioavailability and sustained release of DBF. The optimized β-CD NSPs demonstrated suitable size, PdI, Z.P, and E.E, facilitating sustained drug release, as validated by in vitro release, permeation studies, and in vivo pharmacokinetic evaluations. Pharmacokinetic investigations demonstrated that optimized β-CD NSPs exhibited higher bioavailability than pure form. The optimized β-CD NSPs exhibited superior therapeutic efficacy with their porous nanoscale structure. In conclusion, our findings suggest that optimized β-CD NSPs hold promise as an oral delivery system for cancer treatment.
ACKNOWLEDGEMENT
The authors express their gratitude to Teegala Ramreddy college of Pharmacy, Hyderabad, for providing the facilities.
REFERENCES
-
Ansari KA, Torne SJ, Vavia PR, Trotta F, Cavalli R. Paclitaxel loaded nanosponges: in-vitro characterization and cytotoxicity study on MCF-7 cell line culture. Curr Drug Deliv. 2011;8(2):194-202. doi:10.2174/156720111794479934.
» https://doi.org/10.2174/156720111794479934 - Aldawsari MF, Alhowail AH, Anwer MK, Ahmed MM. Development of diphenyl carbonate-crosslinked cyclodextrin based nanosponges for oral delivery of baricitinib: formulation, characterization and pharmacokinetic studies. Int J Nanomed. 2023 Apr 27;18:2239-51.
- Almutairy BK, Alshetaili A, Alali AS, Ahmed MM, Anwer MK, Aboudzadeh MA. Design of olmesartan medoxomil-loaded nanosponges for hypertension and lung cancer treatments. Polymers (Basel). 2021 Jul 2;13(14):2272.
- Ansari KA, Vavia PR, Trotta F, Cavalli R. Cyclodextrin-based nanosponges for delivery of resveratrol: In vitro characterisation, stability, cytotoxicity and permeation study. AAPS PharmSciTech. 2011 Mar;12(1):279-86.
- Anwer MK, Ahmed MM, Aldawsari MF, Iqbal M, Kumar V. Preparation and evaluation of diosmin-loaded diphenylcarbonate-cross-linked cyclodextrin nanosponges for breast cancer therapy. Pharmaceuticals. 2023 Jan; 16(1): 19.
- Bagul US, Nazirkar MV, Mane AK, Khot SV, Tagalpallewar AA, Kokare CR. Fabrication of architectonic nanosponges for intraocular delivery of Brinzolamide: An insight into QbD driven optimization, in vitro characterization, and pharmacodynamics. Int J Pharm. 2024 Jan;650:123746.
- Committee for Medicinal Products for Human Use (CHMP) Assessment report Neofordex. 2015.
- Danaei M, Dehghankhold M, Ataei S, Hasanzadeh Davarani F, Javanmard R, Dokhani A, et al. Impact of particle size and polydispersity index on the clinical applications of lipidic nanocarrier systems. Pharmaceutics. Multidisciplinary Digital Publishing Institute; 2018 10:57.
- Davies H, Bignell GR, Cox C, Stephens P, Edkins S, Clegg S, et al. Mutations of the BRAF gene in human cancer. Nature. 2002 Jun;417(6892):949-54.
- Dressman JB, Amidon GL, Reppas C, Shah VP. Dissolution testing as a prognostic tool for oral drug absorption: immediate release dosage forms. Pharm Res. 1998;15(1):11-22.
- Falchook GS, Long GV, Kurzrock R, Kim KB, Arkenau TH, Brown MP, et al. Dabrafenib in patients with melanoma, untreated brain metastases, and other solid tumours: A phase 1 dose-escalation trial. Lancet. 2012;379(9829):1893-901
- Flaherty KT, Puzanov I, Kim KB, Ribas A, McArthur GA, Sosman JA, et al. Inhibition of Mutated, Activated BRAF in Metastatic Melanoma. N Engl J Med. 2010 Aug;363(9):809-19.
- Kalam MA, Iqbal M, Alshememry A, Alkholief M, Alshamsan A. Development and Evaluation of Chitosan Nanoparticles for Ocular Delivery of Tedizolid Phosphate. Mol 2022 Apr;27(7):2326.
- Lee D, Lim LA, Jang SB, Lee YJ, Chung JY, Choi JR, et al. Pharmacokinetic comparison of sustained- and immediate-release oral formulations of cilostazol in healthy Korean subjects: a randomized, open-label, 3-part, sequential, 2-period, crossover, single-dose, food-effect, and multiple-dose study. Clin Ther. 2011 Dec;33(12):2038-53.
- Liu X, Li W, Xuan G. Preparation and characterization of β-cyclodextrin nanosponges and study on enhancing the solubility of insoluble nicosulfuron. In: IOP Conference Series: Materials Science and Engineering. IOP Publishing; 2020 Mar;774(1):012108.
- Löbenberg R, Amidon GL. Modern bioavailability, bioequivalence and biopharmaceutics classification system. New scientific approaches to international regulatory standards. European Journal of Pharmaceutics and Biopharmaceutics. 2000 Jul;50(1):3-12.
- Long GV, Flaherty KT, Stroyakovskiy D, Gogas H, Levchenko E, de Braud F, et al. Dabrafenib plus trametinib versus dabrafenib monotherapy in patients with metastatic BRAF V600E/ K-mutant melanoma: Long-term survival and safety analysis of a phase 3 study. Ann Oncol. 2017 Jul;28(7):1631-9.
- Mendes C, Wiemes BP, Buttchevitz A, Christ AP, Ribas KG, Adams AIH, et al. Investigation of β-cyclodextrin-norfloxacin inclusion complexes. Part 1. Preparation, physicochemical and microbiological characterization. Expert Rev Anti Infect Ther. 2015 Jan;13(1):119-29
- Mendes C, Meirelles GC, Barp CG, Assreuy J, Silva MAS, Ponchel G. Cyclodextrin based nanosponge of norfloxacin: Intestinal permeation enhancement and improved antibacterial activity. Carbohydr Polym. 2018 Sep;195:586-92.
- Moin A, Roohi NKF, Rizvi SMD, Ashraf SA, Siddiqui AJ, Patel M, et al. Design and formulation of polymeric nanosponge tablets with enhanced solubility for combination therapy. RSC Adv. 2020 Sep;10(57):34869-84.
- Neerati P, Kumar Bedada S. Effect of diosmin on the intestinal absorption and pharmacokinetics of fexofenadine in rats. Pharmacol Reports. 2015 Apr 1;67(2):339-44.
- Omar SM, Ibrahim F, Ismail A. Formulation and evaluation of cyclodextrin-based nanosponges of griseofulvin as pediatric oral liquid dosage form for enhancing bioavailability and masking bitter taste. Saudi Pharm J. 2020 Mar 1;28(3):349-61.
- Palanati M, Bhikshapathi DVRN. Development, characterization and evaluation of entrectinib nanosponges loaded tablets for oral delivery. Int J Appl Pharm. 2023 Nov;15(6):269-81.
- Pham LM, Poudel K, Phung CD, Nguyen TT, Pandit M, Nguyen HT, et al. Preparation and evaluation of dabrafenib-loaded, CD47-conjugated human serum albumin-based nanoconstructs for chemoimmunomodulation. Colloids Surfaces B Biointerfaces. 2021 Dec;208:112093.
- Radovic J, Maksimovic-Ivanic D, Timotijevic G, Popadic S, Ramic Z, Trajkovic V, et al. Cell-type dependent response of melanoma cells to aloe emodin. Food Chem Toxicol. 2012 Sep;50(9):3181-9.
- Rai SK, Gunnam A, Mannava MKC, Nangia AK. Improving the Dissolution Rate of the Anticancer Drug Dabrafenib. Cryst Growth Des. 2020 Mar;20(2):1035-46.
- Rangaraj N, Pailla SR, Chowta P, Sampathi S. Fabrication of Ibrutinib Nanosuspension by Quality by Design Approach: Intended for Enhanced Oral Bioavailability and Diminished Fast Fed Variability. AAPS PharmSciTech . 2019 Oct 28;20(8):326
- Real DA, Bolaños K, Priotti J, Yutronic N, Kogan MJ, Sierpe R, et al. Cyclodextrin-modified nanomaterials for drug delivery: Classification and advances in controlled release and bioavailability. Pharmaceutics. Multidisciplinary Digital Publishing Institute; 2021 Dec;13(12): 2131.
- Ritger PL, Peppas NA. A simple equation for description of solute release I. Fickian and non-fickian release from non-swellable devices in the form of slabs, spheres, cylinders or discs. J Control Release. 1987 Jun;5(1):37-42.
- Robert C, Karaszewska B, Schachter J, Rutkowski P, Mackiewicz A, Stroiakovski D, et al. Improved Overall Survival in Melanoma with Combined Dabrafenib and Trametinib. N Engl J Med . 2015 Jan;372(1):30-9.
- Running L, Espinal R, Hepel M. Controlled release of targeted chemotherapeutic drug dabrafenib for melanoma cancers monitored using surface-enhanced Raman scattering (SERS) spectroscopy. Mediterr J Chem. 2018;7(1):18-27.
- Russi M, Valeri R, Marson D, Danielli C, Felluga F, Tintaru A, et al. Some things old, new and borrowed: Delivery of dabrafenib and vemurafenib to melanoma cells via self-assembled nanomicelles based on an amphiphilic dendrimer. Eur J Pharm Sci. 2023 Jan;180:106311.
- Sampathi S, Prajapati S, Junnuthula V, Dyawanapelly S. Pharmacokinetics and Anti-Diabetic Studies of Gliclazide Nanosuspension. Pharmaceutics. 2022 Sep;14(9):1947.
- Schwarz C, Mehnert W. Freeze-drying of drug-free and drug-loaded solid lipid nanoparticles (SLN). Int J Pharm . 1997 Nov;157(2):171-9.
-
Shah PP, Mashru RC, Thakkar AR, Badhan AC. Effect of chitosan crosslinking on bitterness of artemether using response surface methodology. J Pharm Pharmacol. 2008;60(4):421-427. doi:10.1211/jpp.60.4.0003.
» https://doi.org/10.1211/jpp.60.4.0003 - Shah PP, Mashru RC, Thakkar AR, Badhan AC. Effect of chitosan crosslinking on bitterness of artemether using response surface methodology. J Pharm Pharmacol . 2010 Feb;60(4):421-7.
- Sherje AP, Dravyakar BR, Kadam D, Jadhav M. Cyclodextrin-based nanosponges: A critical review. Carbohydrate Polymers. 2017 Oct;173:37-49.
- Swaminathan S, Vavia PR, Trotta F, Cavalli R. Nanosponges encapsulating dexamethasone for ocular delivery: Formulation design, physicochemical characterization, safety and corneal permeability assessment. J Biomed Nanotechnol. 2013 Jun;9(6):998-1007.
- Tejashri G, Amrita B, Darshana J. Cyclodextrin based nanosponges for pharmaceutical use: A review. Acta Pharmaceutica. Hrvatsko Farmaceutsko Drustvo; 2013; 63: 335-58.
- Tiwari K, Bhattacharya S. The ascension of nanosponges as a drug delivery carrier: preparation, characterization, and applications. J Mater Sci Mater Med. 2022 Mar 4;33(3):28.
- Torne SJ, Ansari KA, Vavia PR, Trotta F, Cavalli R. Enhanced oral paclitaxel bioavailability after administration of paclitaxel-loaded nanosponges. Drug Deliv [Internet]. 2010;17(6):419-25.
- Trotta F, Zanetti M, Cavalli R. Cyclodextrin-based nanosponges as drug carriers. Beilstein Journal of Organic Chemistry. Beilstein-Institut; 2012;8:2091-9.
- Utzeri G, Matias PMC, Murtinho D, Valente AJM. Cyclodextrin-Based Nanosponges: Overview and Opportunities. Vol. 10, Frontiers in Chemistry. Frontiers Media S.A.; 2022 Jan; 10:859406.
- Yu LX, Amidon G, Khan MA, Hoag SW, Polli J, Raju GK, et al. Understanding pharmaceutical quality by design., AAPS Journal. 2014 Jul; 16(4): 771-783.
- Zidan MF, Ibrahim HM, Afouna MI, Ibrahim EA. In vitro and in vivo evaluation of cyclodextrin-based nanosponges for enhancing oral bioavailability of atorvastatin calcium. Drug Dev Ind Pharm. 2018 Aug;44(8):1243-53.
Suppl.

FTIR overlay of: A) Drug -PD (black line); B) Physical mixture-PM (Purple line); C) Nano Sponges-NSPs (Red line) ; D) Blank Nanosponges-BNSPs( Green line); E) Nanosponges -NSPs 3 months (Blue line).

Overlay of DSC thermograms of A) Drug -PD (black line); B) Physical mixture-PM (Red line) ; C) Nano Sponges-NSPs (Blue line) ; D) Nanosponges -NSPs 3 months (Green line ; E) Blank Nanosponges-BNSPs( Purple line).