 Fully independent validation of the Matrix-INI, IMEPAG-group, MERIS instruments for predicting preventable drug-related incidents of hospitalized patients with infectious diseases
Validate and compare three prescription-related incident prediction instruments (Matrix-INI, IMEPAG-group, MERIS) in hospitalized patients with infectious disease. Observational follow-up (cohort) study enrolling adults from June 2019 to March 2020, with no prior care from the clinical pharmacist. Matrix-INI, MERIS, and IMEPAG-group instruments assessing preventable drug-related incidents (PDRI) were applied at ward admission and once a week. The outcome of interest was clinically relevant PDRI. For every participant at every time of analysis, the instruments scores were retrieved, and validation was estimated through calibration (slope, intercept), discrimination indexes, and reclassification indexes. 219 patients were screened, and 212 were included. PDRI affected 78.77% of participants. “Anticoagulants” was the strongest predictor. Discrimination of all instruments was always low. (area under ROC curve < 0.70); and weekly performance was insufficient. No reclassification improvement was observed. Matrix-INI, IMEPAG-group assigned lower risks despite PDRI. Discrimination increases slightly every week, with a corresponding calibration loss. Models lacked sufficient predictive performance, pointing to a need for a specific PDRI prediction tool for this population. Empirically developed instruments, such as Matrix-INI, often exhibit poor performance. Regular risk assessments during hospitalization are crucial for dynamic prioritization in clinical pharmacy, as PDRI risk may change over time.
Keywords:
Clinical pharmacy service; Clinical decision rules; Prognosis; Patient safety; Medication errors; Infectious disease medicine
KEY POINTS
Clinical pharmacists are key professionals in preventing medication-related problems in hospitalized patients, reducing length of stay, mortality, and decreasing healthcare expenditures. There is a shortage of clinical pharmacists to meet demands, and rationalizing their tasks is not trivial.
For a long time, researchers have been trying to develop and validate prediction instruments in different populations to help clinical pharmacists pick hospitalized patients at higher risks of prescription errors.
Three predictive instruments developed in different populations to predict adverse drug reactions were tested in an independent population with infectious diseases. All instruments performed below desired.
Matrix-INI tool, empirically developed at our institution, also showed low performance, without a clear advantage over the others.
As the instruments were validated with a follow-up study, it was very clear that many patients’ risks change over time despite the instrument used. Therefore, making predictions on admission only is not good practice.
There is a clear need to develop a specific prediction model for the population of patients hospitalized with infectious diseases.
INTRODUCTION
In 2004, the World Health Organization (WHO), established the Global Alliance for Patient Safety. This initiative led to the creation of the Global Patient Safety Challenge aimed at harm prevention (World Health Organization 2021). In 2017, WHO launched the “Third Global Patient Safety Challenge: tackling medication-related harm”, aiming for a 50% reduction of preventable serious harm linked to medication use in the following five years (ISPM Brasil, 2018). Nevertheless, patient safety during healthcare remains a global issue (Lark et al., 2018).
Since the 1980s, Brazil has witnessed clinical pharmacists progressively integrated into various multidisciplinary teams and training processes, playing a crucial role in preventing drug-related incidents (Müller, 2018). The involvement of clinical pharmacists in patient care yields a range of benefits, including a reduction in the risk of adverse drug events (ADEs), shorter hospital stays, decreased readmission rates, and positive pharmacoeconomic outcomes (Chen et al., 2017; Jourdan et al., 2018; Ravn-Nielsen et al., 2018; Skjot-Arkil et al., 2018; Lázaro Cebas et al., 2022; Canning et al., 2024). The cost-benefit of implementing a well-structured clinical pharmacy service was estimated as an annual saving of approximately $210 million in a hospital setting (Alomi, Al-Jarallah, Bahadig, 2019).
The clinical pharmacist’s role is a set of services and activities that involve (not limited to) prescription analysis, patient interviews, medication reconciliation, and pharmaceutical interventions (PI). In the end, this role aims to bring benefits by optimizing treatment and reducing preventable drug-related incidents (PDRI). There is an intersection of hospital epidemiology and clinical pharmacy, mainly regarding the surveillance effort. Numerous valuable strategies are possible to enhance clinical pharmacy services, including risk assessment and improvements in patient safety (Billstein-Leber et al., 2018) and prioritization tools and event risk classification (Falconer et al., 2014).
Clinical pharmacy activities in low and medium-complexity inpatient units should have at least 1 pharmacist for each clinical unit with up to 40 beds. For clinical activities in high-complexity inpatient units, the recommendation is 1 clinical pharmacist for a clinical unit of up to 30 beds (Sociedade Brasileira de Farmacia Hospitalar, 2017). However, there is a challenge when comparing the higher number of hospitalizations and preventable events and the number of clinical pharmacists up to this task (Rodrigues, 2017). Consequently, there is a need to optimize clinical pharmacy services by selecting patients who require this intervention the most. Prediction instruments to prioritize clinical pharmacist interventions are potentially valuable (Martinbiancho et al., 2011).
When assessing the performance ofclinical pharmacy instruments, it’s important to recognize the heterogeneity of populations in which these tools are developed and validated, as different prediction performances may arise in different settings. Therefore, it is recommended to validate these instruments where they will be applied to increase the certainty regarding their performance and applicability (Alshakrah et al., 2019).
Medicine Risk Score (MERIS) instrument (Saedder et al., 2016) and the IMEPAG-group (Iatrogénie Médicamenteuse Évitable chez les Personnes Agées en soins de suite et réadaptation Gériatriques) (Trivalle, Burlaud, Ducimetière, 2011) were developed in populations with distinct characteristics. MERIS was originally developed in Denmark, intended to be used with orthopedic and internal medicine patients, and later validated at a polyclinic ward. IMEPAG-group was developed and validated in Paris, France, with the collaboration of 16 geriatric centers. The Evandro Chagas National Institute of Infectious Diseases (INI) empirically developed a risk matrix for selecting patients at a higher risk of ADEs in the unit’s ward (Matrix-INI).
There is no evidence so far of the performance and applicability of any of these instruments in wards with infectious disease patients. This research aimed to externally validate three instruments for predicting medication-related incidents in hospitalized patients with infectious diseases, including two developed in different populations (MERIS, and IMEPAG-group) and one created at INI (Matrix-INI).
METHODS
The project was approved on May 16th, 2019, by Evandro Chagas Infectious Diseases National Institute Ethics Committee. One may find ethical files at the National System of Ethics in Research with Human Beings (https://plataformabrasil.saude.gov.br/login.jsf) with the number CAEE: 04870918.8.0000.5262.
Study design and setting
This is an observational follow-up study conducted at the Evandro Chagas National Institute of Infectious Diseases (INI - FIOCRUZ), a specialized tertiary federal public hospital in Rio de Janeiro, Brazil, dedicated to the treatment of infectious diseases. During the study period, the INI ward featured 22 ward beds and 4 intensive care unit (ICU) beds, with an annual average of around 575 patient hospitalizations. It received patients from the entire Rio de Janeiro metropolitan area, including many neighboring cities.
Participants
Participant selection was sequential, from June 2019 to March 2020. The inclusion criteria were admission during the inclusion period, age 18 or older, no prior care from the clinical pharmacist, and willingness to participate as demonstrated by signing the Informed Consent Form. The exclusion criteria were hospital stays of less than 24 hours, no medication use during the first 48 hours of admission, direct admission to the ICU, and transfer from the ICU to the ward. If a patient had more than one hospitalization in the study period, only the first one was counted. Patients transferred to other health units, with prolonged license 24h) or discharged from the hospital were discontinued.
Procedures and techniques
Junior pharmacists (RBR, PGS, ALS, FOS, and VRB), supervised by a senior pharmacist (ECF) collected patient data from prescriptions and electronic medical records. In case of incomplete data, the authors collected information by consulting either the multidisciplinary team or the patients.
The data regarding potential predictors was collected on the first day of hospitalization (D1), the seventh day of hospitalization (D7), and every subsequent seventh day during the hospital stay and at discharge. If data was missing for a particular day, the nearest value within 72 hours before or after the evaluation was used.
The data related to the outcome of interest were determined simultaneously with the predictor data but always concerning the respective follow-up week, meaning that the research team assessed whether the outcome occurred during the seven days preceding the evaluation. The outcome assessment started on D7 and was repeated every seven days and at the time of discharge. In the prescription, the drug was considered as administered whenever there were marks by the nurse indicating so.
Both the predictors and outcomes identified by team members underwent regular review by experienced research team members and the responsible researcher. This process allowed for feedback, and adjustments, and addressed various demands through regular meetings.
Outcome
Outcome was defined as clinically relevant preventable drug-related incidents (PDRI), that could be avoided by clinical pharmacists as per Michel’s definition of preventability (Michel, 2004). PDRI is here considered as a combination of events: ADRs, drug interactions, and administration of drugs that led to real damage or with a potential severity of medium to very high damage, if they are preventable by the clinical pharmacist and prescription errors. ADEs of medium to very high severity harm (Agência Nacional de Vigilância Sanitária, 2020) and incidents that affect the patient with the potential of medium to very high severity harm related to prescription were considered outcomes.
Prescription errors are unintentional decision or language errors that can reduce the probability that treatment is effective or increase the risk of patient injury compared to established and accepted clinical practices (Dean, 2000). The following were included as prescription errors: prescription of drugs with interactions, dose error, dosage error, dilution error, administration route error, concentration error, infusion error, treatment time error, scheduling error, indication error, lack of medication prescription, infusion time error, vehicle error, in addition to prescription duplication, including those identified (corrected or not) by the hospital pharmacist. Infusion error refers to the error in the venous infusion rate of a medication (mg/kg/h). Dose error refers to the error in the prescribed dose (mg/kg). Scheduling error is the error in the intervals between medication administrations. Infusing time error is an error resulting from an infusion time that is longer than the stability of the solution. Treatment time error refers to the error in the length of time in which the patient should use the medication. Posology error refers to the error of the total daily dose despite the correct single dose (e.g. taking 2g of a drug every 6h when it should be administered every 12h)
ADE is any undesirable clinical occurrence that occurs during drug treatment, but which may not have a causal relationship with the treatment, while ADR is a “drug response that is undesirable and unintended, that occurs in treatment at commonly used doses” (Weltgesundheitsorganisation and Collaborating Centre for International Drug Monitoring, 2002). Specifically for adverse drug reactions (ADR), we used the avoidable definition adapted from Schumock and Thornton (Pearson et al., 1994). ADEs were categorized based on their intensity following the WHO recommendations (supplementary material - Table SI I).
To identify drug interactions, we used the Micromedex and “Drugs.com” databases. We only consider clinically relevant moderate and severe ones for the outcome purpose.
The severity of PDRI was classified according to the criteria of the Severity Assessment Code (SAC) (supplementary material - Table SI II) and the triage tool for reporting adverse events (New Zealand, 2017). Regarding intensity, they were classified according to ANVISA’s recommendations, as described in the Grading of Qualifying Intensity for Health Conditions (Agência Nacional de Vigilância Sanitária, 2020).
Prediction instruments
MERIS
The MERIS tool (Saedder et al., 2016), originally developed and internally validated at Aarhus University Hospital in Denmark, is intended to be used with orthopedic and internal medicine populations. Later, it was temporally validated in a prospective study within a polyclinic ward. Medication safety (medication error outcomes) during hospitalization, including errors in dispensing and medication administration were the outcomes (supplementary material - Table SI III). The predictors were “reduced kidney function”, “number of medications”, and “medications with the risk of harm and interactions” (supplementary material - Table SI IV). MERIS’ score ranges from 0 to 56.95. The model classifies patients at low or high risk of medication error (ME) (supplementary material - Table SI IV).
IMEPAG
The IMEPAG-group is a risk score (Trivalle, Burlaud, Ducimetière, 2011) to evaluate adverse drug events (ADE) associated with medication prescriptions in hospitalized elderly patients. The model was developed and validated in Paris, France, with the collaboration of 16 geriatric centers (Trivalle, Burlaud, Ducimetière, 2011). The IMEPAG’s score range is 0 to 34. The instrument classifies patients into five risk levels, and the model’s predictors are: ‘number of medications prescribed’, ‘presence of antipsychotics in the prescription’, and ‘recent anticoagulation’ (supplementary material - Table SI V).
Matrix-INI
The Matrix-INI instrument (supplementary material - Table SI VI) was first employed in a project aimed at organizing the clinical pharmacy service within INI hospital. Its development was based on the ISO 31000 risk matrix, which uses probability vs severity. However, to identify the patients most vulnerable to PDRI, the probability was replaced by vulnerability, assessed by organ dysfunction, using the adapted Sequential Organ Failure Assessment (SOFA) score (supplementary material - Table SI VII). The original SOFA score (supplementary material - Table SI VIII) was also adapted condensing the scores from 1 to 5 to represent vulnerability as follows; vulnerability = 1 (SOFA = 0 to 5), vulnerability = 2 (SOFA = 6 to 11), vulnerability = 3 (SOFA = 12 to 17), vulnerability = 4 (Sofa 17 a 22); vulnerability = 5 (SOFA >23). To assess the potential harm, the medications associated with harm in the notification to INI’s Patient Safety Center (PSC) were grouped and stratified into subgroups, according to the severity degree (1 to 5). (supplementary material - Table SI IX) In this way, the potential harm associated with pharmacotherapy was obtained as a matrix of potential harm (horizontal axis) versus vulnerability (vertical axis). Matrix-INI score ranges from 1 to 25. To reach the final score one may either multiply the vulnerability and severity or cross their values in the matrix. The outcome was PDRIs with a potential severity level ranging from medium to very high. It’s worth noting that the tool was developed empirically and had a conceptual and construct validation (not published). It has not undergone quantitative internal development and validation.
Analysis plan
The analysis plan consisted of five main steps: 1) data inspection, 2) coding of predictors, 3) data description and follow-up trajectories, 4) multiple imputation of missing data for modeling purposes, and 5) evaluating models’ performance (Steyerberg, 2019). Since the original instruments were designed to be used only at the hospitalization admission, our analytical approach was adapted to account for potential changes in the outcome risk during the hospitalization weeks. We compared mean score trajectories using their 95% confidence intervals in each measurement time and assessed the models’ performance through calibration measures (slope and intercept, observed vs. predicted outcomes), and discrimination (area under the ROC curve). To estimate prediction performances, we estimated the positive predictive value (predicted probability) for each score value of each instrument. We also calculated the reclassification of outcome probabilities using the indexes “Integrated Discrimination Improvement” (IDI) and the “Net Reclassification Index” (NRI) (Pencina, D’Agostino, Steyerberg, 2011). Additional comments regarding performance measures and the calibration plots are in the supplementary information.
RESULTS
Descriptive results
A total of 212 individuals were analyzed in the study (Figure 1). The proportion of individuals with PDRI was 78.77%. The average age of participants was 46.4 years. The sample predominantly consisted of male and black/brown individuals, with an education level ranging from 9 to 11 years of study, and most of them were not hospitalized in the previous 30 days. Most participants denied using illicit drugs, tobacco, or alcohol. Most had comorbidities, and HIV/AIDS was the most common, followed by tuberculosis and Chagas disease. (Table I).

Baseline clinical and demographic characteristics by presence or absence of PDRI during hospital stay
A total of 446 PDRI were identified. Most occurred in the first and second weeks. Drug interactions, scheduling errors, ADRs, and dose errors were the most common PDRIs. There were no errors related to infusion time or vehicle. (Table II) The frequency of individuals with PDRI decreased over the course of hospitalization for all these outcomes.
Score instruments
No individual predictor in the Matrix-INI instrument (supplementary material -Table SI X) or the MERIS instrument (supplementary material -Table SI XI) was deemed likely relevant for the studied population. Among the IMEPAG instrument predictors, only recent anticoagulation showed good potential to be clinically relevant individually, given its proportions between the PDRI groups throughout hospitalization (supplementary material -Table SI XII).
Trends in the trajectories of scores and risk classification were observed in the three tools. One may see that all three instruments’ scores increased over time in both groups with and without PDRI in a very similar way. This trend is less evident in the Matrix-INI instrument. Additionally, this visual increasing trend is accompanied by an increasing confidence interval of the means. Later in time, there are fewer participants as they either die or have medical discharge, therefore, the precision decreases over time. It was also noteworthy that all instruments return scores within a very narrow range of scores, thus not all risk classes are represented. The Matrix-INI and IMEPAG instruments consistently classified participants in the lowest risk groups throughout hospitalization (Figures 2A, 2B).

Means and its 95% confidence intervals of the Matrix-INI (a), IMEPAG-group (b) and MERIS (c) scores throughout hospitalization by presence or absence of preventable drug-related incidents (PDRI).
Instruments’ performance
For all instruments, the amplitude of predicted values is narrow, which is consistent with the low range of assigned scores within the possible range. For all instruments, the performance assessment over the whole hospitalization period is poor, as indicated by low values of the area under the ROC (below 0.66) curve and R2 (below 0.12) (Figure 3A, 3B, 3C). Calibration is also moderate to poor for all instruments, particularly the IMEPAG-group instrument as its slope and intercept are more away from desired values (1 and 0 respectively) (Figure 3B). For MERIS in particular, external validation performance here estimated in patients with infectious diseases (Figure 3C) is lower than the estimated during the original development and internal validation, when the area under the ROC curve was 0.66 in orthopedic patients (Saedder et al., 2016).

Predictive performance of the Matrix-INI (a), IMEPAG-group (b) and MERIS (c) instruments for the whole hospitalization period.
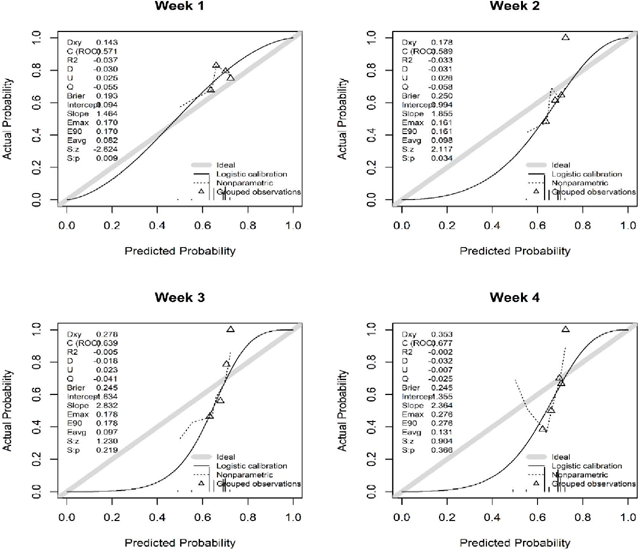
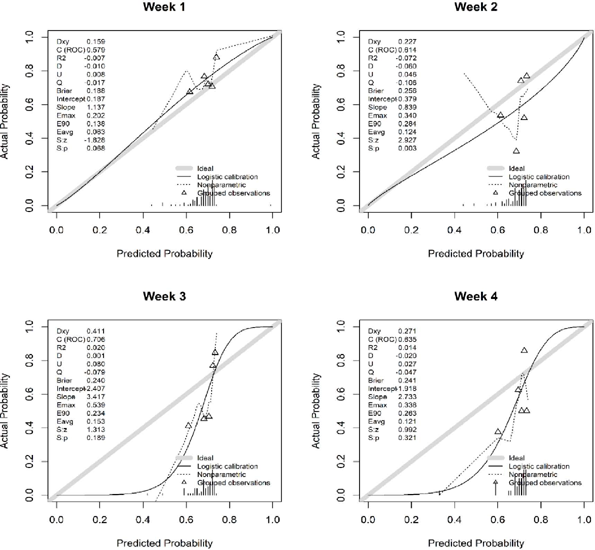
When examining the predictive discrimination performance of the Matrix-INI, IMEPAG, and MERIS models for each week of hospitalization, it becomes evident that although the area under the ROC curve values is modest, they show an upward trend throughout the hospitalization. However, in general, as discrimination increases, calibration indices and visual calibration decrease. (supplementary material - Figure SI 1, Figure SI 2, Figure SI 3).
Comparison between instrument performances
When comparing the prediction reclassifications, it is evident that the INI-Matrix reclassifies individuals who experienced PDRI less effectively than the other two instruments. However, it performs better in reclassifying individuals who did not have PDRI, effectively canceling out these reclassifications (Table III). The noticeable increase in reclassification occurs in favor of IMEPAG compared to the MERIS instrument. There is an improvement in the IDI, with a 6.3% increase in sensitivity for IMEPAG compared to the Matrix-INI instrument (Table III). Differences in reclassification and discrimination were minimal if relevant at all, but when differences were evident, IMEPAG outperformed the other instruments (Table III).
DISCUSSION
The main findings are: (a) Matrix-INI instrument was empirically developed, but now there is evidence regarding its performance; (b) all instruments had below-desired performances in this setting and there is no evidence of the superiority of one instrument over another; and (c) the risk of PDRI may change over time, and periodic assessments are required to capture this information.
Prediction models are highly valuable in enhancing clinical pharmacy services by aiding in the prioritization of intervention and monitoring by clinical pharmacists. This, in turn, optimizes resource allocation, time management, and overall drug therapy quality (Abuzour et al., 2021). Unfortunately, external validation studies indicating that performance travels are scarce (Deawjaroen et al., 2022).
Considerable challenges arise when seeking suitable tools for patient selection in various healthcare settings. These challenges are exemplified by the suboptimal performance of the three tools here studied, and the discrepancies between outcomes definitions and methodologies in the original studies versus the present study. Efforts for model adjustments and updating for performance improvement in diverse populations are also challenging. Given the wide variation in intended population characteristics, predictors, and overall model applicability, it’s unsurprising the disparities in the performances and utility of the same model in different settings (Deawjaroen et al., 2022). In such heterogeneity of elements, the setting where prediction instruments are intended to be used is unlikely to be the major source of interpretation difficulties and poor performance.
Despite the availability of well-established methods for developing and validating quantitative prediction models regarding medication-related harm (Collins et al. , 2021), many models are constructed, either partially or entirely, based solely on expert consensus (Abuzour et al., 2021) and often on Delphi methods (Falconer, Barras, Cottrell, 2019). Such practice makes up instruments with unknown or poor performance, which is the case of the Matrix-INI instrument. It seems that many authors in the clinical pharmacy field struggle to distinguish or effectively employ the recommended stages of instrument development and validation, along with the methodologies and concepts required for model construction (Abuzour et al., 2021).
Low vulnerability values and narrow and high values of potential harm over the weeks suggest that, although they are biologically plausible and reasonable, an instrument of vulnerability versus severity like Matrix-INI might not be suitable for PDRI prediction. The SOFA score was originally developed in the 1990s to weigh organ failures in ICU patients with sepsis. Its applications expanded over the years, currently used and validated for various purposes related to severity (Lambden et al., 2019). At the time Matrix-INI was developed, modified SOFA was already implemented as routine in ward admission, however in places where SOFA score is not implemented it may be more time-consuming, compromising the instrument’s applicability.
As the studied population differs from ICU patients, questions about the SOFA score’s applicability for assessing vulnerability in ward patients remain. Additionally, there is an issue related to the absence of data for patients with assisted ventilation (replaced with spontaneous respiratory rate patterns) and vasoactive medications during the study, as ward patients usually do not use these resources. Therefore, SOFA could be replaced by characteristics that more accurately reflect patients’ exposure to harm in the ward setting, such as comorbidities. Alternatively, it’s reasonable to consider maintaining vulnerability prediction or shifting the focus to predicting severity within the study population.
Patients with renal dysfunction may have their clinical condition worsened with the use of some nephrotoxic medication and therefore would be more vulnerable to an ADR. This reasoning gave rise to the Matrix-INI design, and the effort to replace severity by vulnerability in the assessment. Additionally, the original purpose was to predict ADR instead of PDRI.
IMEPAG instrument consistently classifies patients as low risk of PDRI throughout the entire hospitalization. As the unsatisfactory performance was observed, along with the high incidence of events in the sample, in clinical practice, patients more vulnerable to experiencing PDRI would be overlooked by the clinical pharmacist with this instrument.
No external validation publications for the IMEPAG instrument were found. When comparing its performances in its original population (AUC ROC 0.70), the lower predictive performance of the instrument was observed upon admission and overall (Trivalle et al., 2010). Therefore, the current evidence shows that this instrument may not be recommended for infectious disease populations for PDRI prediction.
MERIS instrument was the only one to allocate participants in this study with a high risk of PDRI throughout the entire hospitalization. Low calibration and discrimination lead to mistaken prioritization of patients for clinical pharmacist follow-up. Conversely, a recent multicenter study regarding MERIS external validation in a population of patients at the primary healthcare level, taking the outcome as potentially serious medication-related problems (MRP), observed reasonable performance (AUC ROC 0.70), without the need for adaptations of the original tool (Hoj et al., 2021). Efforts on external validation may show that performance travels, and check if its characteristics are improved or an update is required. This effort yields a tool for predicting patients’ needs for clinical pharmacist intervention in another population with a known performance (Timóteo et al., 2016).
Studies validating and comparing multiple models in a specific population to establish a more suitable instrument were not found in the literature. Comparisons between the external validation of a model in its original and updated formats highlight the possibility of improvement, making it reasonably applicable to a population of hospitalized patients (Dos Santos Barreto et al., 2022).
The main weakness of this research is the below-desired sample size. Originally a sample size of approximately 500 participants was planned, but enrollment had an early stop due to the COVID-19 pandemic. The main strength of this research was the ability to validate the instruments at admission and every week during admission, showing evidence of risk change and performance variations over time.
Patient prioritization tools in clinical pharmacy are generally applied only as initial classification (Falconer et al., 2014). However, variations in participants’ risk scores, as well as changes in the trajectories of risk groups over weeks of hospitalization, suggest that classifying patients solely at admission is insufficient. Therefore, future instrument developments and updates should be from follow-up studies to allow periodic risk updates. The exact period of repetition and updating risk estimates within a hospitalization may change according to several issues: the use of electronic systems during admission with the ability to collect data and make predictions, the frequency of new admissions, the ability of the clinical pharmacy team to share the job and update their course of actions, among others.
The best predictors to be explored or included may also vary according to the settings. The number of prescribed drugs and drug interactions are frequently explored as predictors. (Falconer et al., 2014) In general, good predictors usually are clinically relevant, reliable or reproducible, easily available, independent (not correlated with other predictors), biologically plausible, and timely meaningful. If a predictor was tested and included in previous versions, they should be considered in new versions of the instrument.
Regarding the heterogeneity of the outcomes, one may consider the purpose of the instrument which in our view is closely related to the idea of what clinical pharmacy intervention prevents or treats. For example, if a single clinical pharmacy intervention may prevent simultaneously ME, and dangerous drug interaction, then one may use a composite outcome and a single instrument which in turn is related to the single intervention, but if there is a need for different interventions for different outcome events, then one must consider as two different outcomes to be predicted and different instruments in decision aid.
CONCLUSION
Most of the predictors were found to be suboptimal and the instruments’ predictor combinations didn’t improve performance. This prompts further exploration of which predictors or combinations might enhance PDRI prediction in this population. These instruments underperformed at admission and in all the subsequent weeks of follow-up. There was a slight increase in discrimination corresponding to a decline in calibration as the weeks of hospitalization progressed. There is no clear evidence that one tool is significantly superior to the others. The IMEPAG instrument displayed slight advantages in reclassifying predicted probabilities, but this advantage wasn’t consistent.
Given the high incidence of PDRI, it’s crucial to optimize clinical pharmacy services for this population, including predictive instruments (Martinbiancho et al., 2011). There is huge potential for clinical pharmacists’ intervention to benefit this population and relying on risk classification solely at admission isn’t enough. However, none of the tools, in their current formats, can be recommended for assisting clinical pharmacists in patient prioritization.
SUPPLEMENTAL MATERIAL
Since this study was primarily observational and did not involve systematic intervention in patient care, it did not aim to replace standard care activities. Standard procedures for addressing medication-related errors that jeopardized patient safety involved reporting the incident to the Patient Safety Service. Immediate action was taken if the error was ongoing or posed an immediate threat to the patient. Otherwise, the event was included in the PSC notification process to support corrective measures at an appropriate time. If the research team identified errors meeting core safety criteria, these incidents were also reported.
Classification of Assistance AEs according to severity (adapted from the Severity Assessment Code (SAC) rating and triage tool for adverse event reporting)
For every 5 points on the adapted SOFA, one point is added to the organic dysfunction score in the Matrix (Table SI VI), maintaining the vulnerability range from 1 to 5 and the total score range from 1 to 25. To achieve this, the SOFA score was adjusted so that each item, rather than having a range from 0 to 4, now spans from 1 to 5. For instance, if a patient has a SOFA score (Table SI VII) of 15 (3 points for vulnerability) and high potential harm from pharmacotherapy (4 points), the INI-Matrix score would be 12, indicating a high risk of PDRI. (Table SI VI),
To assess the potential for harm from pharmacotherapy, the clinical pharmacy service within the ICU collaborated with the INI’s patient safety risk management. Together, they identified the medications associated with degrees of potential harm in reports or RAM notifications (Risk Assessment and Mitigation) (Table SI IX).
Data from the Matrix-INI instrument, risk classification, and score by week of hospitalization and by presence and absence of PDRI.
We observed in the Matrix-INI instrument that the prescribed medications with the highest potential for harm (1st and 2nd line of potential harm from pharmacotherapy) increase during the weeks of hospitalization, while those with prescriptions involving medications with lower potential for harm decrease over time (Table SI X). However, the distribution of proportions of individuals with PDRI lacks sufficient amplitude to establish this as a strong trend, as it does not account for reasonable differences between the group of individuals who experienced PDRI and those who did not (Table SI X).
The means and medians of the adapted SOFA scores, as well as the proportions of scores across weeks, are low and stable over time. This helps us comprehend the low average total Matrix-INI scores and the higher concentration of individuals in the lower risk categories (Table SI X).
Data from the MERIS instrument, risk classification and score per week of hospitalization and presence or absence of PDRI
It is clear that the proportions of individuals with renal dysfunction were low, regardless of PDRI presence. It is also noted that the averages and medians of prescribed medications are low, as well as medications with risks of harm and interactions. Furthermore, it is observed that both the proportion of individuals at high risk of PDRI and the mean and median risk scores increase over time. In this context, the mean and median scores are higher than the model’s detection limit in the last week, just as the proportion of individuals classified as high risk is higher in the same period (Table SI XI).
Data from the IMEPAG instrument, risk classification and score per week of hospitalization and presence or absence of PDRI
It’s evident that the mean and median scores for the number of medications are low, although they increase during the hospitalization. These values, while subtle, are consistently higher in the group with PDRI compared to the group without PDRI. The proportion of individuals prescribed antipsychotic medications is also low, regardless of whether they experienced PDRI or not. Additionally, a significantly higher proportion of PDRI cases is observed among participants with recent anticoagulation, even though there was a limited number of participants using anticoagulants throughout the weeks (Table SI XII).
Despite increasing over the course ofhospitalization, the overall MEPAG-group average scores are low. This score consistently places individuals in the two lowest-risk categories. The average total score is consistently slightly higher among those who experienced PDRI in all weeks. However, the high standard deviations consistently indicate a significant overlap between the scores in the groups with and without PDRI. Moreover, the proportion of individuals classified as low risk rises over the weeks, surpassing those classified as very low risk in the final week (Table SI XII).
Performance (discrimination and calibration)
This graph (calibration plot) simultaneously shows discrimination and calibration of the model’s performance. Calibration in clinical prediction models refers to the agreement between the probability predicted by the model and the actual frequency of the event (observed probability) that one wishes to predict. In other words, a well-calibrated model is one that, when predicting that an event has an 80% probability of occurring, in fact, in 80% of the cases where the model assigns this probability, the event occurs. Therefore, the perfect diagonal represents perfect correspondence between the predicted and the observed. Discrimination is the model ability to separate those who have the events from those who do not have, usually low vs. high values of probabilities. Below are some comments regarding the performance measures present in all plots.
The Somers correlation rank Dxy is a measure that represents the difference between the probability that a pair of the observed outcome and the probability predicted by the model are concordant and the probability that a pair of outcome and prediction are discordant. This pair is said to be concordant if higher prediction values are paired with the presence of the outcome, and discordant if higher prediction values are paired with the absence of the outcome. This index ranges from −1 to 1. 0 indicates no correlation. Values greater than 0 indicate that the model has discriminative value. Values less than 0 may exist but do not make sense in the context of predictive models.
The area under the ROC curve (AUC) is interpreted as the probability that the classifier will assign higher values to a subject with the randomly chosen outcome than to a subject without the randomly chosen outcome. This measure could also be interpreted as an average sensitivity to a variation in specificity for all possible values of the classifier (model) or vice versa. The ROC AUC ranges from 0.5 to 1, and the closer to 1, the better the discrimination.
R2 is a measure that verifies how much the predictions move away from or approach the observed values. This measure is usually interpreted as the fraction of the total variation of the outcome that the model can explain. This measure varies between 0 and 1; the closer it is to 1, the better the model explains the variation in the outcome.
The discrimination index D is an index that expresses the difference between the number of outcomes in the group with high predictions and the number of outcomes in the group with low predictions. This difference is weighted by the size of the group. This index varies between +1 and −1. Values greater than 0.4 indicate good discrimination, and values less than 0.2 indicate poor discrimination.
The “unreliability index U” is a calibration index, that is, it indicates how much the predictions deviate from the observed values. Ifthere is a perfect coincidence between the observed and the predicted values, the calibration graph will indicate a 45° straight line (slope = 1), and the zero value of the prediction will coincide with the zero-value observed (intercept = 0). This index simultaneously tests (null hypothesis) whether the slope is equal to 1 and the intercept is equal to 0. This index has, like every statistical test, a corresponding p-value. Very low p-values indicate a poorly calibrated model.
The quality index Q is another measure of discrimination. This index varies between 0 and 1. The closer to 1, the better the discriminatory power of the model.
The Brier Score is a measure of discrimination that represents the square of the differences between what was observed and what was predicted by the model. This index varies between 0 and 0.5 if the outcome prevalence is 0.5. Otherwise, the range of possible results may vary; for example, for an outcome prevalence of 0.10, the maximum Brier score would be 0.09. Unlike other indexes, values closer to 0 indicate better discrimination.
The Spiegelhalter Z-test for calibration has as its null hypothesis that the observed probability is equal to the predicted probability for all values of the observed probabilities. Like all statistical tests, it has a p-value. Small p-values indicate that the model is poorly calibrated.
The vertical lines at the bottom of each plot represent the density or frequency of predicted probabilities in the values on the horizontal axis. As if it were a density graph superimposed on the main graph. This should give an idea of how the predicted probabilities are concentrated or dispersed within the possible range.
Regarding the legend of lines contained in the figure. Ideal is the visual comparison parameter, as a perfect calibration between the predicted and the observed would be on the diagonal represented by the ideal. Logistic calibration is the correspondence between the predicted and the observed, represented by a logistic function. Non-parametric is the same as the previous one, but by a lowess smoothing function. The triangles are the relationship between the predicted and the observed in groups of observations, in this case in 5 quantiles.


Data availability statement
Data will become available as soon as the manuscript is accepted as an open-access object at ARCA (FIOCRUZ institutional repository): https://www.arca.fiocruz.br/.
-
Funding information
This work was partially supported by the Evandro Chagas National Institute of Infectious Diseases, Oswaldo Cruz Foundations, Rio de Janeiro, Brazil.
-
Ethical approval statement
All protection and confidentiality measures for participants were taken based on the standards of good clinical practices of the Document of the Americas and the regulatory standards of the National Health Council for research with human beings contained in Resolution No. 466/December 2012. The project was approved on May 16th, 2019, by the Evandro Chagas Infectious Diseases National Institute Ethics Committee. One may find ethical files at the National System of Ethics in Research with Human Beings (https://plataformabrasil.saude.gov.br/login.jsf) with the number CAEE: 04870918.8.0000.5262.
-
Patient consent statement
Every participant provided written consent to take part in this study in compliance with the ethical declaration.
-
Permission to reproduce material from other sources
Not applicable.
-
Clinical trial registration
Not applicable.
REFERENCES
- Abuzour AS, Hoad-Reddick G, Shahid M, Steinke DT, Tully MP, Williams SD, et al. Patient prioritisation for hospital pharmacy services: current approaches in the UK. Eur J Hosp Pharm. 2021 Nov 1;28(e1):e102-8.
-
Agência Nacional de Vigilância Sanitária. Manual para Notificação de Eventos Adversos e Monitoramento de Segurança em Ensaios Clínicos. [Internet]. 2020 [cited 2024 Sep 11]. Available on: https://www.gov.br/anvisa/pt-br/centraisdeconteudo/publicacoes/medicamentos/pesquisa-clinica/manuais-e-guias/manual-para-notificacao-de-eventos-adversos-e-monitoramento-de-seguranca-em-ensaios-clinicos-1a-edicao.pdf/view
» https://www.gov.br/anvisa/pt-br/centraisdeconteudo/publicacoes/medicamentos/pesquisa-clinica/manuais-e-guias/manual-para-notificacao-de-eventos-adversos-e-monitoramento-de-seguranca-em-ensaios-clinicos-1a-edicao.pdf/view - Alomi YA, Al-Jarallah SM, Bahadig FA. Cost-efficiency of Clinical Pharmacy Services at Ministry of Health Hospital, Riyadh City, Saudi Arabia. PTB Reports. 2019 Sep 9;5(3s): S20-2.
- Alshakrah MA, Steinke DT, Lewis PJ. Patient prioritization for pharmaceutical care in hospital: A systematic review of assessment tools. Res Social Adm Pharm. 2019 Jun 1;15(6):767-79.
- Billstein-Leber M, Carrillo CJD, Cassano AT, Moline K, Robertson JJ. ASHP Guidelines on Preventing Medication Errors in Hospitals. Am J Health-System Pharm. 2018 Oct 1;75(19):1493–517.
- Canning ML, McDougall R, Yerkovich S, Barras M, Coombes I, Sullivan C, et al. Measuring the impact of pharmaceutical care bundle delivery on patient outcomes: an observational study. Int J Clin Pharm. 2024 Oct;46(5):1172-80.
- Chen CC, Hsiao FY, Shen LJ, Wu CC. The cost-saving effect and prevention of medication errors by clinical pharmacist intervention in a nephrology unit. Medicine (Baltimore). 2017 Aug;96(34):e7883.
- Collins GS, Dhiman P, Andaur Navarro CL, Ma J, Hooft L, Reitsma JB, et al. Protocol for development of a reporting guideline (TRIPOD-AI) and risk of bias tool (PROBAST-AI) for diagnostic and prognostic prediction model studies based on artificial intelligence. BMJ Open. 2021 Jul;11(7):e048008.
- Dean B. What is a prescribing error? Quality in Health Care. 2000 Dec 1;9(4):232-7.
- Deawjaroen K, Sillabutra J, Poolsup N, Stewart D, Suksomboon N. Clinical usefulness of prediction tools to identify adult hospitalized patients at risk of drug-related problems: A systematic review of clinical prediction models and risk assessment tools. Br J Clin Pharmacol. 2022;88(4):1613-29.
- Dos Santos Barreto PG, Barbosa Rezende R, Dos Santos AL, de Oliveira Silva F, Rodrigues Bezerra Góis V, Corsino Freire E, et al. Fully independent validation and updating of a clinical pharmacy prioritizing risk score in an infectious disease hospital ward. Br J Clin Pharmacol. 2022 Aug;88(8):3695-708.
- Falconer N, Barras M, Cottrell N. How hospital pharmacists prioritise patients at high-risk for medication harm. Res Social Adm Pharm. 2019;15(10):1266-73.
- Falconer N, Nand S, Liow D, Jackson A, Seddon M. Development of an electronic patient prioritization tool for clinical pharmacist interventions. Am J Health Syst Pharm. 2014 Feb 15;71(4):311-20.
- Høj K, Pedersen HS, Lundberg ASB, Bro F, Nielsen LP, Sædder EA. External validation of the Medication Risk Score in polypharmacy patients in general practice: A tool for prioritizing patients at greatest risk of potential drug-related problems. Basic Clin Pharma Tox. 2021 Oct;129(4):319-31.
- ISPM Brasil. Desafio Global de Segurança do Paciente: Medicação Sem Danos. Boletim ISPM Brasil. 2018;7(1):6.
- Jourdan JP, Muzard A, Goyer I, Ollivier Y, Oulkhouir Y, Henri P, et al. Impact of pharmacist interventions on clinical outcome and cost avoidance in a university teaching hospital. Int J Clin Pharm. 2018 Dec 1;40(6):1474-81.
- Lambden S, Laterre PF, Levy MM, Francois B. The SOFA score-development, utility and challenges of accurate assessment in clinical trials. Crit Care. 2019 Dec;23(1):374.
- Lark ME, Kirkpatrick K, Chung KC. Patient Safety Movement: History and Future Directions. J Hand Surg. 2018 Feb;43(2):174-8.
- Lázaro Cebas A, Caro Teller JM, García Muñoz C, González Gómez C, Ferrari Piquero JM, Lumbreras Bermejo C, et al. Intervention by a clinical pharmacist carried out at discharge of elderly patients admitted to the internal medicine department: influence on readmissions and costs. BMC Health Serv Res. 2022 Feb 9;22(1):167.
- Martinbiancho JK, Zuckermann J, Mahmud SDP, dos Santos L, Jacoby T, da Silva D, et al. Development of risk score to hospitalized patients for clinical pharmacy rationalization in a high complexity hospital. Lat Am J Pharm. 2011;30(7):1342-7.
- Michel P. Comparison of three methods for estimating rates of adverse events and rates of preventable adverse events in acute care hospitals. BMJ. 2004 Jan 24;328(7433):199-0.
-
Müller M. O. farmacêutico que edificou a Farmácia Clínica no Brasil [Internet]. 2018 [cited 2024 Sep 11]. Available on: https://ictq.com.br/opiniao/747-o-farmaceutico-que-edificou-a-farmacia-clinica-no-brasil
» https://ictq.com.br/opiniao/747-o-farmaceutico-que-edificou-a-farmacia-clinica-no-brasil -
New Zealand. Severity Assessment Code (SAC) rating and triage tool for adverse event reporting [Internet]. Health Quality & Safety Commission; 2017 [cited 2022 Nov 11]. Available from: https://www.hqsc.govt.nz/assets/Our-work/System-safety/Adverse-events/Publications-resources/SAC_rating_and_triage_tool_WEB_FINAL.pdf
» https://www.hqsc.govt.nz/assets/Our-work/System-safety/Adverse-events/Publications-resources/SAC_rating_and_triage_tool_WEB_FINAL.pdf - Pearson TF, Pittman DG, Longley JM, Grapes ZT, Vigliotti DJ, Mullis SR. Factors associated with preventable adverse drug reactions. Am J Health-System Pharm. 1994 Sep 15;51(18):2268-72.
- Pencina MJ, D’Agostino Sr RB, Steyerberg EW. Extensions of net reclassification improvement calculations to measure usefulness of new biomarkers. Stat Med. 2011;30(1):11-21.
- Ravn-Nielsen LV, Duckert ML, Lund ML, Henriksen JP, Nielsen ML, Eriksen CS, et al. Effect of an In-Hospital Multifaceted Clinical Pharmacist Intervention on the Risk of Readmission: A Randomized Clinical Trial. JAMA Intern Med. 2018 Mar 1;178(3):375-82.
-
Rodrigues AT. Farmácia Clinica como ferramenta de segurança em unidade de terapia intensiva [Internet] [Doutorado em Ciências Médicas]. [Campinas]: Universidade Estadual de Campinas; 2017. Available on: https://repositorio.unicamp.br/acervo/detalhe/984830
» https://repositorio.unicamp.br/acervo/detalhe/984830 - Saedder EA, Lisby M, Nielsen LP, Rungby J, Andersen LV, Bonnerup DK, et al. Detection of Patients at High Risk of Medication Errors: Development and Validation of an Algorithm. Basic Clin Pharmacol Toxicol. 2016 Feb;118(2):143-9.
- Skjøt-Arkil H, Lundby C, Kjeldsen LJ, Skovgårds DM, Almarsdóttir AB, Kj0lhede T, et al. Multifaceted Pharmacist-led Interventions in the Hospital Setting: A Systematic Review. Basic Clin Pharmacol Toxicol. 2018 Oct;123(4):363-79.
-
Sociedade Brasileira de Farmacia Hospitalar. Padrões mínimos para farmácia hospitalar e serviços de saúde [Internet]. 3ª. São Paulo: SBRAFH; 2017. Available on: https://www.sbrafh.org.br/site/public/docs/padroes.pdf
» https://www.sbrafh.org.br/site/public/docs/padroes.pdf -
Steyerberg EW. Clinical Prediction Models: A Practical Approach to Development, Validation, and Updating [Internet]. Cham: Springer International Publishing; 2019 [cited 2024 Sep 11]. (Statistics for Biology and Health). Available from: http://link.springer.com/10.1007/978-3-030-16399-0
» http://link.springer.com/10.1007/978-3-030-16399-0 - Timóteo AT, Aguiar Rosa S, Nogueira MA, Belo A, Cruz Ferreira R. Validação externa do score de risco ProACS para estratificação de risco de doentes com síndrome coronária aguda. Revista Portuguesa de Cardiologia. 2016 Jun;35(6):323-8.
- Trivalle C, Burlaud A, Ducimetière P. Risk factors for adverse drug events in hospitalized elderly patients: A geriatric score. Eur Geriatric Med. 2011 Oct 1;2(5):284-9.
- Trivalle C, Cartier T, Verny C, Mathieu AM, Davrinche P, Agostini H, et al. Identifying and preventing adverse drug events in elderly hospitalised patients: A randomised trial of a program to reduce adverse drug effects. J Nutr Health Aging. 2010 Jan 1;14(1):57-61.
- Weltgesundheitsorganisation, Collaborating Centre for International Drug Monitoring, editors. The importance of pharmacovigilance: safety monitoring of medicinal products. Geneva: WHO [u.a.]; 2002.
-
World Health Organization. Global Patient Safety Action Plan 2021-2030: towards eliminating avoidable harm in health care. [Internet]. 2021 [cited 2024 Sep 11]. Available on: https://www.who.int/publications/i/item/9789240032705
» https://www.who.int/publications/i/item/9789240032705
Edited by
-
Associated Editor:
Inajara Rotta

 Legend: LOS = length of stay; ICU = intensive care unit