FIGURE 1
A - CG. B - PhotoG. Note retina damage: reduced thickness, with loss of nuclei of photoreceptors on ONL; disorganization and degeneration of OSPL, with presence of vacuoles and the loss of elongated, fusiform morphology. C - FG. Preservation of thickness of ONL and better maintenance of elongated, forsiform shape of OSPL. Total thickness of retina (D) and outer nuclear layer (E) of rats submitted to light exposure and the administration of fluoxetine. Note the increase in thickness in animals of FG. *p < 0.05 between PhotoG and FG. RGCL - retinal ganglion cell lay. IPL - inner plexiform layer. INL - inner nuclear layer. OPL - outer plexiform layer. ONL - outer nuclear layer. OSPL - outer segment photoreceptor layer. H.E. staining.
FIGURE 2
A - RCG. B - RPhotoG. Note retina damage: reduced thickness, with loss of nuclei of photoreceptors on ONL; disorganization and degeneration of OSPL, with presence of vacuoles and the loss of elongated, fusiform morphology. C - FG 7, D - FG 14, E - FG 21 and F - FG 30. Preservation of thickness of ONL and better maintenance of elongated, forsiform shape of OSPL. Total thickness of retina (G) and outer nuclear layer (H) of rats submitted to light exposure and the administration of fluoxetine. Note the increase in thickness in animals of FG. *p<0,05 entre os grupos FG 30 and RPhotoG.
FIGURE 3
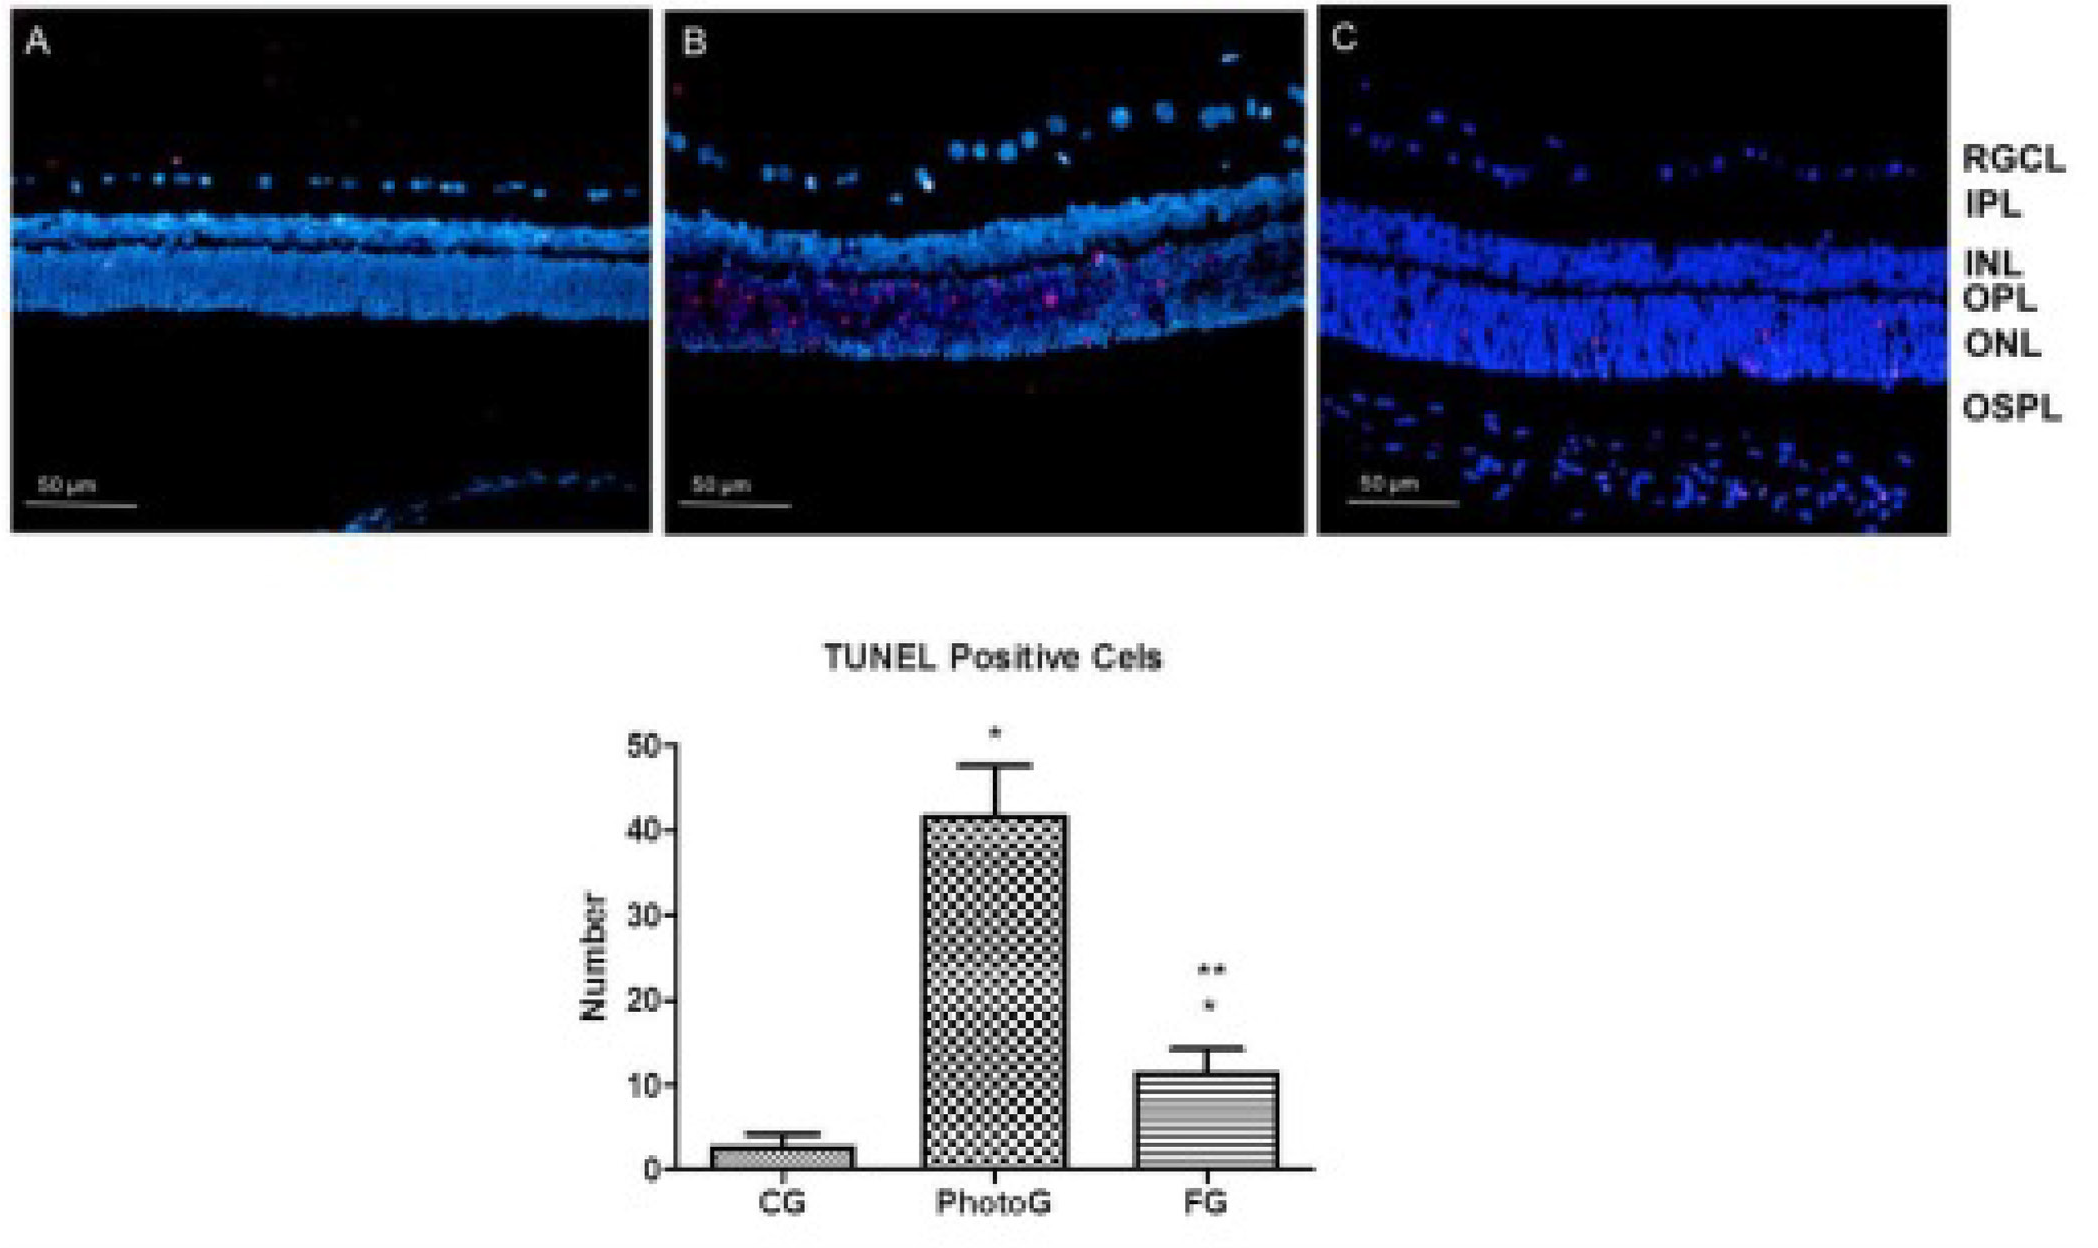
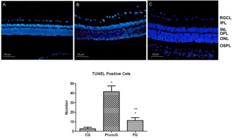
Photomicrographs with fluorescence of the retina of rats submitted to light exposure and the administration of fluoxetine, prevention experiment, demonstrating labeling of cells in apoptosis using TUNEL method in red color. And Number of positive TUNEL cells of the outer nuclear layer of rats submitted to light exposure and the administration of fluoxetine. *p < 0.05, PhotoG x CG and FG x CG. **p < 0.05, FG x PhotoG.
FIGURE 4
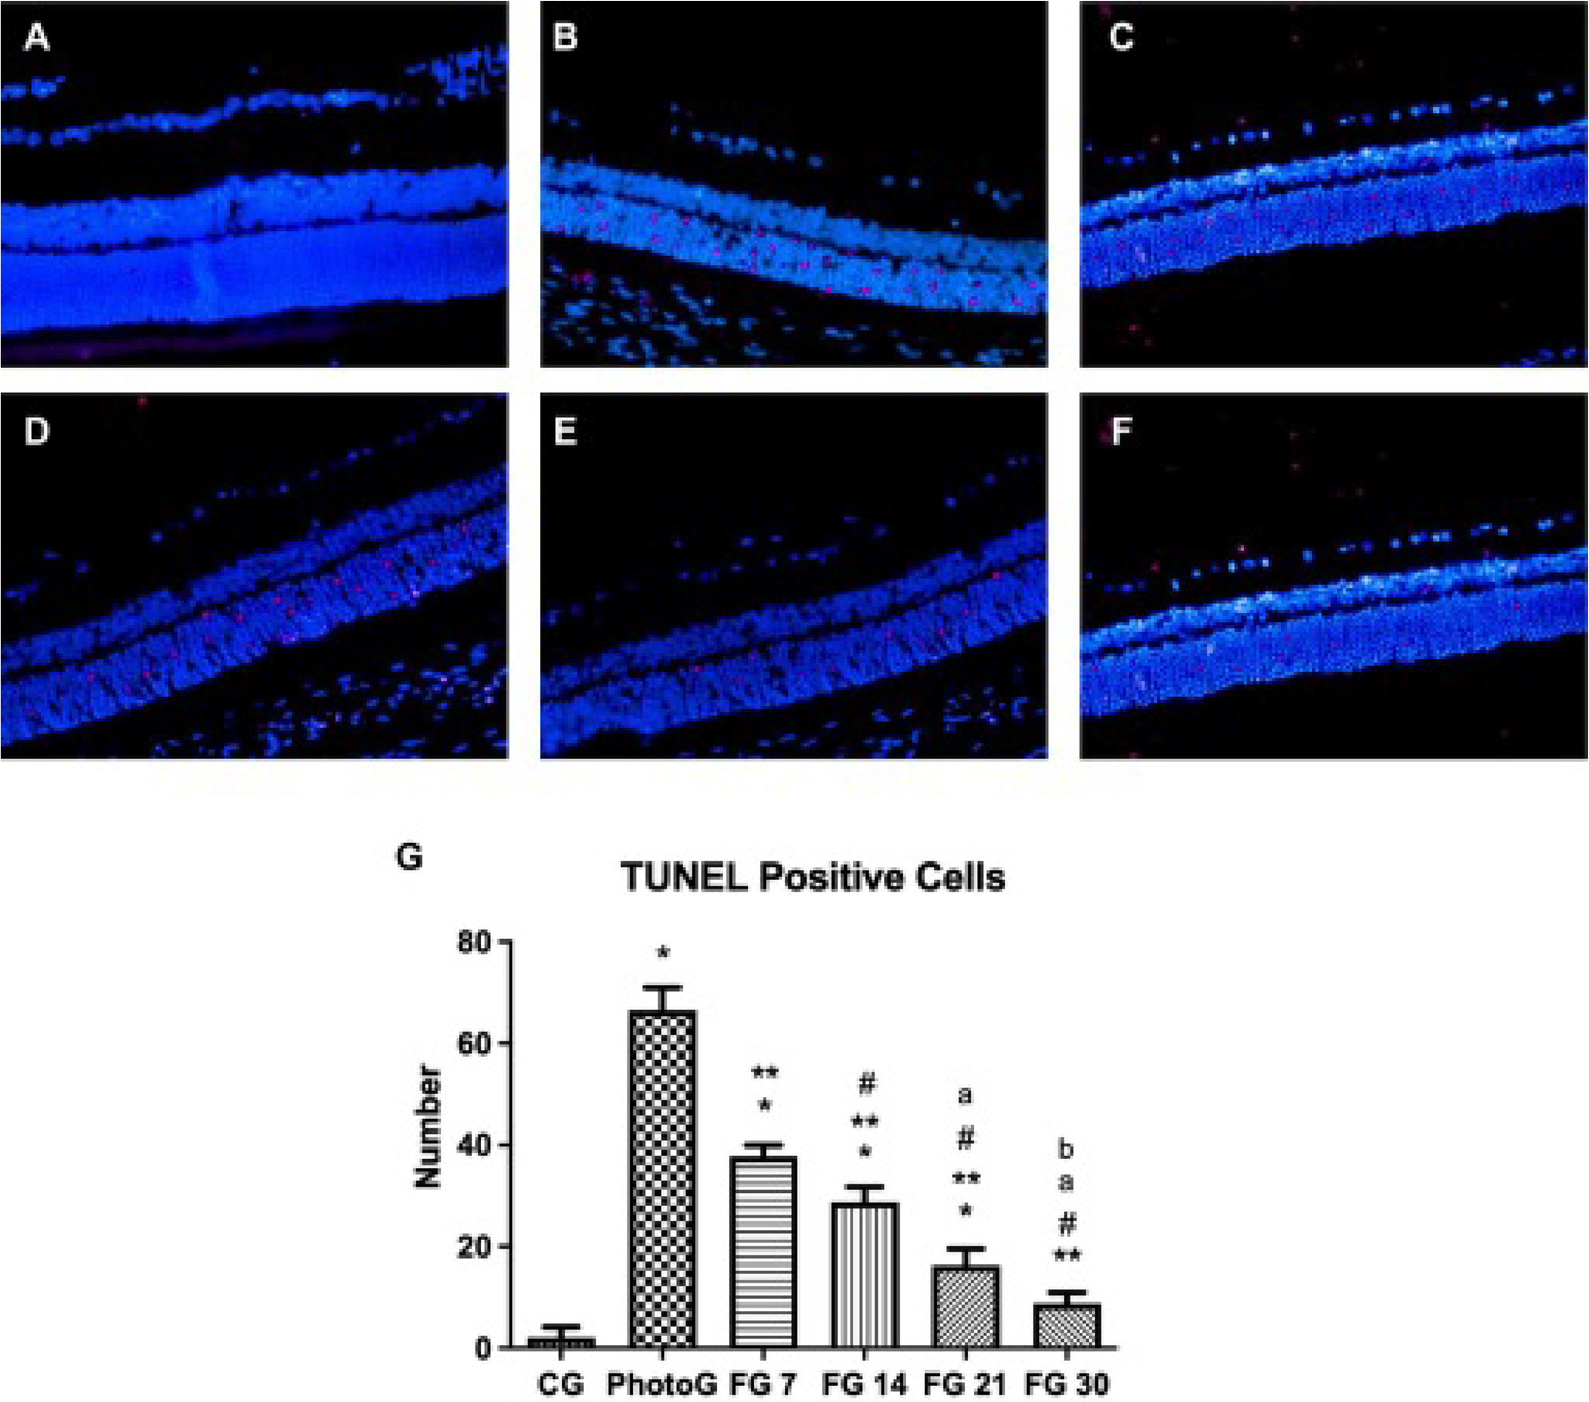
Photomicrographs with fluorescence of the retina of rats submitted to light exposure and the administration of fluoxetine, regeneration experiment, demonstrating labeling of cells in apoptosis using TUNEL method in red color. And Number of positive TUNEL cells of the outer nuclear layer of rats submitted to light exposure and the administration of fluoxetine. A - RCG, B - RPhotoG, C - FG 7, D - FG 14, E - FG 21 and F - FG 30. *p<0.05, RPotoG x RCG, FG 7 x RCG, FG 14 x RCG, FG 21 x RCG; **p<0,05, FG 7 x RPotoG, FG 14 x RPotoG, FG 21 x RPotoG, FG 30 x RPotoG; # p<0,05, FG 14 x FG 7, FG 21 x FG 7, FG 30 x FG 7; a p<0,05, FG 21 x FG 14, FG 30 x FG 14; b p<0,05, FG 30 x FG 21.
FIGURE 5
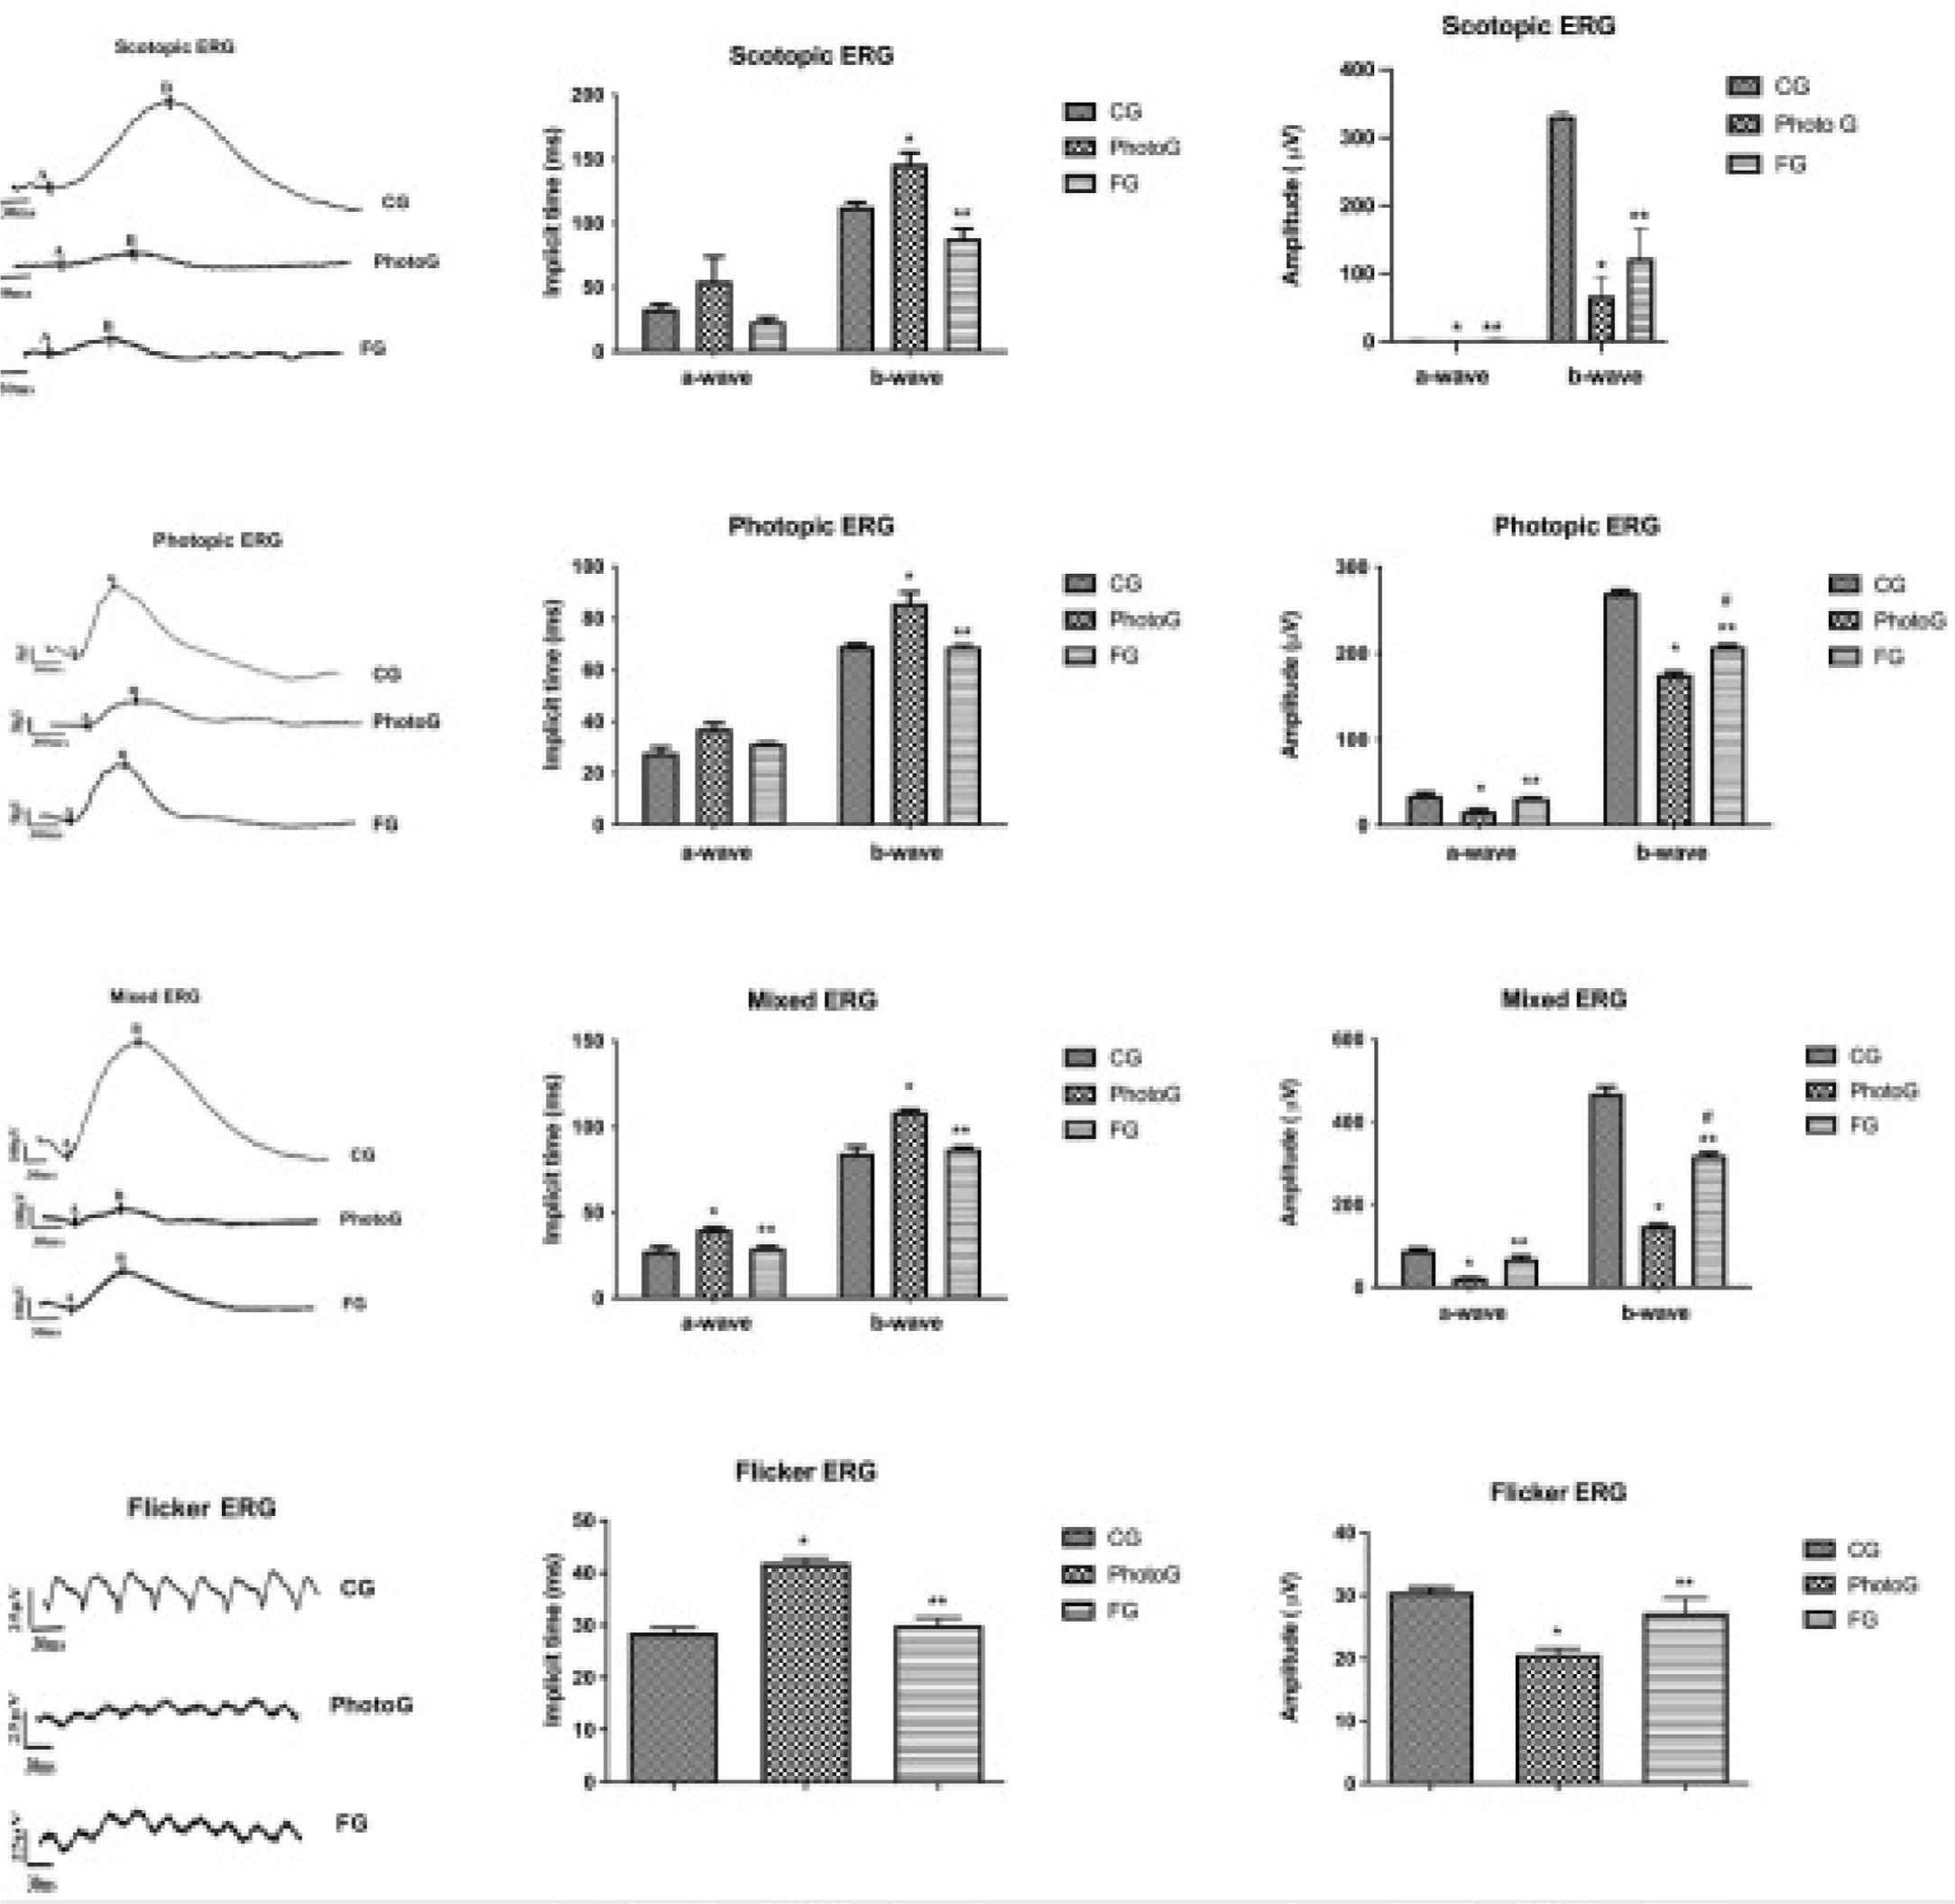
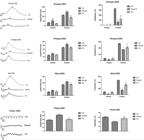
Scotopic ERG: Implicit response time (ms) of retinal cells from the emission of the flash of light to the triggering of the action potential. *p < 0.05, PhotoG x CG; **p < 0.05, FG x PhotoG. Amplitude of a-wave in μV. **p < 0.05, PhotoG x CG; **p < 0.05, FG x PhotoG. Amplitude of b-wave in μV. *p < 0.05, PhotoG x CG; **p < 0.05, FG x PhotoG. Photopic ERG: Implicit Time (ms) *p < 0.05, PhotoG x CG; **p < 0.05, FG x PhotoG. Amplitude of a-wave in μV. *p < 0.05, PhotoG x CG; **p < 0.05, FG x PhotoG. Amplitude of b-wave in μV. *p < 0.05, PhotoG x CG; **p < 0.05, FG x PhotoG; # p< 0.05, FG x CG. Mixed ERG: Implicit Time (ms) *p < 0.05, PhotoG x CG; **p < 0.05, FG x PhotoG. Amplitude of a and b-waves in μV. *p < 0.05, PhotoG x CG; **p < 0.05, FG x PhotoG.; #p < 0.05, FG x CG. Flicker ERG: Implicit Time (ms) *p <0.05, PhotoG x CG. Amplitude in μV.; **p < 0.05, FG x PhotoG.
FIGURE 6
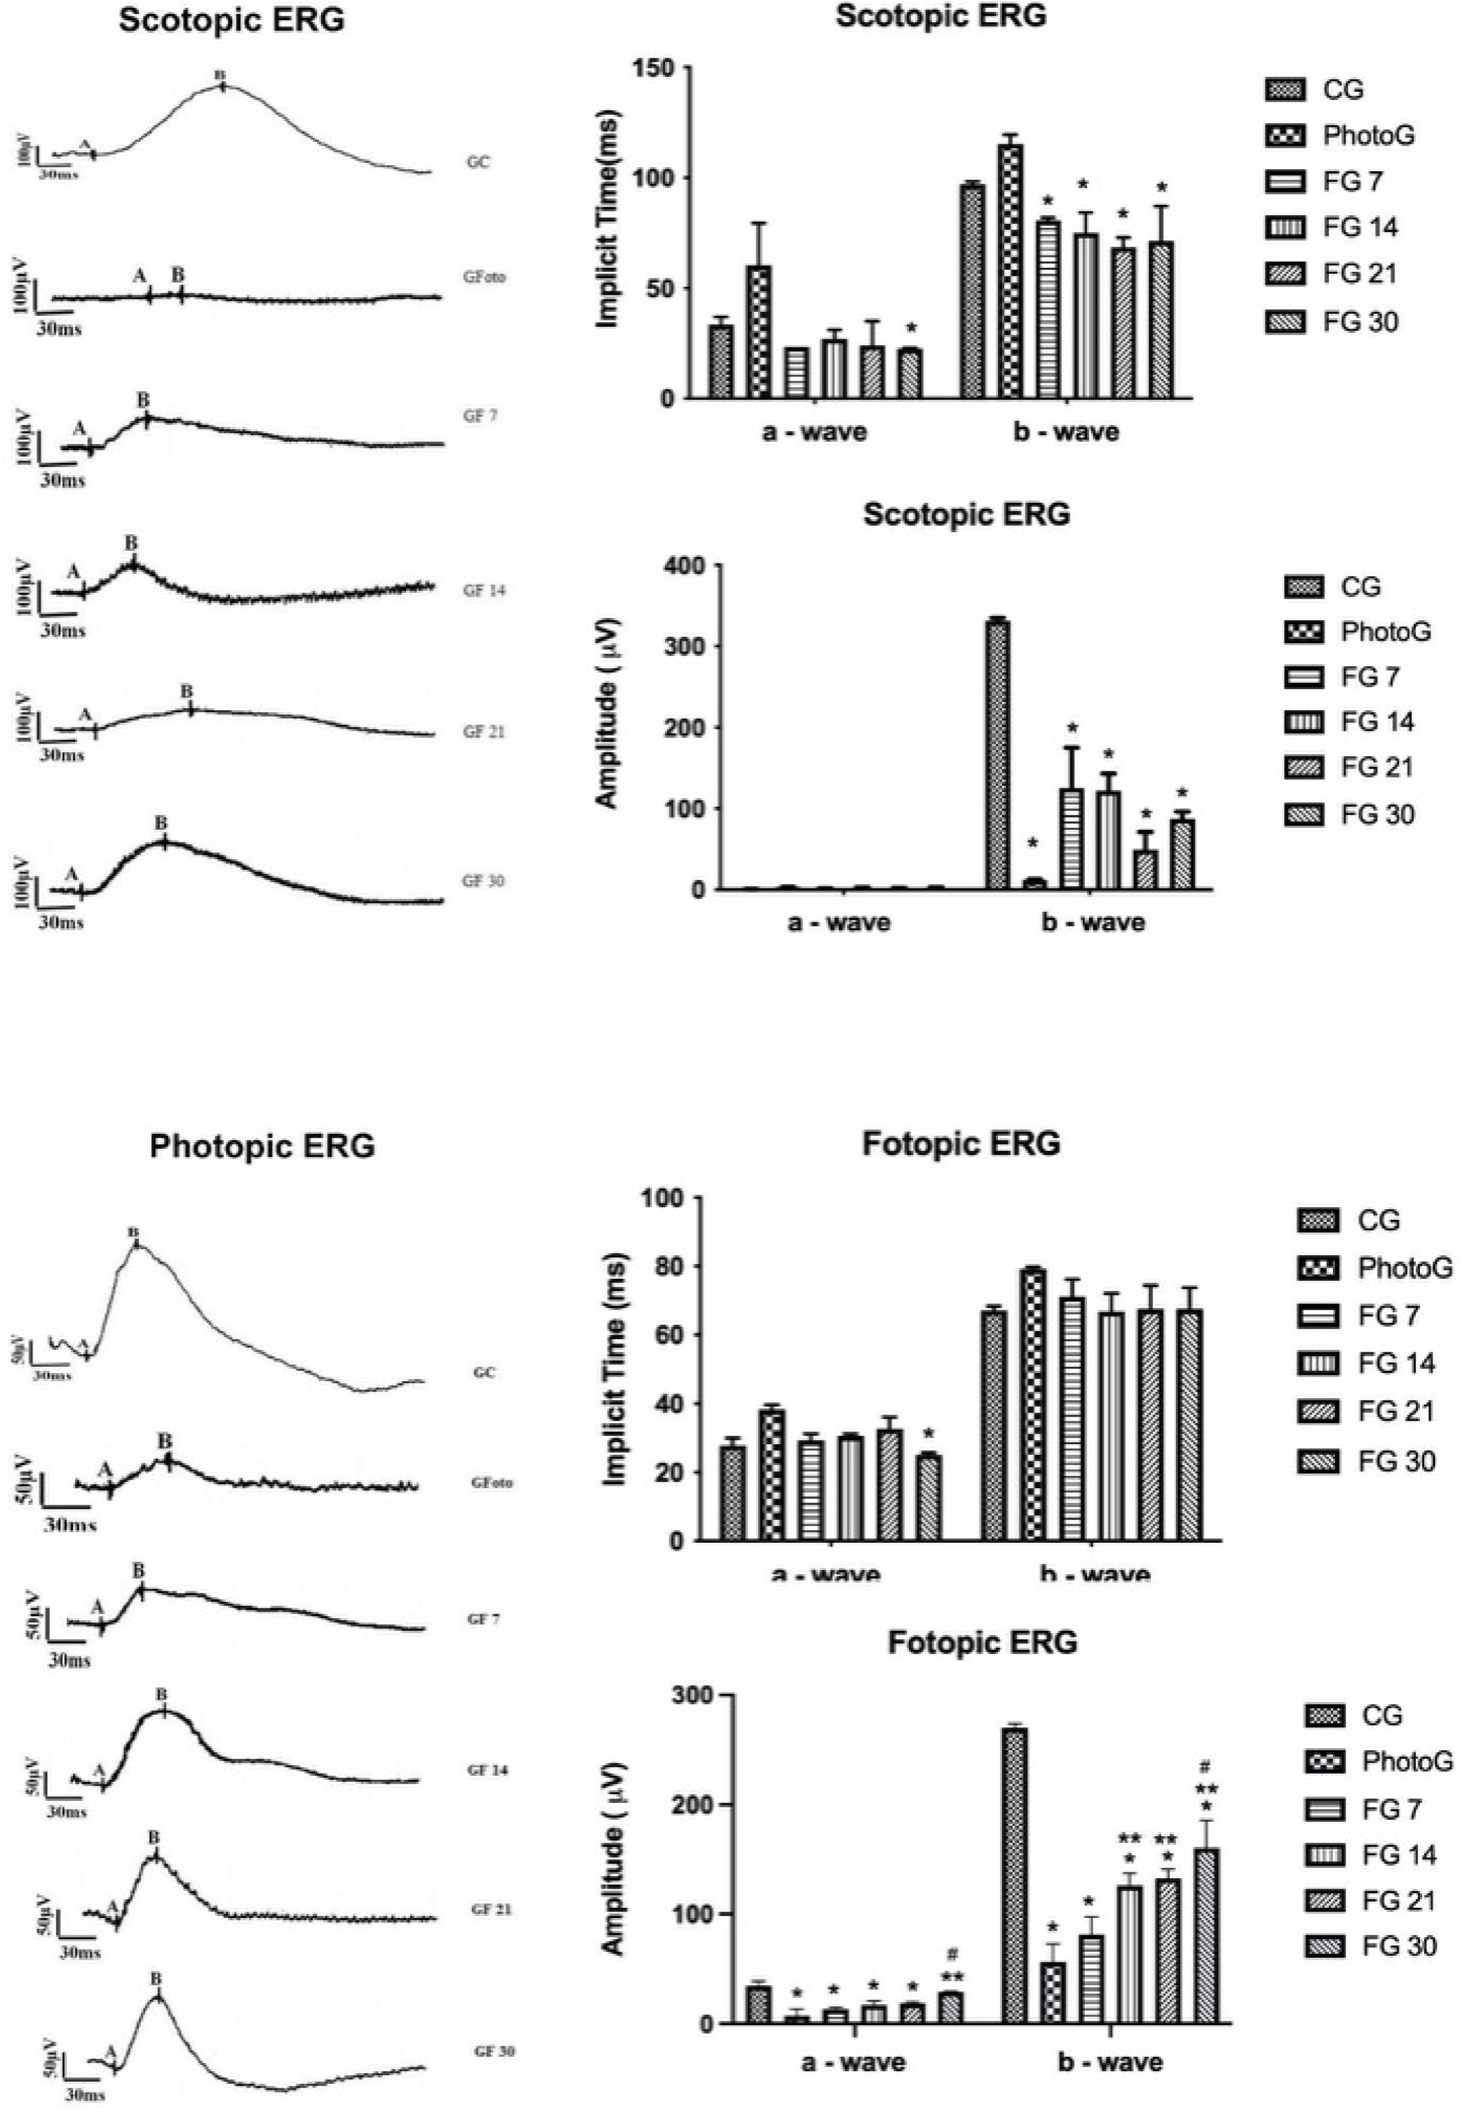
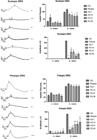
Scotopic ERG: Implicit time (ms) a-wave: *p<0,05, RPhotoG x FG 30. b-wave: *p<0,05, RPhotoG x FG 7; RPhotoG x FG 14; RPhotoG x FG 21; RPhotoG x FG 30. Amplitude (μV) a-wave: *p<0,05, RPhotoG x RCG, FG 7 x RCG, FG 14 x RCG, FG 21 x RCG and FG 30 x RCG; **p<0,05, FG 14 x RPhotoG, FG 21 x RPhotoG, FG 30 x RPhotoG. # p<0,05, FG 30 x FG 7. Amplitude b-wave *p<0,05, RPhotoG x RCG, FG 7 x RCG, FG 14 x RCG, FG 21 x RCG e FG 30 x RCG; **p<0,05, FG 7 x RPhotoG, FG 14 x RPhotoG, FG 30 x RPhotoG. Photopic ERG: Implicit time (ms) a-wave: *p<0,05, RPhotoG x FG 30. Amplitude (μV) a-wave: *p<0,05, RPhotoG x RCG, FG 7 x RCG, FG 14 x RCG, FG 21 x RCG; **p<0,05, FG 30 x RPhotoG. # p<0,05, FG 30 x FG 7. Amplitude b-wave *p<0,05, RPhotoG x RCG, FG 7 x RCG, FG 14 x RCG, FG 21 x RCG and FG 30 x RCG; **p<0,05, FG 14 x RPhotoG, FG 21 x RPhotoG, FG 30 x RPhotoG. # p<0,05, FG 30 x FG 7.
FIGURE 7
Mixed ERG: Implicit time (ms) a-wave: *p<0,05, RPhotoG x RCG. **p<0,05, FG 7 x RPhotoG, FG 14 x RPhotoG, FG 21 x RPhotoG, FG 30 x RPhotoG. b-wave: *p<0,05, RPhotoG x RCG, FG 21 x RCG, FG 30 x RCG. **p<0,05, FG 7 x RPhotoG, FG 14 x RPhotoG, FG 21 x RPhotoG, FG 30 x RPhotoG. Amplitude (μV) a-wave: *p<0,05, RPhotoG x RCG, FG 7 x RCG, FG 14 x RCG, FG 21 x RCG, FG 30 x RCG. **p<0,05, FG 14 x RPhotoG, FG 30 x RPhotoG. Amplitude (μV) a-wave: *p<0,05, RPhotoG x RCG, FG 7 x RCG, FG 14 x RCG, FG 21 x RCG and FG 30 x RCG; **p<0,05, FG 7 x RPhotoG, FG 14 x RPhotoG, FG 21 x RPhotoG, FG 30 x RPhotoG. Flicker ERG: Implicit time (ms) *p<0,05, RPhotoG x RCG. **p<0,05, FG 7 x RPhotoG, FG 14 x RPhotoG, FG 21 x RPhotoG, FG 30 x RPhotoG. Amplitude (μV): *p<0,05, RPhotoG x RCG. **p<0,05, FG 7 x RPhotoG, FG 14 x RPhotoG, FG 21 x RPhotoG, FG 30 x RPhotoG.

 Neuroprotective activity of fluoxetine in the retina of rats subjected to experimental light exposure
 Thumbnail
 Thumbnail
 Thumbnail
 Thumbnail
 Thumbnail
 Thumbnail
 Thumbnail