 Respiration modelling and aptitude of ‘INIA Ágata’ strawberries as a ready-to-eat fruit under MAP conditions
Abstract
Ready-to-eat (RTE) strawberries are highly valued for their convenience and nutritional quality, but their short postharvest life remains a major challenge for commercialization. Predictive respiration models combined with modified atmosphere packaging (MAP) represent a useful tool for designing storage systems that preserve product quality. This study evaluated the suitability of the ‘INIA Ágata’ cultivar as an RTE fruit under MAP and assessed the performance of a previously developed respiration model under short- and long-term storage conditions. Respiration kinetics were described using a Michaelis-Menten approach, including oxidative and fermentative CO2 production terms. Model predictions were validated with experimental data from short-term closed reactor experiments and long-term storage trials under passive MAP at 4 °C. In these long-term MAP trials, gas dynamics were monitored together with physicochemical, microbiological, biochemical, and sensory quality attributes. The uncompetitive Michaelis-Menten model with oxidative CO2 production showed an adequate predictive performance for short storage times (60 h). For longer storage (14 d), equilibrium conditions (EMAP) were achieved by day 3 (6-10 kPa O2 and 6-8 kPa CO2), and the model, including total CO2 production, provided a more accurate estimation of gas composition. Under these MAP conditions, physicochemical and microbiological parameters remained stable, with no significant changes in pH, soluble solids, firmness, or microbial counts. Bioactive compounds, including anthocyanins, ellagic acid, catechin, vitamin C, and total phenolics, were largely preserved; while cyanidin decreased at the end of storage, pelargonidin—the main anthocyanin—remained stable. Nonetheless, visual quality deteriorated significantly between days 10 and 14. Results obtained in this work confirm the suitability of ‘INIA Ágata’ strawberries as an RTE product under MAP, combining stable bioactive composition with predictable respiration behavior during refrigerated storage.
Keywords:
Strawberries; Ready-to-eat; Modified atmosphere packaging; Modelling; Postharvest quality; Bioactive compounds
HIGHLIGHTS
Respiration-based models accurately predicted headspace gas concentrations, confirming their value for designing effective MAP strategies for ‘INIA Ágata’ strawberries
MAP effectively preserved microbiological and nutritional quality, yet visual quality significantly deteriorated between days 10 and 14
The combined modeling–quality assessment approach validated ‘INIA Ágata’ strawberries as a suitable RTE cultivar
1 Introduction
Strawberry (Fragaria × ananassa Duch.) is a crop adapted to various environmental conditions and holds significant economic value, with over 9 million tons traded worldwide in 2021 (United Nations, 2024). It is a popular fruit among consumers due to its distinctive appearance, flavor, and taste, as well as its abundance of beneficial bioactive compounds, including phenolic components, anthocyanins, ascorbic acid, vitamins, and minerals (Giampieri et al., 2012). It is a non-climacteric fruit, delicate and with a high respiration rate, often susceptible to mechanical injury, physiological disorders, and postharvest decay during storage (Bovi et al., 2018a; Van de Velde et al., 2019). All these factors contribute to the high perishability of strawberries, posing a great challenge to maintaining their freshness and extending shelf life during storage and commercialization. The nutritional and sensory quality of strawberries varies due to several factors, including variety, production management, environmental conditions, maturity stage at harvest, and pre- and postharvest agricultural practices (Parvez & Wani, 2018).
Particularly, in Uruguay, strawberries are primarily sold fresh, although during spring, surplus production is directed to the processing industry. Strawberry production offers economic opportunities to rural regions due to its high market value as a fresh or processed product (Mezzetti et al., 2016). From 2017 to the present, annual local market sales have averaged around 3000 tons as reported by Mercado Modelo (Unidad de Agroalimentaria Metropolitana, 2024). Production in Uruguay is concentrated in two main regions: the northern area (Salto and Artigas) and the southern area (San José and Canelones). The south region mainly grows strawberries in open fields, providing fruit during spring and summer, while the north relies on protected cultivation (macro and micro-tunnels) to supply the market early in winter and spring, enabling year-round availability. Additionally, the northern region primarily uses national cultivars, whereas the southern region is based on imported varieties (Vicente et al., 2009). Genetic improvement efforts have prioritized the development of varieties that combine high yield with desirable fruit characteristics, such as optimal weight, color, firmness, and shape, as well as resistance to pests and diseases, early ripening, and adaptability to different production systems and growing cycles (Pedrozo et al., 2023). ‘INIA Ágata’ was released in 2016 and rapidly adopted. At present, ‘INIA Yrupé’ and ‘INIA Ágata’ varieties represent more than 95% of the strawberry production in the north of the country (Lado et al., 2023). Studies performed with this cultivar have been focused on primary production and evaluation of sensory perception, but no evaluation of its quality as a ready-to-eat product has been considered.
The growing demand for ready-to-eat (RTE) fruit and vegetables is driven by consumers' desire for convenience, as well as an increasing preference for healthy food options, which is reshaping consumption habits globally (Yu et al., 2024). The development of RTE fruit and vegetables presents several challenges, the most critical being the need to slow down the rapid deterioration of these products while maintaining their quality and fresh-like characteristics (Paulsen et al., 2021).
Modified atmosphere packaging (MAP) is an appropriate technology for maintaining quality attributes and extending fresh-cut products’ shelf-life. The combination of low storage temperatures (0 – 5 °C) and controlled atmosphere conditions (5-10 kPa O2 and 15-20 kPa CO2) is commonly recommended to prolong the postharvest life of strawberries. However, O2 concentrations below 5 kPa or CO2 levels exceeding 15-20 kPa may induce fermentative metabolism, leading to deterioration of sensory attributes, tissue integrity, and overall fruit quality. Nevertheless, some studies have reported that lower CO2 concentrations (around 6-10%) may provide comparable or improved freshness preservation compared with higher levels, suggesting that optimal atmospheres for some strawberry cultivars may require more moderate CO2 concentrations. In addition, weight loss and Botrytis growth are among the main factors limiting the shelf life of RTE strawberries (Badillo & Segura-Ponce, 2020; Hertog et al., 1999; Li & Kader, 1989; Zhang et al., 2024).
When designing MAP conditions, it is necessary to determine the influence of internal gaseous atmosphere (oxygen-O2 and carbon dioxide-CO2) and temperature on fresh-cut metabolism, allowing for predicting the best conditions for shelf-life extension. Mathematical modeling of fruit respiration plays a critical role in the design and optimization of packaging systems for minimally processed products. Therefore, the integration of MAP with respiration modeling provides a key strategy to extend the shelf-life of RTE, supporting waste reduction and fostering more efficient and resilient food supply chains. While respiration rate models for various strawberry cultivars are well-documented (Barrios et al., 2014; Geysen et al., 2005; Hertog et al., 1999; Talasila et al., 1992), there is limited literature specifically addressing fresh-cut strawberries and no reports associated with the ‘INIA Ágata’ variety. Recently, a respiration model was developed for this variety, which showed good predictive performance for the evolution of oxygen and carbon dioxide concentrations in short storage periods (45 h) in closed systems (Irazoqui et al., 2025). However, the model’s applicability in other postharvest conditions—such as commercial packaging systems and extended shelf-life scenarios—remains unexplored. In this context, extending the validation of the developed respiratory models to longer storage durations and integrating them with the assessment of key quality indicators is crucial to evaluate the suitability of this variety of strawberries as RTE fruit.
To support quality retention and promote new market opportunities for this variety, the present study aimed to: (i) evaluate respiration model performance for the prediction of internal O2 and CO2 concentrations in MAP RTE ‘INIA Ágata’ strawberries in prolonged shelf-life scenarios, and (ii) assess the performance of this strawberry variety as an RTE product by analyzing the effect of MAP on physicochemical quality attributes.
2 Materials and methods
2.1 Raw material
Strawberries (cv. ‘INIA Ágata’) at the ripe stage were obtained from a local grower located in Salto (Uruguay). Immediately after harvest, strawberries were directly transported from the farm to the laboratory of Tecnología de Alimentos (DQL, CENUR Litoral Norte) in Paysandú, Uruguay, for processing. Fruit with the absence of defects, uniform color, and size were sorted to obtain a homogeneous batch. Minimally processed samples were prepared by manually hulling the fruit with a stainless-steel knife and sanitized by dipping in 80 mg L-1 peracetic acid solution for 5 min. Afterwards, excess water was removed by a domestic salad spinner and air dried until the experiments.
2.2 Packaging experiments
Prepared samples were placed in polypropylene trays (PP) and heat-sealed in an air atmosphere with low-density polyethylene film (PE, 30 µm thickness) with transmission rate (TR) at 20 °C and 80% RH: TRO2 = 2.4 × 10− 8 mol m-2 kPa-1 s-1; TRCO2 = 1.1 × 10⁻⁷ mol m-2 kPa-1s-1. To assay two different storage time scales, the experimental storage conditions evaluated were:
-
Experiment 1: (144 ± 2) g of minimally processed strawberries were stored at 12°C for 70 h (PP dimensions 15.0 cm x 13.0 cm x 6.0 cm and PE films dimensions 15.0 cm x 20.0 cm).
-
Experiment 2: (250 ± 11) g of minimally processed strawberries were stored at 4°C for 14 d in darkness (PP dimensions 20.0 cm x 16.0 cm x 4.0 cm and PE dimensions 30.0 cm x 22.0 cm).
2.3 Internal atmosphere and temperature evolution throughout storage
In Experiments 1 and 2, containers were stored under controlled temperature conditions (±1 °C). Temperature and relative humidity inside the containers were registered using Lascar-EL-USB-2 (Pennsylvania, USA). Evolution of the internal atmosphere was evaluated by removing trays at pre-defined storage times and measuring O2 and CO2 concentrations with a gas analyzer (Oxybaby 6.1, WITT, Germany). O2 and CO2 concentrations were expressed in kPa.
2.4 Respiration model performance in extended shelf-life scenarios
O2 and CO2 concentration evolution inside strawberry packages was modelled applying global mass balances for O2 and CO2 as shown in Equations 1 and 2, respectively:
In Equations 1 and 2, represent free headspace volume inside the package (mL), and are the concentration of O2 and CO2 in package headspace (kPa) respectively; is time (h), and are film permeability to O2 and CO2 (mL m-2 day-1) respectively, is film thickness, is the effective surface area of the package available for gas exchange (m2), and are the partial pressures (kPa) of O2 and CO2 inside the package, product mass (kg), and are product respiration rate (mL kg-1 h-1) expressed as O2 consumption and CO2 production respectively.
The respiration model for fresh-cut strawberries (cv. ‘INIA Ágata’) previously developed by Irazoqui et al. (2025), which integrated both phenomenological and non-phenomenological approaches, was applied to predict O2 and CO2 concentrations in Experiments 1 and 2 using Equations 1 and 2, respectively. For oxygen consumption rate (RRO2), the best performance for phenomenological models was achieved by the uncompetitive Michaelis-Menten model combined with a power model for temperature dependence, yielding an R2 = 0.911 (Equation 3). In the case of CO2 production rate (RRCO2), the Michaelis-Menten uncompetitive model, which includes both fermentative and oxidative respiration terms, along with exponential temperature dependence, provided the best fit with an R2 of 0.945 (Equation 4). Additionally, a model for CO2 production, including the oxidative term only, was included for comparison (Equation 5):
Where , and , are power and exponential coefficients, is the temperature expressed in °C. is Michaelis-Menten constant for O2 consumption; is Michaelis-Menten constant for uncompetitive inhibition of O2 consumption by CO2 (%), is the respiratory quotient, is Michaelis-Menten constant for CO2 production, and are Michaelis Menten constant for the inhibition of CO2 production by O2 and CO2, respectively. Table 1 shows parameter values and their standard error used in the model.
Parameter values and their standard error (SE) for fresh-cut strawberries (cv. ‘INIA Ágata’).
The parameters associated with Equations 3 and 4 were solved simultaneously with one of the two respiration model sets of equations: Total-CO2 (Equations 3 and 4) or Oxidative-CO2 (Equations 3 and 5).
Predictions obtained were compared with experimental data (c.f. Section 2.3), and Root Mean Square Error (RMSE) was used to evaluate model adequacy to experimental results. Differential equations were solved numerically with the ‘ode45’ method from the ode function of ‘deSolve’ package of R software (version 4.3.3).
2.5 Quality evaluation of RTE ‘INIA Ágata’ strawberries under modified atmosphere
Experiment 2 (section 2.2 b) was used to evaluate the performance of the ‘INIA Ágata’ cultivar as a ready-to-eat product. At preselected storage times (0, 4, 7, 10, and 14 d), three trays were sampled. Different packages were used at each sampling point. Samples were immediately evaluated in the case of physical and sensory attributes or freeze – dried for chemical analysis. The following quality attributes were measured throughout shelf-life: weight loss, instrumental color and firmness, pH, total soluble solids (TSS), microbial load, total phenolic content (TPC), total antioxidant capacity (TAC), anthocyanins, vitamin C, catechin and ellagic acid content, and sensory attributes.
2.5.1 Total Soluble Solids (TSS), pH, and weight loss (WL)
TSS content of strawberries, expressed as ºBrix, was measured using a portable refractometer Master-A model (Atago, Japan). pH determination was performed using a digital pH meter in the juice (model PHS-3C, Orion, Belgium). WL was calculated as the difference between the original mass and the mass at each sampling time and was expressed as a percentage of the original mass (%).
2.5.2 Instrumental color and firmness
Color measurements were analyzed by direct readings on the surface of strawberries using a spectrocolorimeter model CR-400 (Konica Minolta, USA). Calibration was performed using a white standard plate, and D65 illuminant was used. Five strawberries per tray were measured, and L* (lightness-darkness), a* (redness-greenness), and b* (blueness-yellowness) parameters were obtained by the CIELab color system. Fruit redness was assessed using the color index (CI) as mentioned by Pedrozo et al. (2024) and calculated by Equation 6 (López Camelo & Gómez, 2004). This index integrates , , and coordinates into a single parameter of red chromatic intensity, with higher values reflecting a more intense red color.
Firmness measurements were conducted using an Instron Texture analyzer (Serie 3342, USA). Firmness (N) of strawberries was assessed using a Warner-Bratzler (WB) blade at a test speed of 1 mm s-1. Five strawberries per tray were measured. Firmness was expressed as the maximum cut-force and expressed in Newtons (N).
CI and firmness measurement at day 4 could not be determined due to a temporary technical limitation associated with equipment availability and are therefore indicated as ND.
2.5.3 Microbiological analysis
Microbial counts for total mesophilic counts (TMC), Enterobacteriaceae counts (ENT), and yeast and mold counts (YC and MC) were determined using 3M™ Petrifilm™ plates according to the manufacturer’s instructions (3M Food Safety, St. Paul, MN). Briefly, to generate the dilution 10–1, 10 g of strawberry puree was homogenized for 1 min with 90 mL of sterile saline solution (0.85%) in sterile stomacher bags. Petrifilm Interpretation and User Guides validated for food analysis by the AOAC and AFNOR were followed for TMC, ENT, YC, and MC counts, respectively (3M, 2017; Neogen Corporation, 2023a, 2023b). Incubation conditions were (35 ± 1) °C for (48 ± 3) h for TMC and for 24 ± 2 h for ENT, while for YC and MC, incubation conditions were (25 ± 1) °C for 5 d. Three replicates at each storage condition were analyzed, and two dilutions were prepared for each replicate. Microbial counts were calculated and expressed as log CFU per g of sample (log CFU g-1).
2.5.4 HPLC quantification: Vitamin C (ascorbic acid-AA and Dehydroascorbic acid-DHAA), ellagic acid, catechin, cyanidin, and pelargonidin content
For Vitamin C, sample extraction and quantification were carried out according to Van de Velde et al. (2012). Briefly, 0.25 grams of strawberries were mixed in 25 mL of extracting solution (30:80, metaphosphoric acid: acetic acid). The mixture was sonicated for 10 min, homogenized for 2 min, and then centrifuged at 16000 x g for 15 min at 10 °C. For total vitamin C content (Vit C), 1 mL of supernatant was added to 0.2 mL of DTT (DL-dithiothreitol, 1.0 g L-1), vortexed for 30 s, and kept in darkness for 2 h. Afterwards, 0.2 mL of AA or Vit C extracts were diluted in 1 mL mobile phase. The mobile phase used was sodium acetate/acetic acid (solution A) and acetonitrile (solution B). The flow rate was 0.8 mL min-1, and the injection volume was 3 µL. Quantification of Vit C and AA was performed using a calibration curve of ascorbic acid standard (0-550 ppm) at 269 nm. DHAA content was calculated as the difference between total vitamin C and ascorbic acid content.
Extraction procedure and quantification for ellagic acid, catechin, and anthocyanins were performed according to Tarola et al. (2013). 500 mg of freeze-dried sample were dissolved in 8 mL methanol (HPLC grade). The mixture was vortexed for 2.5 min and sonicated for 30 min. Finally, the mixture was centrifuged at 5500 × g for 15 min at 10 °C (SL16 model, Thermo Scientific, USA). Supernatant was transferred to a 10 mL volumetric flask and brought to volume with the extraction solution. The analysis was performed on the aglycone or nonconjugated phenolic compounds. To achieve this, 2 mL of extracts were hydrolyzed by adding 1 mL of HCl (12 mol L-1) followed by heating for 50 min at 90 °C. A dilution 1:10 of cooled extracts in mobile phase were injected with calibration curves of catechin (0-10 ppm, 84% purity, PhytoLab), ellagic acid (0-10 ppm, 98% purity, Sigma Aldrich) cyanidin chloride (0-50 ppm, 84% purity, PhytoLab) and pelargonidin chloride (0-50 ppm, 84% purity, PhytoLab) standards.
The qualitative and quantitative analyses were carried out according to Tarola et al. (2013) and performed using an Ultimate 3000 HPLC (Thermo Scientific) equipped with an automatic injector and diode array detector (DAD 3000). A reverse-phase C18 column (Agilent Eclipse Plus, 1.8 µm and 4.6 × 100 mm) was used. The mobile phase was formic acid in water (0.5%) and acetonitrile, the flow rate was 0.8 mL min-1, and the injection volume was set to 5 µL. The detector was set at 280, 340, 520, and 540 nm. Results were expressed as mg per g of dry weight (mg g-1 DW).
2.5.5 Total Phenolic Content (TPC) and Total Antioxidant Capacity (TAC)
Folin–Ciocalteau assay was used to quantify Total Phenolic Content (TPC) as described by Singleton et al. (1999). The quantification procedure used was carried out as mentioned by Irazoqui et al. (2024). 100 µL of extract (see section 2.5.4) was incubated with 3000 µL of sodium carbonate (2%) and 50 µL of Folin-Ciocalteu reagent. The mixture was mixed and kept in the dark for 60 min at room temperature. Absorbance was measured at 750 nm. A calibration curve was prepared with gallic acid standard (0–800 mg L−1). TPC was expressed as mg gallic acid equivalents (GAE) per g of dry weight (mg g-1 DW).
Total Antioxidant Capacity (TAC) was estimated by the ABTS method according to Re et al. (1999). Activated ABTS·+ solution (with potassium persulfate,140 mmol L-1, 16 h) was diluted with buffer phosphate (5 mmol L−1, pH 7.4) to obtain an absorbance of 0.70 ± 0.02 at 734 nm. A calibration curve was prepared with a Trolox standard (0–200 µmol L−1). 300 µL of extract (see section 2.6.4) or standard solution was added to 2700 µL of ABTS·+ solution, and absorbance was measured at 734 nm after 10 min. TAC was expressed as µmol of Trolox equivalents (TE) per g of dry weight (µmol g-1 DW).
2.5.6 Sensory evaluation
At each storage time, samples were evaluated by a panel of 8 semi-trained assessors (20-40 years old). Panelists had more than 50 h of prior experience in sensory evaluation of ready-to-eat (RTE) products. For panel training, an initial session to identify and align attributes and evaluations that best described the sensory characteristics of strawberry samples was performed. The different samples were obtained by storing strawberries at different temperatures and times. Sensory evaluation focused on a limited number of intuitive quality attributes to monitor their evolution throughout storage: global visual appearance (VA), browning (Br), fungal growth (FG), and softening (S).
For strawberry evaluation, samples were randomly selected and presented to assessors in closed odourless plastic containers labelled with three-digit numbers at room temperature. Score’s attributes were evaluated using a 10 cm structured scale with none/severe anchors.
2.5.7 Data analysis
A one-way ANOVA test was performed for each quality trait, considering storage time as a fixed source of variation. When significant effects were found, significant differences between mean parameter values were determined by applying the Tukey test (p < 0.05). All statistical analyses were performed using R Studio (‘Agricolae’ package). For graphics, the package ‘ggplot2’ was used.
3 Results and discussion
3.1 Model performance: short-term storage (Experiment 1)
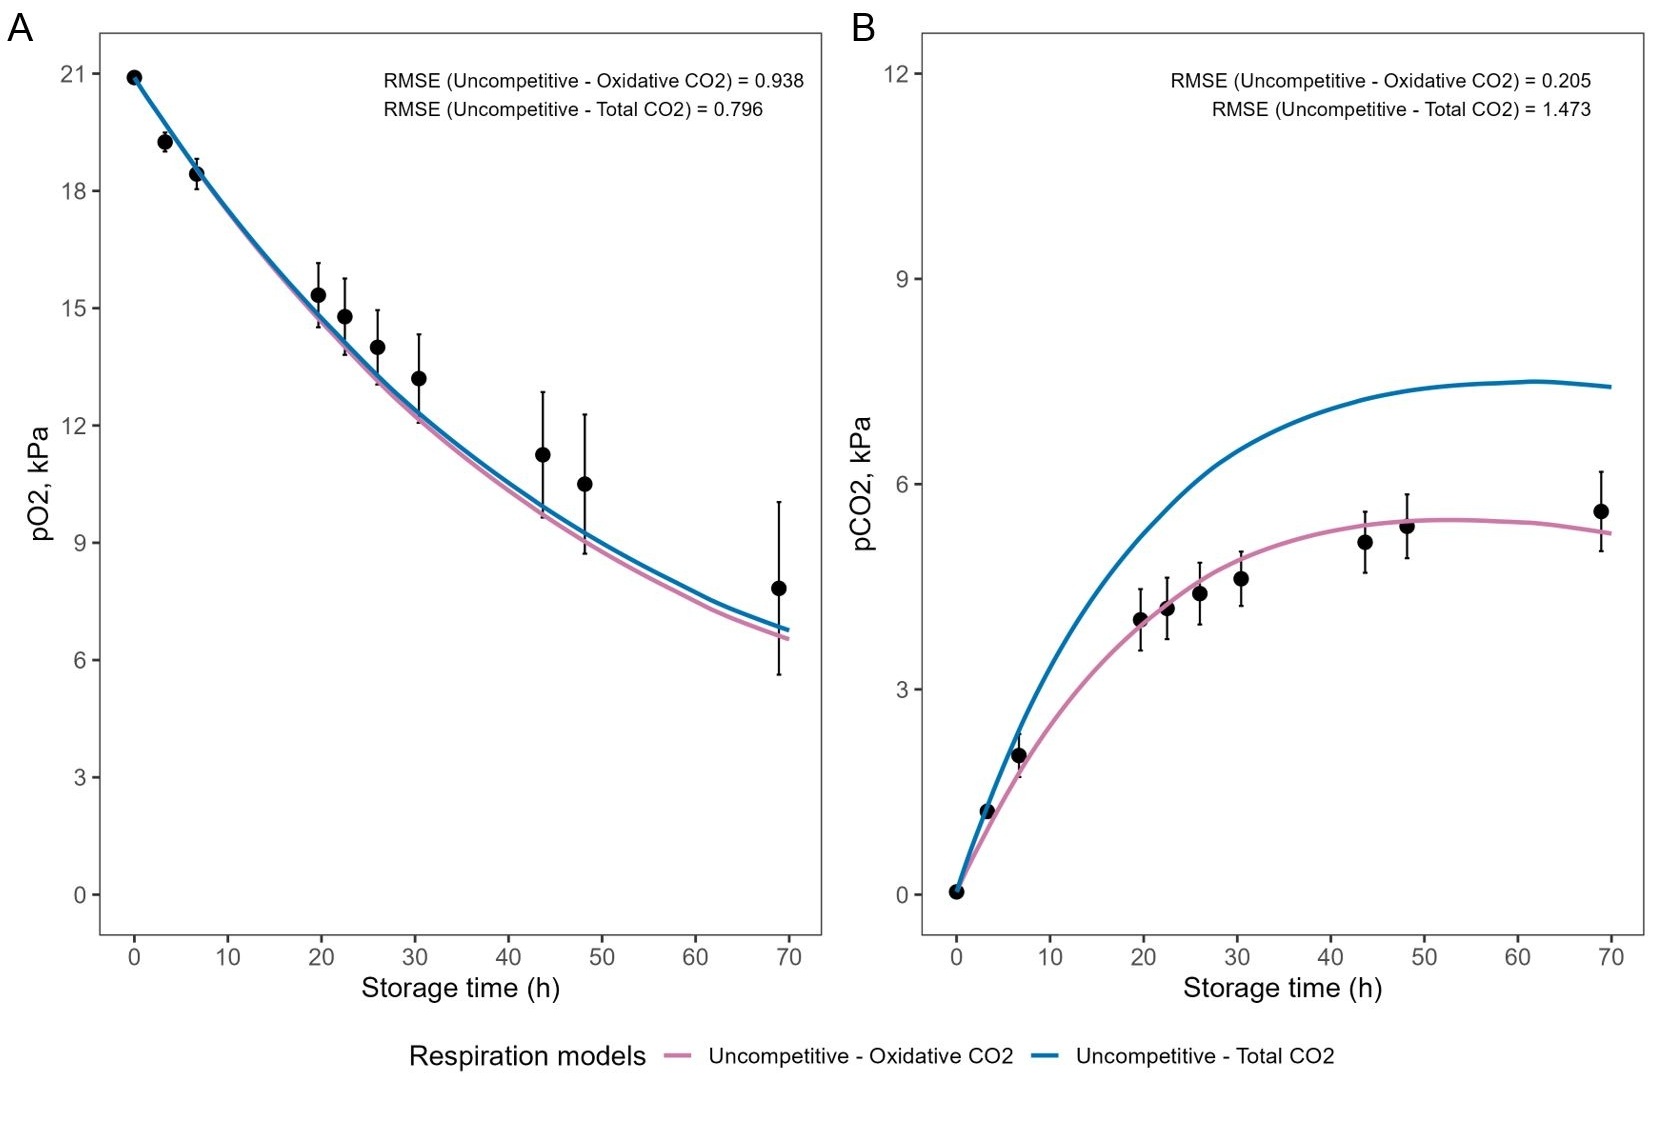
Evolution of O2 and CO2 concentrations inside packages over 70 h storage period is shown in Figure 1. A steady decrease in O2 concentration and a corresponding increase in CO2 concentration were observed, consistent with the expected respiratory pattern of fresh-cut strawberries packaged in MAP conditions (Rashvand et al., 2023). As previously mentioned, O2 and CO2 concentration evolution was assessed considering two approaches for respiration modeling: (i) total CO2 production (Equations 3 and 4) and (ii) only the oxidative component of CO2 production (Equations 3 and 5).

Experimental and simulated O2 (A) and CO2 (B) concentration evolution as a function of storage time for fresh-cut strawberries under MAP conditions throughout 70 h storage at (12.13 ± 0.33) °C. Experimental data are expressed as means ± standard deviation (black dots).
An overestimation of CO2 concentration inside packages was observed when both metabolic pathways (oxidative and fermentative) were considered for the CO2 production rate (Total-CO2). These results suggest that the uncompetitive Michaelis-Menten model with oxidative CO2 production provides the best prediction for gas behavior in the permeable packaging conditions during the early stages of storage. This indicates that the fermentative contribution may not be relevant in the initial packaging phases. Moreover, omitting the fermentative term reduces the number of parameters to estimate, thereby increasing the degrees of freedom. In addition, it allows the respiratory kinetics to be determined based solely on oxygen consumption (RRO2).
3.2 Model performance: long-term cold storage (Experiment 2)
Robustness of the respiration rate models was evaluated for longer storage periods to assess their performance in more realistic postharvest conditions. Simulations and experimental data for O2 and CO2 concentration evolution inside strawberry packages over 14 days of storage are shown in Figure 2.

Experimental and simulated O2 (A) and CO2 (B) evolution as a function of storage time for fresh-cut strawberries under MAP conditions for 14 d at (4.27 ± 0.33) °C. Experimental data are expressed as means ± standard deviation (black dots).
In this experiment, the internal atmosphere showed a rapid decrease in O2 concentration and an initial increase in CO2, followed by stabilization after the fourth day of storage (Figure 2A and B). The values predicted by the fitted models adequately reproduced the observed trends for both oxygen consumption and carbon dioxide production. In particular, the model that included the fermentative contribution (Total-CO2, Equations 3 and 4) more accurately described the experimental CO2 evolution. An overestimation of O2 consumption was observed for both respiration models beyond day six, showing a lower predictive accuracy compared with short-term validation performance for simulated O2 concentration. This behavior is reflected in the higher RMSE values obtained in these experimental conditions (1.092 for the total-CO2 respiration system and 1.284 for the Oxidative-CO2 system).
Notably, in contrast with the results obtained for short-storage validations, the Oxidative-CO2 respiration system underestimated the experimental CO2 concentrations beyond day three (first experimental measurement), suggesting that fermentative pathways may become relevant for prolonged storage times. From day three of storage, an equilibrium atmosphere in terms of O2 and CO2 concentrations (6-10 kPa O2 and 6- 8 kPa CO2) was reached inside packages, and this was predicted by the models. However, only the total-CO2 respiration system accurately predicted the experimental values obtained.
The benefits of reaching an EMAP condition inside packages are that compensation is established between respiratory consumption/production of stored products and permeation of gases through the packaging film, providing a sustained and stable respiratory atmosphere without requiring an artificial initial atmosphere (Zhang et al., 2024). This has received increasing attention in RTE strawberry preservation because it may reduce losses by up to 40% according to Matar et al. (2020). Lei et al. (2022) reported an optimum gas combination of 10kPa O2 and 10 kPa CO2 for the whole strawberry (cv. ‘Benihppe’).
Overall, model performance testing findings reinforce the value of flexible modeling approaches that can adapt to different time scales and storage conditions, which is relevant for the accurate design of MAP systems and postharvest decision-making.
3.3 Quality evaluation of “INIA Ágata” strawberries under MAP
3.3.1 Physicochemical parameters: TSS, pH, WL, instrumental color, and firmness
Ready-to-eat packaged strawberries lost very little weight, WL being lower than 2% throughout the storage period (14 d). Weight loss is a crucial factor for directly assessing the commerciality of strawberries. Considering a quality limit of 6%, this parameter was not a shelf-life limitant in the studied storage conditions (Bovi et al., 2018a; Zhang et al., 2024). Meanwhile, pH remained constant at (3.55 ± 0.03) throughout storage time. Evolution of TSS, color, and firmness are shown in Figure 3.

TSS (°Brix), firmness (N) and Color Index (CI) evolution throughout MAP storage of fresh-cut strawberries at 4 °C. Different letters indicate statistically significant differences between storage times (p-value < 0.05).
Similar pH values and slightly higher soluble solids (°Brix) were reported by Van de Velde et al. (2019) for whole strawberries cv. ‘San Andrea’. On the contrary, Bovi et al. (2018b) reported higher pH values and lower soluble solids (°Brix) for ‘Elsanta’ cultivar, showing the variability of these parameters between different strawberries, which directly influences fruit flavor. As can be seen, TSS values increased on day 4 of storage and then decreased to their initial value by the end of the storage period, while firmness remained constant (p-value=0.8692). These results are in accordance with Zhang et al. (2024), who also found no significant change in TSS content or firmness during the storage period of packaged strawberries, attributing these findings to the effectiveness of EMAP in reducing the respiration rate and slowing the consumption of organic substrates and inhibiting water loss. Surface color and firmness are important parameters in RTE fruit as they influence consumer acceptability and market value (Wang et al., 2018; Yu et al., 2024). In our study, significant changes were observed for C.I. between day 0 and the end of storage time (p-value < 0.05). C.I. was higher for day 7 and day 14 with respect to day 0, indicating more intense red coloration over time.
Initial values for TSS, firmness, and C.I. index were comparable to those found in the literature by Pedrozo et al. (2024) for the same cultivar at different harvest dates (June, August, and September).
3.3.2 Microbiological evolution
Microbial counts are a relevant quality parameter in ready-to-eat fruit and vegetables, as they can impact both safety and shelf-life. Microbial loads for total mesophilic (TMC), enterobacteria (ENT), mold (MC), and yeast (YC) in fresh-cut strawberries before and after disinfection treatment and throughout the storage period are shown in Table 2.
Microbial counts for unprocessed strawberries and TMC, ENT, MC, and YC evolution throughout storage in MAP conditions at 4 °C.
After the disinfection step, microbial counts were reduced by around 1-2 log CFU g-1, in accordance with Méndez-Galarraga et al. (2019), who used a spray washing disinfection with peracetic acid for the decontamination process. All counts obtained are below the limits for ready-to-eat fruit and vegetables and remained constant throughout the evaluated storage period (Centre for Food Safety, 2014). According to Allende et al. (2007), bacterial growth was not critical in strawberry spoilage, and remained low (2-4 log CFU g-1) during storage at 2 °C for 12 d under air MAP atmospheres. However, this might depend on local growing, initial counts, and processing/storage conditions.
3.3.3 Nutritional and chemical quality of strawberries: total phenolic content (TPC), total antioxidant capacity (TAC), vitamin C, and anthocyanins
The evolution of antioxidant-related compounds during the storage of strawberries under MAP at 4 °C throughout 14 d is shown in Figure 4.

Effect of MAP storage on the chemical quality of fresh-cut strawberries. (A) vitamin C content; (B) ellagic acid and catechin content; TPC and TAC (C); and (D) anthocyanin content (pelargonidin- and cyanidin-chloride).
Vitamin C, ascorbic acid (AA), and dehydroascorbic acid (DHA) profiles are shown in Figure 4A. Vitamin C and AA exhibited a similar trend during storage, with increasing levels from day 0 to day 4, followed by fluctuations until day 14, but maintaining overall values higher than the initial levels. On the other hand, DHA remained at much lower concentrations throughout storage, showing minor variations and a slight increase toward the end of the storage period. On the contrary, other studies reported no variations in vitamin C content or AA during 7 d of storage for fresh-cut ‘Camarosa’ variety at 2 °C (Méndez-Galarraga et al., 2019), or whole ‘Arabella’ cultivar during 11 d of storage at 5 °C (Li et al., 2022). In agreement with our results, Zhang et al. (2024) reported a rising trend in AA in both control and packed strawberries (cv. ‘Hongyan’) during 15 d of storage at 5 °C and associated this increase with the synthesis of ascorbic acid from D-galacturonic acid, which is released from cell wall pectin, or from D-glucose present in strawberries. Initial fluctuation can be associated with abiotic stress linked to processing steps, which has been reported to induce defense mechanisms (Lei et al., 2022). Additionally, the interconversion between ascorbic acid (AA) and dehydroascorbic acid (DHA), as well as oxidative stress responses during storage under MAP conditions, may contribute to temporary increases or decreases in measured vitamin C levels. These types of fluctuations are not uncommon in strawberries; previous studies have shown that AA are highly sensitive to environmental factors such as storage temperature and relative humidity, showing different trends among cultivars and postharvest storage conditions (Shin et al., 2007).
The initial content of vitamin C observed for the ‘INIA Ágata’ cultivar is in accordance with previously reported values by Pedrozo et al. (2023) and was higher than values reported for the ‘San Andreas’ cultivar according to Van de Velde et al. (2019). Previous studies have reported considerable variability in vitamin C content among strawberry cultivars. For example, Silva Pinto et al. (2008) reported values ranging from 6.5 to 11.2 mg g-1 among seven cultivars grown under the same conditions. Based on these comparisons, ‘INIA Ágata’ appears to be a cultivar with relatively high vitamin C content.
As previously mentioned, strawberries stand out for their nutritional composition, with ascorbic acid, anthocyanins, and phenolic compounds being the major contributors to the non-enzymatic antioxidant system in strawberries (Ignat et al., 2011; Lee et al., 2022). Standards of catechin, quercetin, procyanidin B2, cinnamic acid, ellagic acid, and anthocyanins (pelargonidin- and cyanidin-chloride) were used for a preliminary screening with hydrolyzed strawberry extracts. No matches were found for quercetin, procyanidin B2, and cinnamic acid, probably due to differences in the extracts resulting from the acid hydrolysis or the low levels of these compounds. However, these phenolic compounds have been reported in different strawberry cultivars (Tarola et al., 2013; Van de Velde et al., 2016; Van de Velde et al., 2019). It is well known that the chemical composition of strawberries varies significantly with genotype, agricultural practices, environment, and maturity (Aaby et al., 2007; Silva Pinto et al., 2008). Individual phenolic compounds detected in strawberry extracts are presented in Figures 4B and 4D. Catechin and ellagic acid remained relatively stable during storage, with no statistically significant differences between sampling days (p > 0.05) (Figure 4B). Similarly, pelargonidin chloride, the main anthocyanin in strawberries, did not show significant variations during the storage period. In contrast, cyanidin chloride showed a gradual decrease, reaching approximately 50% of its initial value by day 14 (Figure 4D). These results are in agreement with Van de Velde et al. (2019), who reported that cyanidin-3-O-glucoside was the most affected anthocyanin during the storage of the ‘San Andreas’ cultivar at 5 °C in 70 kPa O2 + 20 kPa CO2 and 90 kPa O2 + 10 kPa CO2 atmospheres, with a retention of 57% during 20 d.
Average concentrations of ellagic acid, catechin, and pelargonidin were (0.87 ± 0.12), (2.03 ± 0.18), and (3.91 ± 0.67) mg g-1 DW, respectively. Pelargonidin represents approximately 98% of total anthocyanin content; this is consistent with previous reports indicating that pelargonidin derivatives are the predominant anthocyanins in strawberries (Silva Pinto et al., 2008; Van de Velde et al., 2019).
Anthocyanin concentrations observed in this study fall within the range reported by Aaby et al. (2012), between 0.85 and 6.4 mg g-1 DW, with averages of 3.5 mg g-1 DW when evaluating 27 strawberry cultivars. Moreover, these results are consistent with previous reports for this cultivar (Pedrozo et al., 2024).
For catechin content, Silva Pinto et al. (2008) reported a concentration average of 0.45 mg g-1 DW, values were below those we found in our work. Meanwhile, ellagic acid content reported by Aaby et al. (2012) was 0.2 to 0.9 mg 100 FW for free ellagic acid, and from 0.1 to 1.8 mg 100 g FW for ellagic acid glycosides. Our results were higher than those reported, possibly due to differences among varieties, processing, and environmental conditions, agricultural practices, as well as the hydrolysis process performed for the HPLC measurement.
Anthocyanins are the main phenolic compounds responsible for the red coloration of strawberries and play a key role in the development of peel and flesh color during ripening. However, their evolution during postharvest storage is not consistent and has been reported to depend strongly on cultivar, storage temperature, and environmental conditions. In some cases, anthocyanin content may increase due to continued metabolic activity, while in others it remains stable or decreases. It is reported that cyanidin-3-glucoside is responsible for the red color and pelargonidin-3-glucoside is responsible for the orange-brown color in strawberries (Nunes et al., 2006). Therefore, variations in the ratio between these compounds, as well as their total concentration, can significantly influence the perceived color intensity and tonality. On the other hand, the stability is strongly influenced by pH, as these compounds exist in a dynamic equilibrium between quinonoidal base, the red-colored flavylium cation, the colorless pseudobase (carbitol), and the chalcones structured. Changes in pH can shift this equilibrium and affect both anthocyanin stability and color expression. In this context, atmospheres enriched in CO2 may affect anthocyanin content and color, causing tissue pH to increase and promoting the conversion of anthocyanins toward colorless forms (Odriozola-Serrano et al., 2009; Van de Velde et al., 2019). According to Pedrozo et al. (2024), ‘INIA Ágata’ was the most reddish cultivar when compared to other genotypes, although no differences in total anthocyanins were found.
This variability has also been associated with differences in the behavior of other phenolic compounds during storage (Nunes et al., 2006; Shin et al., 2007). Zhang et al. (2024) observed an increasing trend in anthocyanin content throughout storage in both control and packed strawberries (cv. ‘Hongyan’) during 15 d of storage at 5 °C. They attributed this increase to the continued synthesis of anthocyanins via flavonoid and anthocyanin pathways after harvest. In contrast, Van de Velde et al. (2013) reported a reduction of total anthocyanin content during the storage of whole, halved, and quartered strawberries cv. ‘Camarosa’ at 2, 6, and 13 °C for 15 d in passive modified atmosphere.
In the present study, the ‘INIA Ágata’ cultivar maintained relatively stable total anthocyanin content during storage, largely dominated by pelargonidin, the major anthocyanin, which did not exhibit significant variation. However, the changes observed in color at the end of storage (14 d) could be associated with variations in cyanidin derivatives. The decrease in this compound toward the end of storage (14 d) may explain the change in red color intensity (C.I.), despite the overall stability of total anthocyanin content. These findings suggest that both initial anthocyanin levels and their evolution during cold storage could differ between different cultivars. Identifying these differences is essential for selecting cultivars that are more suitable for ready-to-eat products, as some varieties will better preserve their nutritional value throughout cold storage.
The evolution of total phenolic content (TPC) and total antioxidant capacity (TAC) is presented in Figure 4C. TPC remained stable during storage, with a slight decrease at the end of storage (day 14). Yang et al. (2020) reported an increase during the first days before declining toward initial levels at the end of storage for phenolic content of ‘Akihime’ strawberries stored at 0 °C for 10 d in air. In contrast, Zhang et al. (2024) reported a continuous increase in phenolic content during storage of ‘Hongyan’ strawberries under passive modified atmosphere at 5 °C. These differences highlight the influence of cultivar and storage conditions on phenolic metabolism during postharvest storage.
Zhang et al. (2024) reported initial phenolic content values of 5.60 mg g-1 DW for the ‘Hongyan’ cultivar. Meanwhile, for ‘Camarosa’ or ‘San Andreas’ varieties, the phenolic content reported was 10.19 and 9.6 mg g-1 DW, respectively (Van de Velde et al., 2016, 2019). All values reported in the literature were transformed assuming 90% of water content (Silva Pinto et al., 2008).
TAC content measured as ABTS assay remained constant throughout storage, with an average value of (166.4 ± 7.1) µmol g-1 DW. As was mentioned, ascorbic acid, anthocyanins, and phenolic compounds are the major contributors to the non-enzymatic antioxidant system in strawberries (Ignat et al., 2011; Lee et al., 2022). The stability of TAC despite variations in vitamin C may be explained by the contribution of phenolic compounds and anthocyanins that remained stable during storage to the antioxidant system of strawberries.
3.3.4 Sensory evaluation
Sensory quality declined significantly throughout storage time (p-value < 0.05). Visual appearance showed a significant decrease with storage time after day 10 of storage. Meanwhile, browning, softening, and fungal growth showed a significant increase throughout the evaluated storage period. Table 3 shows the sensory attributes’ score evolution throughout storage time.
According to Paulsen et al. (2021), visual appearance, brightness, and browning exhibit the most significant changes during strawberry storage. In the present study, even though a different cultivar and packaging condition were used, similar results were obtained. Visual appearance showed a significant decline after day 10, approaching its lowest values by day 14, which reflects a pronounced reduction in perceived freshness toward the end of storage.
In contrast, browning scores showed an increasing trend throughout the storage period, indicating that some visual darkening was perceived. Visual perception of strawberry freshness has been linked with the distribution of luminance values in the fruit surface in different storage conditions, with skewness being a key indicator of asymmetries linked with surface dehydration (Takemoto et al., 2022). In agreement with the sensory observations, instrumental color measurements show a significantly more intense red coloration towards the end of storage, which may be attributed to enzymatic browning reactions occurring during storage. These sensory observations should be interpreted as indicative trends supporting the evolution of physicochemical measurements performed on the strawberry during storage conditions.
Limitations of the present sensory evaluation should be acknowledged: due to the use of a semi-trained panel with a reduced number of assessors, only intuitive and global attributes were considered. While the results allowed the identification of trends in the evolution of visible quality attributes during storage, the sensory analysis was not intended to provide a comprehensive sensory characterization. Future studies should incorporate methodologies specifically designed for semi-trained or consumer panels to more accurately capture the evolution of sensory attributes.
3.3.5 Integrated discussion of experimental data
Principal Component Analysis (PCA) was used to explore the relationships among quality attributes, antioxidant compounds, and deterioration indicators during strawberry storage (Figure 5). The first two principal components (PC1 and PC2) explained 59% and 25% of the total variability, respectively (total variance explained: 84%). PC1, which captured most of the variance, was mainly associated with browning, softening, and fungal growth on the positive side, while attributes such as visual appearance, TSS, ellagic acid, cyanidin, catechin, TPC, and TAC were negatively correlated (Figure 5).

Principal component analysis (PCA): biplot showing the relationship among all physicochemical and sensory parameters measured during the storage of strawberry under MAP at 4 °C.
This pattern suggests that samples positioned towards positive PC1 are characterized by lower quality parameters, describing a deterioration gradient, where fungal growth, softening, and browning were associated with later stages, while antioxidant compounds such as TAC, TPC, catechin, and cyanidin were associated with the initial quality of the fruit. These results indicate that the decline in antioxidant metabolites is closely related to the development of physiological deterioration during storage. The relative contribution of the evaluated variables to the first principal component (PC1) and the second component (PC2) is represented in Figure S1 (Supplementary Material), indicating the parameters that most strongly influence the character of samples along the main variability axis.
The characteristic model showed good agreement with experimental data under both short and long-term storage scenarios. The uncompetitive Michaelis-Menten (with oxidative term for CO2 production) model provided the best fit for the O2 and CO2 dynamics in short storage times. For longer storage times, an equilibrium modified atmosphere (EMAP) was reached from day 3. In these conditions, the oxidative model was unable to accurately predict the CO2 levels reached during storage, whereas the model with total CO2 production offered a better estimation of its concentration. Storage conditions obtained in MAP at 4 °C allowed the maintenance of the physicochemical and microbiological quality of minimally processed strawberries throughout 14 days. Regarding product quality, no significant changes were observed in pH, total soluble solids, or instrumental firmness. An increase in C.I. at the end of storage was associated with the development of a darker red coloration of the fruit, which is correlated with sensory appreciation: higher browning, softening, and fungal growth scores, and lower visual appearance. Microbiological counts remained below safety thresholds, and concentrations of bioactive compounds such as anthocyanins, ellagic acid, catechin, vitamin C, and total phenolics were preserved over time. Visual appearance reached its lowest scores by day 14, indicating a reduction in the perception of freshness at the end of storage (Paulsen et al., 2021).
Based on our findings, the ‘INIA Ágata’ strawberry cultivar stands out as a rich natural source of vitamin C and bioactive compounds. Ellagic acid, catechin, and pelargonidin chloride remained stable, with average concentrations of (0.87 ± 0.12), (2.03 ± 0.18), and (3.91 ± 0.67) mg g-1 DW, respectively. Among the anthocyanins analyzed, pelargonidin was confirmed as the predominant anthocyanin, accounting for approximately 98% of the total anthocyanin content in this cultivar. Cyanidin showed a significant decrease at the end of storage, reaching by day 14 to 50% of its initial concentration. The stability of pelargonidin throughout storage contributed to maintaining the overall anthocyanin levels, making it a promising cultivar for minimally processed products with potential for commercial distribution.
4 Conclusion
This study combined respiration modeling with physicochemical, microbiological, nutritional, and sensory analyses to evaluate the suitability of the ‘INIA Ágata’ strawberry cultivar as a ready-to-eat (RTE) fruit stored under modified atmosphere packaging (MAP). The respiration modeling approach proved effective for describing gas evolution within the package. The uncompetitive Michaelis–Menten model incorporating an oxidative term provided the best fit for short storage periods. Meanwhile, the model considering total CO2 production provided more accurate predictions of CO2 accumulation under equilibrium modified atmosphere conditions (EMAP). From a product quality perspective, MAP storage at 4 °C allowed the preservation of microbiological safety and key physicochemical attributes throughout 14 days. Bioactive compounds, including vitamin C, phenolic compounds, and anthocyanins, remained relatively stable during storage, highlighting the nutritional value of this cultivar. In contrast, sensory attributes associated with visual quality gradually deteriorated, indicating that, although biochemical and microbiological quality can be preserved for longer periods under MAP conditions, visual freshness remains a limiting factor. Overall, the results demonstrate that the ‘INIA Ágata’ cultivar shows good potential for minimally processed applications and that integrating respiration models with quality indicators provides a useful framework for designing MAP systems that maintain product quality and reduce postharvest losses along the supply chain.
Data Availability Statement
All data generated or analyzed in this study are included in this published article.
Supplementary Material
Supplementary material accompanies this paper.
Figure S1.
This material is available as part of the online article from https://doi.org/10.1590/1981-6723.1402025
-
Cite as:
Irazoqui, M., Barrios, S., & Lema, P. (2026). Respiration modelling and aptitude of ‘INIA Ágata’ strawberries as a ready-to-eat fruit under MAP conditions. Brazilian Journal of Food Technology, 29, e2025140. https://doi.org/10.1590/1981-6723.1402025
-
Funding:
Comisión Sectorial de Investigación Científica (CSIC, Universidad de la República).
References
-
3M. Petrifilm. (2017). Interpretation Guide USA: 3M. Retrieved in 2025, March 15, from https://static1.squarespace.com/static/5c930aceaf4683e69e2cd577/t/6250755c53c8ce42f94ec3b3/1649440093439/3M+SPC+Interpretation+Guide.pdf
» https://static1.squarespace.com/static/5c930aceaf4683e69e2cd577/t/6250755c53c8ce42f94ec3b3/1649440093439/3M+SPC+Interpretation+Guide.pdf -
Aaby, K., Ekeberg, D., & Skrede, G. (2007). Characterization of phenolic compounds in strawberry (Fragaria x ananassa) fruits by different HPLC detectors and contribution of individual compounds to total antioxidant capacity. Journal of Agricultural and Food Chemistry, 55(11), 4395-4406. Pmid:17472391. https://doi.org/10.1021/jf0702592
» https://doi.org/10.1021/jf0702592 -
Aaby, K., Mazur, S., Nes, A., & Skrede, G. (2012). Phenolic compounds in strawberry (Fragaria x ananassa Duch.) fruits: composition in 27 cultivars and changes during ripening. Food Chemistry, 132(1), 86-97. Pmid:26434267. https://doi.org/10.1016/j.foodchem.2011.10.037
» https://doi.org/10.1016/j.foodchem.2011.10.037 -
Allende, A., Marín, A., Buendía, B., Tomás-Barberán, F., & Gil, M. I. (2007). Impact of combined postharvest treatments (UV-C light, gaseous O3, superatmospheric O2 and high CO2) on health promoting compounds and shelf-life of strawberries. Postharvest Biology and Technology, 46(3), 201-211. https://doi.org/10.1016/j.postharvbio.2007.05.007
» https://doi.org/10.1016/j.postharvbio.2007.05.007 -
Badillo, G. M., & Segura-Ponce, L. A. (2020). Classic and reaction-diffusion models used in Modified Atmosphere Packaging (MAP) of fruit and vegetables. Food Engineering Reviews, 12(2), 209-228. https://doi.org/10.1007/s12393-020-09214-3
» https://doi.org/10.1007/s12393-020-09214-3 -
Barrios, S., Lema, P., & Lareo, C. (2014). Modeling respiration rate of strawberry (cv. San Andreas) for modified atmosphere packaging design. International Journal of Food Properties, 17(9), 2039-2051. https://doi.org/10.1080/10942912.2013.784328
» https://doi.org/10.1080/10942912.2013.784328 -
Bovi, G. G., Caleb, O. J., Ilte, K., Rauh, C., & Mahajan, P. V. (2018a). Impact of modified atmosphere and humidity packaging on the quality, off-odour development and volatiles of ‘Elsanta’ strawberries. Food Packaging and Shelf Life, 16, 204-210. https://doi.org/10.1016/j.fpsl.2018.04.002
» https://doi.org/10.1016/j.fpsl.2018.04.002 -
Bovi, G. G., Rux, G., Caleb, O. J., Herppich, W. B., Linke, M., Rauh, C., & Mahajan, P. V. (2018b). Measurement and modelling of transpiration losses in packaged and unpackaged strawberries. Biosystems Engineering, 174, 1-9. https://doi.org/10.1016/j.biosystemseng.2018.06.012
» https://doi.org/10.1016/j.biosystemseng.2018.06.012 -
Centre for Food Safety – CFS. (2014). Microbiological guidelines for food. For ready-to-eat food in general and specific food items Hong Kong, China: CFS. Retrieved in 2025, March 15, from https://www.cfs.gov.hk/english/food_leg/files/food_leg_Microbiological_Guidelines_for_Food_e.pdf
» https://www.cfs.gov.hk/english/food_leg/files/food_leg_Microbiological_Guidelines_for_Food_e.pdf - Geysen, S., Verlinden, B. E., Conesa, A., & Leuven, K. U. (2005). Modelling respiration of strawberry (cv. ‘Elsanta’) as a function of temperature, carbon dioxide, low and superatmospheric oxygen concentrations. Respiration, 12-16.
-
Giampieri, F., Tulipani, S., Alvarez-Suarez, J. M., Quiles, J. L., Mezzetti, B., & Battino, M. (2012). The strawberry: Composition, nutritional quality, and impact on human health. Nutrition, 28(1), 9-19. https://doi.org/10.1016/j.nut.2011.08.009
» https://doi.org/10.1016/j.nut.2011.08.009 -
Hertog, M. L. A. T. M., Boerrigter, H. A. M., Van Den Boogaard, G. J. P. M., Tijskens, L. M. M., & Van Schaik, A. C. R. (1999). Predicting keeping quality of strawberries (cv. ‘Elsanta’) packed under modified atmospheres: an integrated model approach. Postharvest Biology and Technology, 15(1), 1-12. https://doi.org/10.1016/S0925-5214(98)00061-1
» https://doi.org/10.1016/S0925-5214(98)00061-1 -
Ignat, I., Volf, I., & Popa, V. I. (2011). A critical review of methods for haracterization of polyphenolic compounds in fruits and vegetables. Food Chemistry, 126(4), 1821-1835. Pmid:25213963. https://doi.org/10.1016/j.foodchem.2010.12.026
» https://doi.org/10.1016/j.foodchem.2010.12.026 -
Irazoqui, M., Barrios, S., & Lema, P. (2025). Evaluation of alternative models for respiration rate of ready-to-eat strawberry (cv. ‘Ágata’). Biology and Life Sciences Forum, 40(1), 54. https://doi.org/10.3390/blsf2024040054
» https://doi.org/10.3390/blsf2024040054 -
Irazoqui, M., Colazzo, M., Fender, E., Budelli, E., Barrios, S., Pérez, N., & Lema, P. (2024). Combined peracetic acid: power ultrasound disinfection process enhances bioactive compounds and preserves quality attributes of fresh-cut lettuce (cv. Vera). Discover Food, 4(1), 14. https://doi.org/10.1007/s44187-024-00081-z
» https://doi.org/10.1007/s44187-024-00081-z - Lado, J., Moltini, A. I., Salgado, S., Ruiz, S., Ares, G., & Vicente, E. (2023). La calidad sensorial de las variedades de frutilla creadas en Uruguay :¿Qué opinan los consumidores? Revista INIA, 73, 56-59.
-
Lee, C., Lee, J., & Lee, J. (2022). Relationship of fruit color and anthocyanin content with related gene expression differ in strawberry cultivars during shelf life. Scientia Horticulturae, 301, 111109. https://doi.org/10.1016/j.scienta.2022.111109
» https://doi.org/10.1016/j.scienta.2022.111109 -
Lei, T., Qian, J., & Yin, C. (2022). Equilibrium modified atmosphere packaging on postharvest quality and antioxidant activity of strawberry. International Journal of Food Science & Technology, 57(11), 7125-7134. https://doi.org/10.1111/ijfs.16052
» https://doi.org/10.1111/ijfs.16052 -
Li, C., & Kader, A. A. (1989). Residual effects of controlled atmospheres on postharvest physiology and quality of strawberries. Journal of the American Society for Horticultural Science, 114(4), 629-634. https://doi.org/10.21273/JASHS.114.4.629
» https://doi.org/10.21273/JASHS.114.4.629 -
Li, H., Yin, Y., Affandi, F. Y., Zhong, C., Schouten, R. E., & Woltering, E. J. (2022). High CO2 reduces spoilage caused by botrytis cinerea in strawberry without impairing fruit quality. Frontiers in Plant Science, 13, 842317. Pmid:35574136. https://doi.org/10.3389/fpls.2022.842317
» https://doi.org/10.3389/fpls.2022.842317 -
López Camelo, A. F., & Gómez, P. A. (2004). Comparison of color indexes for tomato ripening. Horticultura Brasileira, 22(3), 534-537. https://doi.org/10.1590/S0102-05362004000300006
» https://doi.org/.org/10.1590/S0102-05362004000300006 -
Matar, C., Guillard, V., Gauche, K., Costa, S., Gontard, N., Guilbert, S., & Gaucel, S. (2020). Consumer behaviour in the prediction of postharvest losses reduction for fresh strawberries packed in modified atmosphere packaging. Postharvest Biology and Technology, 163, 111119. https://doi.org/10.1016/j.postharvbio.2020.111119
» https://doi.org/10.1016/j.postharvbio.2020.111119 -
Méndez-Galarraga, M. P., Salsi, M. S., Piagentini, A. M., & Pirovani, M. E. (2019). Spray washing disinfection with peracetic acid in the processing of fresh-cut strawberries: An alternative for dipping techniques. International Journal of Fruit Science, 19(3), 258-275. https://doi.org/10.1080/15538362.2018.1502722
» https://doi.org/10.1080/15538362.2018.1502722 -
Mezzetti, B., Balducci, F., Capocasa, F., Zhong, C. F., Cappelletti, R., Di Vittori, L., Mazzoni, L., Giampieri, F., & Battino, M. (2016). Breeding strawberry for higher phytochemicals content and claim it: Is it possible? International Journal of Fruit Science, 16(sup1), 194-206. https://doi.org/10.1080/15538362.2016.1250695
» https://doi.org/10.1080/15538362.2016.1250695 -
Neogen Corporation. (2023a). Interpretation Guide USA: Neogen Corporation. Retrieved in 2025, March 15, from https://media.neogen.com/m/288792d8b4176ddc/Petrifilm-Enterobacteriaceae-EB-Count-Plate_Interpretation_Guide_en-US_FS00581.pdf
» https://media.neogen.com/m/288792d8b4176ddc/Petrifilm-Enterobacteriaceae-EB-Count-Plate_Interpretation_Guide_en-US_FS00581.pdf -
Neogen Corporation. (2023b). Interpretation Guide USA: Neogen Corporation. Retrieved in 2025, March 15, from https://media.neogen.com/m/288792d8b4176ddc/Petrifilm-Rapid-Yeast-and-Mold-RYM-%20Count-Plate-Interpretation-Guide_en-US_FS00588.pdf
» https://media.neogen.com/m/288792d8b4176ddc/Petrifilm-Rapid-Yeast-and-Mold-RYM-%20Count-Plate-Interpretation-Guide_en-US_FS00588.pdf -
Nunes, M. C. N., Brecht, J. K., Morais, A. M. M. B., & Sargent, S. A. (2006). Physicochemical changes during strawberry development in the field compared with those that occur in harvested fruit during storage. Journal of the Science of Food and Agriculture, 86(2), 180-190. https://doi.org/10.1002/jsfa.2314
» https://doi.org/10.1002/jsfa.2314 -
Odriozola-Serrano, I., Soliva-Fortuny, R., & Martín-Belloso, O. (2009). Influence of storage temperature on the kinetics of the changes in anthocyanins, vitamin C, and antioxidant capacity in fresh-cut strawberries stored under high-oxygen atmospheres. Journal of Food Science, 74(2), C184-C191. PMid:19323734. https://doi.org/10.1111/j.1750-3841.2009.01075.x
» https://doi.org/10.1111/j.1750-3841.2009.01075.x -
Parvez, S., & Wani, I. A. (2018). Postharvest biology and technology of strawberry. In S. Mir, M. Shah, & M. Mir (Eds.),Postharvest biology and technology of temperate fruits (pp. 331-348). Cham: Springer. https://doi.org/ 10.1007/978-3-319-76843-4_14
» https://doi.org/ 10.1007/978-3-319-76843-4_14 -
Paulsen, E., Barrios, S., & Lema, P. (2021). Production of packaged ready – to – eat whole strawberries (cv. San Andreas): packaging conditions for shelf-life extension. Food Packaging and Shelf Life, 29, 100696. https://doi.org/10.1016/j.fpsl.2021.100696
» https://doi.org/10.1016/j.fpsl.2021.100696 -
Pedrozo, P., Lado, B., Moltini, A. I., Vicente, E., & Lado, J. (2024). Exploration of strawberry fruit quality during harvest season under a semi-forcing culture with plants nursed without chilling. Plants, 13(21), 3052. PMid:39519971. https://doi.org/10.3390/plants13213052
» https://doi.org/10.3390/plants13213052 -
Pedrozo, P., Vicente, E., Moltini, A. I., Ibáñez, F., Lado, B., Fariña, L., Ares, G., & Lado, J. (2023). Strawberry fruit quality: impacts of the harvest date with a breeding perspective. JSFA reports, 3(11), 597-608. https://doi.org/10.1002/jsf2.163
» https://doi.org/10.1002/jsf2.163 -
Rashvand, M., Matera, A., Altieri, G., Genovese, F., Fadiji, T., Linus Opara, U., Mohamadifar, M. A., Feyissa, A. H., & Carlo Di Renzo, G. (2023). Recent advances in the potential of modeling and simulation to assess the performance of modified atmosphere packaging (MAP) systems for the fresh agricultural product: Challenges and development. Trends in Food Science and Technology, 136, 48-63. https://doi.org/10.1016/j.tifs.2023.04.012
» https://doi.org/10.1016/j.tifs.2023.04.012 -
Re, R., Pellegrini, N., Proteggente, A., Pannala, A., Yang, M., & Rice-Evans, C. (1999). Antioxidant activity applying an improved ABTS radical cation decolorization assay. Free Radical Biology & Medicine, 26(9–10), 1231-1237. PMid:10381194. https://doi.org/10.1016/S0891-5849(98)00315-3
» https://doi.org/10.1016/S0891-5849(98)00315-3 -
Shin, Y., Liu, R. H., Nock, J. F., Holliday, D., & Watkins, C. B. (2007). Temperature and relative humidity effects on quality, total ascorbic acid, phenolics and flavonoid concentrations, and antioxidant activity of strawberry. Postharvest Biology and Technology, 45(3), 349-357. https://doi.org/10.1016/j.postharvbio.2007.03.007
» https://doi.org/10.1016/j.postharvbio.2007.03.007 -
Silva Pinto, M., Lajolo, F. M., & Genovese, M. I. (2008). Bioactive compounds and quantification of total ellagic acid in strawberries (Fragaria x ananassa Duch.). Food Chemistry, 107(4), 1629-1635. https://doi.org/10.1016/j.foodchem.2007.10.038
» https://doi.org/10.1016/j.foodchem.2007.10.038 -
Singleton, V. L., Orthofer, R., & Lamuela-Raventós, R. M. (1999). Analysis of total phenols and other oxidation substrates and antioxidants by means of folin-ciocalteu reagent. Methods in Enzymology, 299(14), 561. https://doi.org/10.1007/BF02530903
» https://doi.org/10.1007/BF02530903 -
Takemoto, R., Koyama, K., Watanabe, T., Koseki, S., & Nakamura, N. (2022). Mathematical model for analyzing the effect of storage conditions on the visually perceived freshness of strawberries via surface luminance distribution. Food Packaging and Shelf Life, 34, 100965. https://doi.org/10.1016/j.fpsl.2022.100965
» https://doi.org/10.1016/j.fpsl.2022.100965 -
Talasila, P. C., Chau, K. V., & Brecht, J. K. (1992). Effects of gas concentrations and temperature on O2 consumption of strawberries. Transactions of the ASAE. American Society of Agricultural Engineers, 35(1), 221-224. https://doi.org/10.13031/2013.28591
» https://doi.org/10.13031/2013.28591 -
Tarola, A. M., Van de Velde, F., Salvagni, L., & Preti, R. (2013). Determination of phenolic compounds in strawberries (Fragaria ananassa Duch) by high performance liquid chromatography with diode array detection. Food Analytical Methods, 6(1), 227-237. https://doi.org/10.1007/s12161-012-9431-5
» https://doi.org/10.1007/s12161-012-9431-5 -
Unidad de Agroalimentaria Metropolitana – UAM, & Ministerio de Ganadería, Agricultura y Pesca – MGAP. (2024). Anuario Estadístico UAM 2024 Observatorio Granjero. Retrieved in 2025, March 15, from https://uam.com.uy/wp-content/uploads/2025/02/Anuario-UAM-2024-Observatorio-Granjero.pdf
» https://uam.com.uy/wp-content/uploads/2025/02/Anuario-UAM-2024-Observatorio-Granjero.pdf -
United Nations - UN. (2024). UNdata Retrieved in 2024, March 15, from http://data.un.org
» http://data.un.org -
Van de Velde, F., Grace, M. H., Pirovani, M. É., & Lila, M. A. (2016). Impact of a new postharvest disinfection method based on peracetic acid fogging on the phenolic profile of strawberries. Postharvest Biology and Technology, 117, 197-205. https://doi.org/10.1016/j.postharvbio.2016.03.005
» https://doi.org/10.1016/j.postharvbio.2016.03.005 -
Van de Velde, F., Méndez-Galarraga, M. P., Grace, M. H., Fenoglio, C., Lila, M. A., & Pirovani, M. É. (2019). Changes due to high oxygen and high carbon dioxide atmospheres on the general quality and the polyphenolic profile of strawberries. Postharvest Biology and Technology, 148, 49-57. https://doi.org/10.1016/j.postharvbio.2018.10.015
» https://doi.org/10.1016/j.postharvbio.2018.10.015 -
Van de Velde, F., Piagentini, A. M., Güemes, D. R., & Pirovani, M. E. (2013). Modelling changes in anthocyanins, total vitamin C and colour as a consequence of peracetic acid washing disinfection of two cultivars of strawberries for fresh-cut processing. International Journal of Food Science & Technology, 48(5), 954-961. https://doi.org/10.1111/ijfs.12047
» https://doi.org/10.1111/ijfs.12047 -
Van de Velde, F., Pirovani, M. E., Cámara, M. S., Güemes, D. R., & del H. Bernardi, C. M. (2012). Optimization and validation of a UV-HPLC method for vitamin C determination in strawberries (Fragaria ananassa Duch.), using experimental designs. Food Analytical Methods, 5(5), 1097-1104. https://doi.org/10.1007/s12161-011-9347-5
» https://doi.org/10.1007/s12161-011-9347-5 -
Vicente, E., Giménez, G., Manzzioni, A., Vilaró, F., González, M., & Cabot, M. (2009). Strawberry breeding in Uruguay. Acta Horticulturae, 842, 411-414. https://doi.org/10.17660/ActaHortic.2009.842.80
» https://doi.org/10.17660/ActaHortic.2009.842.80 -
Wang, W., Hu, W., Ding, T., Ye, X., & Liu, D. (2018). Shelf-life prediction of strawberry at different temperatures during storage using kinetic analysis and model development. Journal of Food Processing and Preservation, 42(8), e13693. https://doi.org/10.1111/jfpp.13693
» https://doi.org/10.1111/jfpp.13693 -
Yang, M., Ban, Z., Luo, Z., Li, J., Lu, H., Li, D., Chen, C., & Li, L. (2020). Impact of elevated O2 and CO2 atmospheres on chemical attributes and quality of strawberry (Fragaria × ananassa Duch.) during storage. Food Chemistry, 307, 125550. PMid:31639575. https://doi.org/10.1016/j.foodchem.2019.125550
» https://doi.org/10.1016/j.foodchem.2019.125550 -
Yu, J., Wang, M., Li, Z., Tchuenbou-Magaia, F., Wani, A. A., Zhu, P., Fadiji, T., & Liu, Y. (2024). Preserving freshness: Innovations for fresh-eating fruit distribution and damage prevention – A review. Food Packaging and Shelf Life, 44, 101323. https://doi.org/10.1016/j.fpsl.2024.101323
» https://doi.org/10.1016/j.fpsl.2024.101323 -
Zhang, Y., Zhao, Y., Feng, J., Dong, H., Liao, W., Yang, X., Chen, S., & He, Q. (2024). Development of equilibrium modified atmosphere packaging (EMAP) for postharvest strawberries based on material modification of permeability and selectivity: Theoretical design, model validation, and application effects. Postharvest Biology and Technology, 211, 112799. https://doi.org/10.1016/j.postharvbio.2024.112799
» https://doi.org/10.1016/j.postharvbio.2024.112799
Edited by
-
Associate Editor:
Ivan Sestari.