
 Assessing genetic variability and trait associations in rice (Oryza sativa L.): a study on yield components and grain quality
Abstract
Globally, rice is a staple food, with a daily caloric intake of approximately 20%. The purpose of the present study was to identify the important morphological and quality parameters through genotypic and phenotypic association and path analysis in Oryza sativa L. The breeding material used in this experiment comprised 60 diverse genotypes obtained from the Department of Plant Breeding and Genetics, The Islamia University of Bahawalpur, Pakistan. The experiment was conducted using a Randomized Complete Block Design, with three replicates. Phenotypic data for the different morphological and quality traits were measured at maturity. The results of the analysis of variance showed that all parameters except a few showed significant differences among genotypes, indicating substantial genetic diversity. Correlation analysis revealed that most of the morphological and quality traits exhibited positive associations with each other, indicating that improvements in morphology and quality could be based on these positively associated traits. Path analysis showed that the amylose contents (AC), flag leaf length (FLL), grain length (GL), plant height (PH), number of grains per panicle (GP), grain width (GW), and panicle length (PL) exerted the most prominent positive direct effects yield, highlighting their importance as key selectin traits. In contrast traits traits such as thousand grain weight (TGW), flag leaf area (FLA), grain length into width ratio (L/W ratio), and number of total tillers per plant (TP) showed negative direct effect,Suggesting a complex relationship with yield. The results suggest that improving primarily morphological traits, particularly flag leaf length and width, and grain length, along with the key quality trait amylose contents, which are directly and indirectly linked with yield, could be effective and their selection will facilitate the development of high yield and high quality rice cultivars to meet future food demands.
Keywords:
genotypic; grain quality; path analysis; rice; yield
Resumo
Globalmente, o arroz é um alimento básico, com uma ingestão calórica diária de aproximadamente 20%. O objetivo do presente estudo foi identificar os parâmetros morfológicos e de qualidade importantes por meio de associação genotípica e fenotípica e análise de trilha em Oryza sativa L. O material de melhoramento utilizado neste experimento compreendeu 60 genótipos diversos obtidos do Departamento de Melhoramento de Plantas e Genética da Universidade Islâmica de Bahawalpur, Paquistão. O experimento foi conduzido utilizando um delineamento em blocos casualizados completos, com três repetições. Os dados fenotípicos para as diferentes características morfológicas e de qualidade foram medidos na maturidade. Os resultados da análise de variância mostraram que todos os parâmetros, exceto alguns, apresentaram diferenças significativas entre os genótipos, indicando diversidade genética substancial. A análise de correlação revelou que a maioria das características morfológicas e de qualidade exibiram associações positivas entre si, indicando que melhorias na morfologia e na qualidade poderiam ser baseadas nessas características positivamente associadas. A análise de caminhos mostrou que o teor de amilose (TA), o comprimento da folha bandeira (CF), o comprimento do grão (CG), a altura da planta (AP), o número de grãos por panícula (PG), a largura do grão (LG) e o comprimento da panícula (CP) exerceram os efeitos diretos positivos mais proeminentes sobre o rendimento, destacando sua importância como características-chave de seleção. Em contraste, características como peso de mil grãos (PMG), área da folha bandeira (AF), relação comprimento/largura do grão (relação C/L) e número total de perfilhos por planta (TP) mostraram efeito direto negativo, sugerindo uma relação complexa com o rendimento. Os resultados sugerem que a melhoria primária de características morfológicas, particularmente o comprimento e a largura da folha bandeira e o comprimento do grão, juntamente com a característica-chave de qualidade, o teor de amilose, que estão direta e indiretamente ligadas ao rendimento, pode ser eficaz e sua seleção facilitará o desenvolvimento de cultivares de arroz de alto rendimento e alta qualidade para atender às futuras demandas alimentares.
Palavras-chave:
genotípico; qualidade de grãos; análise de trilha; arroz; produtividade
1. Introduction
Rice (Oryza sativa L.) is the major cultivated rice species worldwide and represents the primary genetic resource for breeding program. The present study focuses exclusively on diverse Oryza sativa genotypes adapted to local agro-ecological conditions to evaluate variability in yield and grain quality traits. It globally considered as the most important staple food and a daily caloric source for approximately 20% of the world’s population (Cordero-Lara, 2020). Approximately 2 billion people in Asia depend on rice alone, which gives them a range of nutrients to meet their energy needs, such as 80% carbohydrates, 7-8% protein, 3% fat, and 3% fiber. Several types of rice are subjected to extensive research worldwide. Numerous studies in different countries have shown that different types of rice can effectively lower inflammation, diabetes, cancer, hyperlipidemia, and other diseases. Rice has fewer antioxidant molecules and lower antioxidant efficacy than other cereals. Therefore, rice can be used to prepare functional foods, medicines, food preservatives, and cosmetics. Rice has several health benefits and is a natural source of antioxidants (Chaudhari et al., 2018). The genus Oryza, belonging to the family Poaceae, comprises approximately 22 species and is predominantly a self-pollinating crop cultivated for its grain. Rice is a diploid cereal with a chromosome number of 2n = 24. Among the Oryza sativa complex, two cultivated species exist: Oryza sativa (Asian rice), which is cultivated worldwide, and Oryza glaberrima Steud. (African rice), which is primarily grown in West Africa (Vaughan et al., 2008).
Additionally, Oryza glaberrima exhibits tolerance to iron toxicity, soil acidity, and drought, and demonstrates strong competitiveness against weeds, suggesting that crosses between O. glaberrima and O. sativa could provide complementary traits for crop improvement (Brar and Singh, 2011). Breeding initiatives in the Philippines and West Africa have produced exceptional lines, including "NERICA" (Diagne et al., 2010). Research on creating resilient and productive rice cultivars has increased (Atwell et al., 2014), and traditional plant breeding techniques have led to improvements in O. sativa subspecies indica and japonica varieties. However, introgression of genes from other interspecific materials has also attracted attention. Response: This region contains remove these words and make sentence like this “Oryza glaberrima, an African rice species that was domesticated in Africa between 2000 and 3000 years ago, separate from O. sativa and Asian rice. Oryza glaberrima still has many characteristics that are unique to the harsh soil and climate of Africa, such as scarce water supplies, abiotic stress, pests, and diseases (Cubry et al., 2020).
Oryza sativa contains long, medium, short and round grains, which are preferred worldwide because they can be used as both a major food source and a cash crop and are an important crop in Pakistani agriculture. The second most important staple crop after wheat and is the second most important exportable crop, after cotton. Rice generates 2.4% of agricultural commodities and 0.5% of the GDP for duration of the years 2021-22. The rice-cultivated area grew by 6.1 percent to 3,537 thousand hectares from 3,335 thousand hectares in the previous year. Due to an increase in the area under the crop, which had higher domestic values and obtainability of inputs at funded rates, production increased by 10.7% to 9.323 million metric tons, up from 8.420 million metric tons in the previous year (Government of Pakistan 2022). The rice output is expected to reach 7.4 MMT in MY 2020/21 owing to high-yield forecasts. Rice exports are expected to remain stable at 4.4 MMT between May 2019/20 and 2020/2021.
Rice production is challenged by climate variability, and limited natural resources, all of which pose significant risks to diminishing rice yields. However, improving genetic potential remains a key strategy to enhance the productivity under existing field condtion. Rice yield is strongly influenced by various morphological, quality traits and both environmental and socioeconomic factors. Traditionally, rice is produced by raising nursery plants and transplanting them into flooded fields (Zulfiqar et al., 2021). Giving the declining of availability of arable land, increasing yield per unit area through the selection of superior genotypes is essential for sustainable production (Balmford et al., 2018). Only 0.6 percent of the world's rice is grown in Europe. China, India, and Indonesia are leading rice cultivators. Between 2022 and 2024, Asian countries consumed approximately 71.9 kg of rice per capita per year, whereas European nations consumed about 6.4 kilogram of rice per capita per year (OECD, 2025). Over half of Earth’s total area is composed of dry or semiarid regions. In the majority of emerging nations, these are the primary land resources.
As countries that include these types of land become more capable of meeting demands beyond conventional management methods, there is a growing demand for products and services from these arid and semi-arid regions. Notwithstanding these obstacles, there are some state-of-the-art, novel rice-based systems that have the potential to boost food security; boost rice production; and lower hunger, poverty, and malnutrition. For example, improved agronomic techniques, irrigation management, and cultivars could increase rice productivity. Direct seeding, weed control, and other methods can be used to reduce labor inputs and mechanization. Furthermore, cutting-edge and automated technologies and processes for milling, drying, and storage can improve product quality, reduce losses, and boost farmers' profits (Sandhu et al., 2021). Early growth of high-yielding cultivars will boost rice production, resource and input use efficiency, and profitability per unit area and per unit time. Water scarcity and restricted land access have made it difficult to increase rice production. Planting early maturing cultivars is, therefore, a tactic to address this problem (Ali et al., 2018).
The grain quality also has complex properties, including starch, protein, and lipid storage structures (Kakar et al., 2019). Several factors determine grain appearance, such as the grain length and width ratio, endosperm flawlessness, and cooking and eating superiority traits (measured as the alkali spreading value) (Mahender et al., 2016). In addition to the physical appearance of grain size, grain quality traits are known to affect cooking and nutritional and sensory characteristics (Cuevas et al., 2016; Wang et al., 2017). There are many components in the inheritance of rice grain quality traits. QTLs with significant and negligible effects control amylose content, gelatinization temperature, gel constancy, and protein content (Mahender et al., 2016). Plant height influences crop style, apical supremacy, biomass, mechanical reaping, and resilience to lodging and crowding. Internode elongation, which is controlled by genes involved in gibberellin and brassinosteroid production, or associated gesturing networks, determines plant height (Chen et al., 2021).
A certain amount of capital is allocated each year to research targeted at improving rice output and quality to meet the growing demand. Recent research on increasing rice production indicates that the increase in yield is currently declining and will soon stagnate. Plant breeders must examine and evaluate a significant number of germplasms to understand the connection between yield and its component traits before using it in planned future hybridization. In previewing the issues of climate change and the following factors and problems, the major objectives of this study were to study the genotypic and phenotypic associations among the different morphological characteristics in Oryza sativa L, to study the traits related to rice grain quality, and to identify path analysis for morphological and quality traits.
2. Materials and Methods
2.1. Experiment details and treatments
The breeding material used in this experiment consisted of 60 diverse rice genotypes collected from the germplasm resources of the Department of Plant Breeding and Genetics, Faculty of Agriculture and Environment,the Islamia University of Bahawalpur, Pakistan (Table 1). The panel comprised a mixture of advanced breeding lines, cultivated cultivars and pre released elite lines, representing a broad genetic base. The genotypes were deliberately selected to capture variation in yield potential and grain quality traits, including grain size, amylose contents and protein contents.
During 2023-2024 growing season, the field experiment was conducted in Randomized Complete Block Design (RCBD) with three replications at the experimental area of the Department of Plant Breeding and Genetics, Faculty of Agriculture and Environment, The Islamia university of Bahawalpur, Pakistan located at latitude 27.77 °N, Longitude 70.09 °E and at an elevation of 180 meters above sea level. The region has a semi arid climate and 2023-24 growing season was characterized by high temperature (32-35 °C, range 1.6 44.0 °C) and variable rainfall (annual: ~150-200 mm; range: 5-70 mm) during the growing season, particularly at the reproductive stage (Pakistan, 2023). These climatic data were obtained from the nearest meteorological station of Pakistan meteorological Department and no on site environmental measurements were recorded during the experimental period.
2.2. Research procedure
One-month-old nursery seedlings were transplanted to the puddle field according to the recommendations of Thakur et al. (2010). To maintain crop health, standard agronomic procedures and irrigation were modified and performed until the crop reached maturity. To prevent errors, the plants were tagged correctly before gathering the phenotypic data. Phenotypic data are important for studying the grain quality of different genotypes. The middle five plants of each genotype from each row and genotype were selected for morphological analyses. During the fourth week, seedlings were transplanted into properly constructed nursery beds. The plots were covered with a 2-3 cm layer of farmyard manure and a 5-7 cm layer of soil. The soil and farmyard manure were mixed to produce a homogeneous bed. A wetland preparation approach was used to prepare land. Cultivation was performed, and two planks were laid to obtain the necessary soil. An appropriate amount of decomposed farmyard manure (5 t ha-1) was spread once excess water was drained, levelled, and puddling was completed.
2.3. Observation and statistical analysis
During the study, the data of the morphological and quality traits were recorded at maturity. Plant height (PH) (cm) was measured with the help of meter road from the base to the tip of the flag leaf. Panicle length (PL) (cm) was measured as the distance from the panicle neck to the tip of the panicle, number of total tillers per plant (TP) were recorded following the method of (Huang et al., 2010), number of grains per panicle (GP) measured on main panicle of selected plants and then means was calculated, 1000 grains weight (TGW) (g) was recorded according to Huang et al. (2010). Fag leaf length (FLL) (cm), flag leaf width (FLW) (cm), flag leaf area (FLA) (cm2) were recorded following (Amin and Haque, 2009).
Grain quality traits included grain length (GL) (mm) and grain width (GW) (mm) and grain length into width ratio (L/W ratio), were measured on individual grains collected from five randomly selected plants and mean values were calculated (Won et al., 2002). In contrast amylose contents (AC) (Won et al., 2002) and Protein contents (PC) (Ghouri et al., 2022) were determined using bulked grain samples obtained from the same plants to ensure representative estimate and minimize plant to plant variation.
2.4. Statistical analysis
The mean of the traits was determined using the arithmetic mean, which has been used in various analyses. Analysis of variance was performed using Statistix 8.1. The significance level was set at P < 0.05. Phenotypic and genotypic correlations were calculated by the method described by Miller et al. (1958). Path analysis was used to examine the direct and indirect effects of the components of the traits under study, as illustrated by Dewey and Lu (1959) (Figure 1).
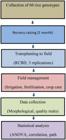
Schematic diagram of the experimental design and workflow of the rice genotypes evaluated under field condition.
3. Results
The analysis of variance revealed significant differences among the genotypes for all traits, with the exception of grain length, grain length to width ratio, and protein content (Table 2). The relationship of morphological traits with grain quality traits revealed significant association (Table 3). Plant height revealed significant correlation with protein content (PC) (0.38**), and grain length to width ratio (L/W ratio) (0.62**) at the genotypic level and (0.57**) and (0.34**) at phenotypic level. Panicle length exhibited a significant positive association GL (0.36**) and PC (0.46**) at genotypic level and at phenotypic level, it showed significant positive link with Protein contents. The number of total tillers per palnt was positively associated with L/W ratio (0.35**), (0.27*) and PC (0.36**), (0.28*) respectively. Number of grains per panicle at genotypic and phenotypic had significant positive relation with L/W ratio (0.44**) and (0.38*) respectively while significant negative with AC (0.38**) and (0.27*). Thousand grain weight exposed significant positive at both levels with GL (0.58**), (0.47**), GW (0.56**), (0.41**) and AC (0.33*) (0.30*) correspondently. FLL revealed significant positive relation at both level with L/W ratio (0.34**) and (0.29*) while negative phenotypic link with (GL) (0.29*) and FLW had positive genotypic and phenotypic link with GW (0.62**) and (0.53**) and at both levels it had negative association with grain length (-0.56**), (-0.35**) and L/W ratio (-0.44**), (-0.38**) Flag leaf area at genotypic and phenotypic levels showed significant positive association with GL (0.53**), (0.45**) and GW (0.38**), (0.29*) respectively while at only genotypic level, FLA exposed significant positive and negative link with L/W ratio (0.34**) and PC (-0.63**) respectively.
The relationship of quality traits with morphological traits at genotypic and phenotypic levels revealed significant association (Table 3). Grain length at genotypic level had significant positive relation with PL (0.36**), TGW (0.58**), FLA (0.53**) while at phenotypic level this traits had significant positive link with TGW (0.47**) and FLA (0.45**). While significant genotypic negative link with FLL (-0.29*), FLW (-0.56**) and at phenotypic level it had negative link with FLW (-0.35**). GW at genotypic and phenotypic level exposed positive relation with TGW (0.56**), (0.41**), FLW (0.62**), (0.53**) and FLA (0.38**), (0.29*) respectively. At genotypic level, L/W ratio showed significant positive relation with PH (0.62**), TP (0.35**), GP (0.44**), FLL (0.34**) and FFA (0.34**) while at phenotypic level it exhibited positive relation with PH (0.57**), TP (0.27*), GP (0.38**) and FLL (0.29*) and at both level this traits had significant negative link with FLW (0.44**) and (0.38**). AC at genotypic and phenotypic level had significant positive correlation with TP (0.33*), (0.26*) and TGW (0.33*), (0.30*) while at both levels it had significant negative relation with GP (-0.38**) and (-0.27*) respectively. Protein contents had significant genotypic positive association with PH (0.38**), PL (0.46**), TP (0.36**) and FLL (0.94**) and significant phenotypic positive relation with PH (0.34**), PL (0.37**), TP (0.28*) while it had significant negative genotypic correlation with FLA (-0.63**).
Path analysis showed that the highest positive direct effect was exhibited by flag leaf width (0.80159), followed by AC (0.60509), FLL (0.55643), GL (0.45752), PH (0.37699), GP (0.14701), GW (0.10587), and PL (0.07392), whereas a negative direct effect was exhibited by various traits such as TGW (-0.97369), FLA (-0.85663), L/W ratio (-0.43364), and TP (-0.10422). Plant height had an indirect positive effect on panicle length (0.49294), TP (0.37321), thousand-grain weight (0.42260), flag leaf width (0.76028), GL (0.28054), and GW (0.18993), and negative indirect effects on GP (-0.10524), flag leaf length (-0.97466), area (-0.68228), grain length to width ratio (-0.96331), and amylose content (-0.78942). Path analysis (Table 4) revealed that panicle length had a positive indirect effect on plant height (0.45325), grains per panicle (0.00302), thousand-grain weight (0.56130), and flag leaf area (0.47471). Panicle length had an indirect negative effect on tillers per plant (-0.40117), flag leaf length (-0.38361), FLW (-0.21433), GL (-0.20225), GW (-0.82777), grain length-to-width ratio (-0.56603), and amylose content (-0.00191).
Tillers per plant had positive indirect effects on panicle length (0.16424), flag leaf width (0.31813), FLA (0.90972), grain length (0.45624), and amylose content (0.21513) and had a negative indirect effect on plant height (-0.02879), GP (-0.38320), thousand grain weight (-0.36272), flag leaf length (-0.39589), grain width (-0.04779), and the ratio of grain length to width (-0.25135). Path analysis showed that grains per panicle had a positive indirect effect on PL (0.03438), tillers per plant (0.37572), 1000GW (0.98818), flag leaf length (0.72235), FLA (0.16947), grain length to width ratio (0.09523), and amylose content (0.29365) and a negative indirect effect on plant height (-0.21809), grain length (-0.66119), and grain breadth (-0.44773). The thousand grain weight had a positive indirect effect on FLL (0.10233), flag leaf width (0.12694), GL (0.88296), grain width (0.86501), and protein content (0.69811), whereas it had a negative indirect effect on PH (-0.37682), panicle length (-0.18852), number of total tillers per plant (-0.40841), grain per panicle (-0.12631), flag leaf area (-0.92864), and L/W ratio (-0.02772).
Flag leaf area exhibited positive indirect effects on plant height (0.25650), tillers per plant (0.18280), flag leaf length (0.70468), FLW (0.17177), GL (0.61452), GW (0.57799), and amylose content (0.10280). Leaf area had negative indirect effects on PL (-0.82760), GP (-0.14625), TGW (-0.33526) and L/W ratio (0.09965). An indirect positive effect of grain length was found for plant height (0.23858), flag leaf width (0.83520), GW (0.63211), grain length to width ratio (0.50012), and amylose content (0.57246), and negative indirect effects were found for panicle length (-0.03584), tillers per plant (-0.87585), GP (-0.57574), thousand GW (-0.52721), FLL (-0.21453), and flag leaf area (-0.33006).
Grain width had indirect positive effects on PH (0.02493), TP (0.58473), FLW (0.07241), and GL (0.31547) but negative indirect effects on PL (-0.04189), GP (-0.15506), TGW (-0.89808), FLL (-0.02685), FLA (-0.52199), L/W ratio (-0.11603), and amylose content (-0.94861). Amylose content showed a positive indirect effect on grains per panicle (0.06009), thousand grain weight (00.11767), flag leaf width (0.37826), and grain length (0.56632), whereas it had a negative indirect effect on plant height (-0.33478), panicle length (-0.00445), TP (-0.19049), FLL (-0.00211), FLA (-0.45587), grain width (-0.29451), and grain length to width ratio (-0.26440) (Table 4).
To address the objective of identyfing traits rice grain quality, protein contents was considered as a key quality parameter. Correlation analysis exposed that PC exhibited significant positive genotypic and phenotypic correlation with PH, PL and NT, indicating their potential contributing toward grain quality improvement. Path coefficient analysis further demonstrated that grain per panicle, FLW and GL exerted strong positive direct effect on protein contents where as TGW, and GW showed negative direct effect. Additionally, several traits contributed indirectly to protein contents through their influence on key components perticulalry via number of grains per panicle and grain length. These results suggest that the selection based on traits with strong direct and indirect effect can be effectively utilized to enhance rice grain quality.
4. Discussion
The present study provides a comprehensive evaluation of 60 diverse rice genotypes, integrating both morphological and quality traits within a single experimental framework. This combined assessment of phenotypic correlation and path coefficient analysis in a large and diverse Basmati oriented panel provides new insights into traits inter-correlation. Plant growth and development are governed by both intricate physiological and biochemical processes. Different metabolic changes occur during each embryonic period, and diurnal elements such as temperature, light, and day length have an impact. Having genetic resources rich in elements can help increase rice yield and serve as a natural source of nutritious food, especially for emerging nations and impoverished people (Xu et al., 2015). Crop production is negatively affected by a number of other obstacles to expanding the rice area, including climate change, high temperatures, and water scarcity (Al-Zahrani et al., 2018).
Genetic variability in crop gene pool resources can be easily illustrated using morphological markers (Bibi et al., 2019). The evaluation of genetic variability and genetic correlations among primary morphological and yield-related variables is the first stage of any breeding program (Wang et al., 2020). Agronomic characteristics and yield traits are essentially quantitative and controlled by both genetic and environmental factors. However, advantageous genetic resources are useful tools for increasing the yield and quality of crops, such as rice (Anis et al., 2016). Sixty rice genotypes were chosen for this study to examine the association and direct and indirect effects on quality and nutritional content. Based on these findings, every rice genotype chosen was predicted to exhibit a wide range of genetic variants that may be applied to the breeding program, as suggested by Olufowote et al. (1997).
There was considerable genetic variability among genotypes for nearly all characteristics, as indicated by the analysis of variance results for all traits, which were highly significant. In the present study, we identified significant variance among the genotypes for various rice traits, and Yadav et al. (2024) identified the variance among the genotypes. Selecting only on the basis of yield can often lead to less than ideal success in isolating superior genotypes, because yield is a complex variable that is connected to numerous other traits and is greatly affected by the environment (Madhubabu et al., 2017). Therefore, plant breeders must employ indirect selection through component attributes to increase their yield. Character association studies can help plant breeders create an efficient selection strategy to strike a reliable and reasonably priced balance between a variety of attributes by providing insights into the nature and intent of selection. In this study, significant differences were found among the genotypes for the study traits, indicating that there was significant genetic variability that could be used for crop improvement, and this provides a genetic basis for selecting superior traits.
In the present study, plant height was significantly and positively associated with panicle length and thousand grains, indicating that taller plant tends to produce longer panicle and heavier grains. This suggest that plant height may indirectly contribute to yield improvement through effect on panicle architecture and grain development. Similar kind of association between these parameters were also revealed by Fentie et al. (2021) and Kumar et al. (2018). Moreover, plant height was positively associated with FLL, FLW, L/W ratio, and PC, imply coordinated regulation of vegetation vigour and grain quality characteristics within the evaluated germplasm, these kind of correlation was also identified by Devi et al. (2019), for plant height and flag leaf length and width, Ghouri et al. (2020) for plant height and protein content. Panicle length showed a highly significant positive genotypic association with FLL, FLW, GL, L/W ratio, and PC; a significant negative association with TP; and a positive phenotypic association with GP, TGW, FLL, FLW, and PC; however, it had a substantial negative phenotypic link with TP. These results are comparable to those of Preeti et al. (2019) for the number of grains, grain length to breadth ratio, thousand grain weights, Ghouri et al. (2020) for protein content, and Devi et al. (2019) for flag leaf length and width. The panicle length showed a significant negative phenotypic association with tillers per plant, which is in agreement with the results of (Fentie et al., 2021).
Tillers per plant were positively associated at the genotypic and phenotypic levels with GP, FLA, L/W ratio, AC, and PC; however, they exhibited negative genotypic relationships with FLL, FLW, and GP, these kind of finding are correlated with Devi et al. (2019) for flag leaf length and width and Dhurai et al. (2014) for the grain length to breath ratio (L/W ratio). The number of grains per panicle exhibited a significant positive genotypic relationship with FLL, FLA, and L/W ratioand a significant negative association with AC. These outcomes were found according to Preeti et al. (2019) for flag leaf area and Dhurai et al. (2014) for grain-length-to-breath ratio. A significant positive association of thousand-grain weight with FLL, GL, GW, and AC were also reported by Dhurai et al. (2014) and Radha et al. (2019). Flag leaf length exhibited a significant positive genotypic relationship with FLW, FLA, L/W ratio, and PC and a significant negative association with GL, which was in accordance with Devi et al. (2019) and Fentie et al. (2021). Flag leaf area exhibited significant positive genotypic relationships with GL, GW, and L/W ratio) and a significant negative relationship with PC. Ali et al. (2024) in their study in rice also found same correlation of FLA with grain length and protein content, but their correlation results of grain L/B ratio was apposite. This discrepancy may be attributed to differences in environmental such as temperature, water availability and soil fertility during crop growth, which are known to influence grain morphology and assimilate partitioning as well as deviation in genetic background and experimental condition between studies. Grain length had a significant positive relationship with L/W ratio and negative GW. Radha et al. (2019) obtained similar results for the grain L/B ratio. The grain width had a negative relationship with the grain length-to-width ratio, which was inconsistent with the results of Radha et al. (2019).
Path analysis divides the correlation coefficient into direct and indirect effects to better understand cause effect relationship among the traits. In this study, we found a leaf width, AC, FLL, GL, PH, GP, GW, and PL exhibited positive direct effect on protein contents, whereas TGW, L/W ratio, and TP showed negative direct effect on protein contents. These results are in agreement with those of Radha et al. (2019), Krishna et al. (2022), Fentie et al. (2021) and Karthika et al. In 2017, Dhurai et al. (2014), and Vennela et al. (2021), Kranthi et al. (2023) and Manivelan et al. (2022).
In this study, path analysis of morphological and quality parameters showed that plant height had an indirect positive effect on the panicles length,. thousand grain weight, leaf width, grain length, and grain width, whereas negative indirect effects were observed for number of grain per panicle, flag leaf length and area, grain length to width ratio, and amylose content. Similar results were reported by Krishna et al. (2022) for PL, 1000GW, GL, and GW; Bhutta et al. (2019) for flag leaf area; NTP; and Nikhil et al. (2014) for FLL. The same indirect effect on panicle length was observed by Bagudam et al. (2018), Bhutta et al. (2019), Chavan et al. (2022), Devi et al. (2019), Krishna et al. (2022) and Manohara and Singh (2015).
Path analysis studies showed that tillers per plant had positive indirect effects on panicle length, leaf width, leaf area, grain length, and amylose content and had a negative indirect effect on plant height, grains per panicle, thousand grain weight, leaf length, GW, and the ratio of grain length to width. Similar results were reported by Bhutta et al. (2019) for PL, Alshugeairy et al. (2023) for FLA, Zeleke and Worede (2021) for NG, and Kumar et al. (2020) for flag leaf length, FLW, GL, and GW. Grains per panicle had positive indirect effects on PL, TP, 1000GW, leaf length, leaf area, grain length-to-width ratio, and amylose content, and negative indirect effects on plant height, grain length, and grain breadth. The results of Kumar et al. (2020) were the same for tillers per plant, 1000GW, GW, and PH, whereas Krishna et al. (2022) for GL and AC, respectively. In this study, thousand-grain weight had a positive indirect effect on leaf length, leaf width, grain length, grain width, and amylose content, whereas it had a negative indirect effect on PH, panicle length, number of total tiller per plant, grain per panicle, leaf area, and L/W ratio, which was inconsistent with the results of Allam et al. (2014), Kohnaki et al. (2013), Krishna et al. (2022), Kumar et al. (2020) and Zeleke and Worede (2021). Leaf length exhibited a positive indirect effect on TP and GP and a negative indirect effect on PH, panicle length, thousand grain weight, LW, LA, GL, width, L/W ratio, and AC. Similar results were reported by Kumar et al. (2020) for plant height, thousand kernel weight, length, and width and Devi et al. (2019) for tillers, panicle length, and leaf width. Similar results have been reported by Devi et al. (2019), Kumar et al. (2020) and Yadav and Suresh (2018) for leaf width.
The leaf area had a positive indirect effect on plant height, TP, FLL, flag leaf width, grain length, grain width, and amylose content. In contrast, leaf area had a negative indirect effect on the PL, GP, TGW, and L/W ratio. These results were inconsistent with those reported by Bhutta et al. (2019), Nareshkumar et al. (2024), Osman et al. (2019) and Parte et al. (2022). In our study, indirect positive effects of grain length were found for plant height, leaf width, grain width, grain length to width ratio, and amylose content, whereas a negative indirect effect was observed for PL, tillers/plant, GP, thousand grain weight, leaf length, and leaf area. Similar results were reported by Nareshkumar et al. (2024) for PH, TP, PL, GP, TGW, GW, and L/W ratio, and Kumar et al. (2020) for flag leaf width. Relevant findings on grain width were reported by Islam et al. (2019) for FLA, PL, and GL; Nareshkumar et al. (2024) for PH, TP, 1000GW, Thuy et al. (2023) for NT, LL, PL, and GL. The grain length-to-width ratio had an indirect positive effect on PH, PL, FLL, FLW, GW, and AC, and indirect negative effect on TP, GP, TGW, FLA, and GL. In addition, Karthika et al. (2017), Kumar et al. (2020), Nareshkumar et al. (2024), Parte et al. (2022) and Thuy et al. (2023). Amylose content had a positive indirect effect on grains/panicle, 1000GW, leaf width, and grain length, whereas it had a negative indirect effect on plant height, panicle length, tillers per plant, leaf length, leaf area, grain width, and grain-length-to-width ratio. The results of Meena et al. (2020) were the same for PH, PL, GP, 1000GW, Ghouri et al. (2020) for amylose and L/W ratio.
Together with correlation partitioning, the application of path coefficient analysis produces an integrated platform for studying yield-related attributes. Direct and indirect effects quantification with such approaches enhances insight into interdependence among traits and permits more efficient choice of genotype. This technique ensures that breeding invests in focused areas with the maximum possible potential to improve rice yields. Hence, through the information we obtained related to direct and indirect effects and the association of various quality and yield-related parameters, we suggest that rice production can be improved by improving these positive and direct related traits and, in a similar manner, decreasing negative ones. In the future, information should be collected in the same manner as the results of the present study.
The limitation of this study is that the present study was conducted during a single growing season under natural field conditions; therefore, genotypes x environment interaction could not be evaluated. Multi-location and multi-year trials would provide a more comprehensive assessment of the stability and adaptability of the identified superior genotypes. Furthermore, although strong phenotypic associations were found among the yield and quality traits, molecular validation and genomics analysis would strengthen the understanding of the underlying genetic architecture.
5. Conclusions
The present study demonstrated significant variability among 60 Oryza sativa genotypes for both morphological and grain quality traits. Correlation analysis revealed that traits such as PH, PL and TP were positively associated with protein contents at both genotypic and phenotypic level, indicating their importance in improving grain nutritional quality. Path coefficient analysis (Table 4) indicated that flag leaf width, amylose contents and flag leaf length exhibited a strong positive direct effect on protein contents, while TWG and FLA showed strong negative direct effect. Other traits such as PH and GL exhibited moderate positive direct effect. Notably, number of grains per panicle showed a substantial negative indirectly effect on protein contents via TGW, due to strong positive correlation between GP and TGW coupled with large negative direct effect. Overall, these integration of correlation and path analysis provide a reliable approach for identifying key traits influencing protein content. Therefore selection based on these characters could be effectively utilized in rice breeding programs to develop high quality protein enriched rice cultivars under field condition.
Acknowledgements
This research was conducted at the Department of Plant Breeding and Genetics, Faculty of Agriculture and Environment, The Islamia University of Bahawalpur, Pakistan. The study was also supported by Hasanuddin University to cover the APC Journal.
Data Availability Statement
The dataset analyzed or produced in this study can be requested from the corresponding author.
References
-
ALI, E.N., RAJESWARI, S., SARASWATHI, R. and JEYAPRAKASH, P., 2018. Genetic variability and character association for earliness, yield and its contributing traits in F2 population of rice (Oryza sativa L.). Electronic Journal of Plant Breeding, vol. 9, no. 3, pp. 1163-1169. https://doi.org/10.5958/0975-928X.2018.00145.X
» https://doi.org/10.5958/0975-928X.2018.00145.X -
ALI, Z., NAEEM, M., AHMED, H.G.M.-D., HAFEEZ, A., ALI, B., SARFRAZ, M.H. and MUSTAFA, A.E.Z.M., 2024. Diversity and association analysis of physiological and yield indices in rice germplasm. ACS Agricultural Science & Technology, vol. 4, no. 3, pp. 317-329. https://doi.org/10.1021/acsagscitech.3c00284
» https://doi.org/10.1021/acsagscitech.3c00284 -
ALLAM, C.R., JAISWAL, H.K. and QAMAR, A., 2014 [viewed 24 February 2026]. Character association and path analysis studies of yield and quality parameters in basmati rice (Oryza sativa L.). The Bioscan [online], vol. 9, no. 4, pp. 1733-1737. Available from: https://thebioscan.com/index.php/pub/article/view/2114
» https://thebioscan.com/index.php/pub/article/view/2114 -
ALSHUGEAIRY, Z.K., ALOGAIDI, F.F., HADI, B.H. and HASSAN, W.A., 2023. Path coefficient analyses of introduced rice varieties under different planting distances. SABRAO Journal of Breeding and Genetics, vol. 55, no. 2, pp. 516-524. https://doi.org/10.54910/sabrao2023.55.2.23
» https://doi.org/10.54910/sabrao2023.55.2.23 - AL-ZAHRANI, H.S., ALMAGHRABI, O.A., EL-MALKY, M.M., METWALI, E.M. and RIHAN, H.Z., 2018. Development of nutrient-rich and blast-resistant rice cultivars through tissue culture and monogenic lines. International Journal of Agriculture and Biology, vol. 20, pp. 2508-2520.
- AMIN, A.K.M.K. and HAQUE, M.A., 2009. Seedling age influence rice (Oryza sativa L.) performance. Philippine Journal of Science, vol. 138, no. 2, pp. 219-226.
-
ANIS, B.G., ELMOGHAZY, M.A. and ZIDAN, S.N., 2016. Grain quality and nutritional value of some Egyptian and exotic rice (Oryza sativa L.) Varieties. Alexandria Journal of Agricultural Sciences, vol. 61, no. 2, pp. 105-113. https://doi.org/10.21608/alexja.2016.244431
» https://doi.org/10.21608/alexja.2016.244431 -
ATWELL, B.J., WANG, H. and SCAFARO, A.P., 2014. Could abiotic stress tolerance in wild relatives of rice be used to improve Oryza sativa? Plant Science : An International Journal of Experimental Plant Biology, vol. 215–216, pp. 48-58. https://doi.org/10.1016/j.plantsci.2013.10.007 PMid:24388514.
» https://doi.org/10.1016/j.plantsci.2013.10.007 -
BAGUDAM, R., ESWARI, K.B., BADRI, J. and RAO, P.R., 2018. Correlation and path analysis for yield and its component traits in NPT core set of rice (Oryza sativa L.). International Journal of Current Microbiology and Applied Sciences, vol. 7, no. 9, pp. 97-108. https://doi.org/10.20546/ijcmas.2018.709.013
» https://doi.org/10.20546/ijcmas.2018.709.013 -
BALMFORD, A., AMANO, T., BARTLETT, H., CHADWICK, D., COLLINS, A., EDWARDS, D. and EISNER, R., 2018. The environmental costs and benefits of high-yield farming. Nature Sustainability, vol. 1, no. 9, pp. 477-485. https://doi.org/10.1038/s41893-018-0138-5 PMid:30450426.
» https://doi.org/10.1038/s41893-018-0138-5 -
BHUTTA, M.A., MUNIR, S., QURESHI, M.K., SHAHZAD, A.N., ASLAM, K., MANZOOR, H. and SHABIR, G., 2019. Correlation and path analysis of morphological parameters contributing to yield in rice (Oryza sativa) under drought stress. Pakistan Journal of Botany, vol. 51, no. 1, pp. 73-80. https://doi.org/10.30848/PJB2019-1(28)
» https://doi.org/10.30848/PJB2019-1(28) -
BIBI, S., SHAH, A.H., KHAN, I.A., JAN, S.A., ZUBAIR, M., ALI, N. and KHAN, U., 2019. Assessment of genetic diversity in hexaploid wheat of northern areas of Pakistan (Gilgit Baltistan) using morphological marker. International Journal of Agriculture and Biology https://doi.org/10.17957/IJAB/15.1061
» https://doi.org/10.17957/IJAB/15.1061 -
BRAR, D.S. and SINGH, K., 2011. Oryza BT. In: C. KOLE, ed. Wild crop relatives: genomic and breeding resources. Heidelberg: Springer, pp. 321-365. https://doi.org/10.1007/978-3-642-20450-0_10
» https://doi.org/10.1007/978-3-642-20450-0_10 - CHAUDHARI, P.R., TAMRAKAR, N., SINGH, L., TANDON, A. and SHARMA, D., 2018. Rice nutritional and medicinal properties: a review. Journal of Pharmacognosy and Phytochemistry, vol. 7, no. 2, pp. 150-156.
- CHAVAN, B.R., DALVI, V.V., KUNKERKAR, R.L., MANE, A.V. and GOKHALE, N.B., 2022. Study of correlation and path analysis in aromatic rice genotypes (Oryza sativa L.). Journal of Pharmaceutical Innovation, vol. 11, no. 1, pp. 1704-1707.
-
CHEN, T., SHABALA, S., NIU, Y., CHEN, Z.H., SHABALA, L., MEINKE, H. and ZHOU, M., 2021. Molecular mechanisms of salinity tolerance in rice. The Crop Journal, vol. 9, no. 3, pp. 506-520. https://doi.org/10.1016/j.cj.2021.03.005
» https://doi.org/10.1016/j.cj.2021.03.005 -
CORDERO-LARA, K.I., 2020. Temperate japonica rice (Oryza sativa L.) breeding: History, present and future challenges. Chilean Journal of Agricultural Research, vol. 80, no. 2, pp. 303-314. https://doi.org/10.4067/S0718-58392020000200303
» https://doi.org/10.4067/S0718-58392020000200303 -
CUBRY, P., PIDON, H., TA, K.N., TRANCHANT-DUBREUIL, C., THUILLET, A.C., HOLZINGER, M., ADAM, H., KAM, H., CHRESTIN, H., GHESQUIÈRE, A., FRANÇOIS, O., SABOT, F., VIGOUROUX, Y., ALBAR, L. and JOUANNIC, S., 2020. Genome wide association study pinpoints key agronomic QTLs in African rice Oryza glaberrima. Rice, vol. 13, no. 1, pp. 66. https://doi.org/10.1186/s12284-020-00424-1 PMid:32936396.
» https://doi.org/10.1186/s12284-020-00424-1 -
CUEVAS, R.P., PEDE, V.O., MCKINLEY, J., VELARDE, O. and DEMONT, M., 2016. Rice grain quality and consumer preferences: a case study of two rural towns in the Philippines. PLoS One, vol. 11, no. 3, e0150345. https://doi.org/10.1371/journal.pone.0150345 PMid:26982587.
» https://doi.org/10.1371/journal.pone.0150345 - DEVI, K.R., CHANDRA, B.S., VENKANNA, V. and HARI, Y., 2019. Variability, correlation and path studies for yield and quality traits in irrigated upland rice (Oryza sativa L.). Journal of Pharmacognosy and Phytochemistry, vol. 8, no. 3, pp. 676-684.
-
DEWEY, D.R. and LU, K., 1959. A correlation and path coefficient analysis of components of crested wheat grass seed production. Agronomy Journal, vol. 51, no. 9, pp. 515-518. https://doi.org/10.2134/agronj1959.00021962005100090002x
» https://doi.org/10.2134/agronj1959.00021962005100090002x - DHURAI, S.Y., REDDY, D.M. and BHATI, P.K., 2014. Correlation and path coefficient analysis for yield and quality traits under organic fertilizer management in rice (Oryza sativa L.). Electronic Journal of Plant Breeding, vol. 5, no. 3, pp. 581-587.
- DIAGNE, A., MIDINGOYI, S.G., WOPEREIS, M. and AKINTAYO, I., 2010. The NERICA success story: development, achievements and lessons learned. Saint-Louis: Africa Rice Center.
- FENTIE, D.B., ABERA, B.B. and ALI, H.M., 2021. Association of agronomic traits with grain yield of lowland rice (Oryza sativa L.) genotypes. International Journal of Agricultural Sciences, vol. 8, pp. 2348-3997.
-
GHOURI, F., ALI, Z., NAEEM, M., UL-ALLAH, S., BABAR, M., BALOCH, F.S. and SHAHID, M.Q., 2022. Effects of silicon and selenium in alleviation of drought stress in rice. Silicon, vol. 14, no. 10, pp. 5453-5461. https://doi.org/10.1007/s12633-021-01277-z
» https://doi.org/10.1007/s12633-021-01277-z -
GHOURI, F., NAEEM, M., IQBAL, M., ALLAH, S.U. and SHAHID, M.Q., 2020. An analysis of genetic association between yield and quality traits in segregating population of Oryza sativa L. Applied Ecology and Environmental Research, vol. 18, no. 4, pp. 5211-5224. https://doi.org/10.15666/aeer/1804_52115224
» https://doi.org/10.15666/aeer/1804_52115224 - Government of Pakistan, 2022. Pakistan economic survey 2021-22 Islamabad: Finance Division, Economic Adviser’s Wing
-
HUANG, X., WEI, X., SANG, T., ZHAO, Q., FENG, Q., ZHAO, Y., LI, C., ZHU, C., LU, T., ZHANG, Z., LI, M., FAN, D., GUO, Y., WANG, A., WANG, L., DENG, L., LI, W., LU, Y., WENG, Q., LIU, K., HUANG, T., ZHOU, T., JING, Y., LI, W., LIN, Z., BUCKLER, E.S., QIAN, Q., ZHANG, Q.F., LI, J. and HAN, B., 2010. Genome-wide association studies of 14 agronomic traits in rice landraces. Nature Genetics, vol. 42, no. 11, pp. 961-967. https://doi.org/10.1038/ng.695 PMid:20972439.
» https://doi.org/10.1038/ng.695 -
ISLAM, M.Z., MIAN, M.A.K., IVY, N.A., AKTER, N. and RAHMAN, M.M., 2019. Genetic variability, correlation and path analysis for yield and its component traits in restorer lines of rice. Bangladesh Journal of Agricultural Research, vol. 44, no. 2, pp. 291-301. https://doi.org/10.3329/bjar.v44i2.41819
» https://doi.org/10.3329/bjar.v44i2.41819 -
KAKAR, K., NITT, Y., ASAGI, N., KOMATSUZAKI, M., SHIOTSU, F., KOKUBO, T. and XUAN, T.D., 2019. Morphological analysis on comparison of organic and chemical fertilizers on grain quality of rice at different planting densities. Plant Production Science, vol. 22, no. 4, pp. 510-518. https://doi.org/10.1080/1343943X.2019.1657777
» https://doi.org/10.1080/1343943X.2019.1657777 -
KARTHIKA, G., RAJESWARI, S., ROBIN, S., GOVINTHARAJ, P., NACHIMUTHU, V.V. and PANDIAN, B.A., 2017. Assessment of genetic variability, correlation and path coefficient analysis for morphological and quality traits in rice (Oryza sativa L.). Agricultural Science Digest, vol. 37, no. 4, pp. 251-256. https://doi.org/10.18805/ag.D-4643
» https://doi.org/10.18805/ag.D-4643 - KOHNAKI, M.E., KIANI, G. and NEMATZADEH, G., 2013. Relationship between morphological traits in rice restorer lines at F3 generation using multivariate analysis. Iranian South East of Advanced Research Center, vol. 1, pp. 2322-4827.
- KRANTHI, A.K., SHARMA, D.J., SUBBARAO, L.V., GIREESH, C. and AGRAWAL, A.P., 2023. Correlation coefficient and path coefficient analysis for yield, yield attributing traits and nutritional traits in rice genotypes. Journal of Pharmaceutical Innovation, vol. 12, no. 3, pp. 1978-1983.
-
KRISHNA, K., MOHAN, Y.C., SHANKAR, V.G., PARIMALA, G. and KRISHNA, L., 2022. Correlation and path analysis in rice (Oryza sativa L.) CMS lines. Journal of Crop and Weed, vol. 18, no. 2, pp. 216-221. https://doi.org/10.22271/09746315.2022.v18.i2.1592
» https://doi.org/10.22271/09746315.2022.v18.i2.1592 - KUMAR, S., CHAUHAN, M.P., TOMAR, A. and KASANA, R.K., 2018. Coefficient of variation (GCV & PCV), heritability and genetic advance analysis for yield contributing characters in rice (Oryza sativa L.). Journal of Pharmacognosy and Phytochemistry, vol. 7, no. 6, pp. 2161-2164.
- KUMAR, A., PRASAD, J., KUMAR, S., SINGH, S., JEENA, A.S. and UPRETI, M.C., 2020. Association and path analysis for yield components and quality traits in rice (Oryza sativa L.). Journal of Pharmacognosy and Phytochemistry, vol. 9, no. 4, pp. 2069-2074.
-
MADHUBABU, P., SUMAN, K., RATHOD, R., FIYAZ, R.A., RAO, D.S. and SUDHAKAR, P., 2017. Evaluation of grain yield, quality and nutrients content in four rice (Oryza sativa L.) genotypes. Current Journal of Applied Science and Technology, vol. 22, no. 1, pp. 1-12. https://doi.org/10.9734/CJAST/2017/34673
» https://doi.org/10.9734/CJAST/2017/34673 -
MAHENDER, A., ANANDAN, A., PRADHAN, S.K. and PANDIT, E., 2016. Rice grain nutritional traits and their enhancement using relevant genes and QTLs through advanced approaches. SpringerPlus, vol. 5, no. 1, pp. 1-18. https://doi.org/10.1186/s40064-016-3744-6 PMid:28018794.
» https://doi.org/10.1186/s40064-016-3744-6 - MANIVELAN, K., JULIET, H.S., SURESH, R., THERADIMANI, M., RENUKA, R. and GNANAMALAR, R.P., 2022. Inherent variability, correlation and path analysis in lowland rice (Oryza sativa L.). Biological Forum : An International Journal, vol. 14, no. 2, pp. 771-778.
- MANOHARA, K.K. and SINGH, N.P., 2015. Genetic variability, correlation and path analysis in rice (Oryza sativa L.) under coastal salinity conditions of Goa. Journal of the Indian Society of Coastal Agricultural Research, vol. 33, no. 2, pp. 34-39.
-
MEENA, D., KUMAR, M., SANDHYA, K.N., YAMINI, T. and MEENA, A.K., 2020. Assessment of correlation and path coefficient analysis for yield and it’s attributing traits in rice (Oryza sativa L.) genotypes. International Journal of Current Microbiology and Applied Sciences, vol. 9, no. 7, pp. 3845-3851. https://doi.org/10.20546/ijcmas.2020.907.450
» https://doi.org/10.20546/ijcmas.2020.907.450 -
MILLER, P.A., WILLIAMS JUNIOR, J.C., ROBINSON, H.F. and COMSTOCK, R.E., 1958. Estimates of genotypic and environmental variances and covariance’s in Upland cotton and their implications in selection. Agronomy Journal, vol. 50, no. 3, pp. 126-131. https://doi.org/10.2134/agronj1958.00021962005000030004x
» https://doi.org/10.2134/agronj1958.00021962005000030004x - NARESHKUMAR, V., KAJAL, B., VAKUL, S., CHARU, KUNDAN, B. and NEELAM, B., 2024. Morphological characterization, genetic variability and trait association of Basmati, Red and White Rice Lines under North Hill Zone of India. Biological Forum: An International Journal, vol. 16, no. 1, pp. 226-233.
- NIKHIL, B.S.K., RANGARE, N.R. and SAIDAIAH, P., 2014. Correlation and path analysis in rice (Oryza sativa L.). International Journal of Tropical Agriculture, vol. 2, no. 1, pp. 1-5.
-
OLUFOWOTE, J.O., XU, Y., CHEN, X., GOTO, M., MCCOUCH, S.R., PARK, W.D. and DILDAY, R.H., 1997. Comparative evaluation of within-cultivar variation of rice (Oryza sativa L.) using microsatellite and RFLP markers. Genome, vol. 40, no. 3, pp. 370-378. https://doi.org/10.1139/g97-050 PMid:9202415.
» https://doi.org/10.1139/g97-050 -
ORGANISATION FOR ECONOMIC CO-OPERATION AND DEVELOPMENT – OECD. Food and Agriculture Organization – FAO, 2025 [viewed 24 February 2026]. OECD-FAO agricultural outlook 2025-2034 [online]. Paris: OECD Publishing. Available from: http://data-explorer.oecd.org/s/1hc
» http://data-explorer.oecd.org/s/1hc -
OSMAN, M., ZIDAN, A.A. and NADA, A.M., 2019. Path coefficient analysis and correlation for some yield and its attributes in rice (Oryza sativa L.). Journal of Plant Production, vol. 10, no. 7, pp. 539-542. https://doi.org/10.21608/jpp.2019.53550
» https://doi.org/10.21608/jpp.2019.53550 - PAKISTAN. Pakistan Meteorological Department, 2023. Pakistan climate summary 2023. Islamabad: Climate Data Processing Centre.
-
PARTE, D., SATHISH, K., SAHU, P., SHARMA, D., BHAINSA, K., DAS, B.K. and SHRIVASTAVA, R., 2022. Correlation and path analysis studies for yield and quality traits of rice landraces and mutants of chhattisgarh, India. International Journal of Environment and Climate Change, vol. 12, no. 12, pp. 1771-1779. https://doi.org/10.9734/ijecc/2022/v12i121621
» https://doi.org/10.9734/ijecc/2022/v12i121621 -
PREETI, K., CHAUHAN, M.P., ARCHANA, D., VERMA, O.P., DWIVEDI, R., DWIVEDI, D.K. and RAJ, S.D., 2019. Genotypic and phenotypic correlation and path analysis of yield and yield contributing traits in rice (Oryza sativa L.) under salinity condition. International Journal of Current Microbiology and Applied Sciences, vol. 8, no. 7, pp. 154. https://doi.org/10.20546/ijcmas.2019.807.154
» https://doi.org/10.20546/ijcmas.2019.807.154 - RADHA, T., KUMAR, P.S., SARAVANAN, K. and SUGANTHI, S., 2019. Genetic variability, association and path analysis for grain yield and quality traits in rice (Oryza sativa L.). Plant Archives, vol. 19, no. 2, pp. 2522-2526.
-
SANDHU, N., YADAV, S., SINGH, V.K. and KUMAR, A., 2021. Effective crop management and modern breeding strategies to ensure higher crop productivity under direct seeded rice cultivation system: a review. Agronomy, vol. 11, no. 6, pp. 1264. https://doi.org/10.3390/agronomy11071264
» https://doi.org/10.3390/agronomy11071264 -
THAKUR, A.K., RATH, S., ROYCHOWDHURY, S. and UPHOFF, N., 2010. Comparative performance of rice with system of rice intensification (SRI) and conventional management using different plant spacings. Journal Agronomy & Crop Science, vol. 196, no. 2, pp. 146-159. https://doi.org/10.1111/j.1439-037X.2009.00406.x
» https://doi.org/10.1111/j.1439-037X.2009.00406.x -
THUY, N.P., TRAI, N.N., KHOA, B.D., THAO, N.H.X., THI, Q.V.C. and PHONG, V.T., 2023. Correlation and path analysis of association among yield, micronutrients, and protein content in rice accessions grown under aerobic condition from Karnataka, India. Plant Breeding and Biotechnology, vol. 11, no. 2, pp. 117-129. https://doi.org/10.9787/PBB.2023.11.2.117
» https://doi.org/10.9787/PBB.2023.11.2.117 -
VAUGHAN, D.A., LU, B.R. and TOMOOKA, N., 2008. The evolving story of rice evolution. Plant Science : An International Journal of Experimental Plant Biology, vol. 174, no. 4, pp. 394-408. https://doi.org/10.1016/j.plantsci.2008.01.016
» https://doi.org/10.1016/j.plantsci.2008.01.016 -
VENNELA, M., SRINIVAS, B., REDDY, V.R. and BALRAM, N., 2021. Studies on correlation and path coefficient analysis in hybrid rice (Oryza sativa L.) for yield and quality traits. International Journal of Bio-Resource and Stress Management, vol. 12, no. 5, pp. 496-505. https://doi.org/10.23910/1.2021.2199
» https://doi.org/10.23910/1.2021.2199 -
WANG, X., PANG, Y., WANG, C., CHEN, K., ZHU, Y., SHEN, C. and LI, Z., 2017. New candidate genes affecting rice grain appearance and milling quality detected by genome-wide and gene-based association analyses. Frontiers in Plant Science, vol. 7, pp. 1998. https://doi.org/10.3389/fpls.2016.01998 PMid:28101096.
» https://doi.org/10.3389/fpls.2016.01998 -
WANG, Q., JIANG, Y., LIAO, Z., XIE, W., ZHANG, X., LAN, H. and LU, Y., 2020. Evaluation of the contribution of teosinte to the improvement of agronomic, grain quality and yield traits in maize (Zea mays). Plant Breeding, vol. 139, no. 3, pp. 589-599. https://doi.org/10.1111/pbr.12796
» https://doi.org/10.1111/pbr.12796 -
WON, J.G., YOSHIDA, T. and UCHIMURA, Y., 2002. Genetic effect on amylose and protein contents in the crossed rice seeds. Plant Production Science, vol. 5, no. 1, pp. 17-21. https://doi.org/10.1626/pps.5.17
» https://doi.org/10.1626/pps.5.17 -
XU, X., XIE, J., HOU, Y., HE, P., PAMPOLINO, M.F., ZHAO, S. and ZHOU, W., 2015. Estimating nutrient uptake requirements for rice in China. Field Crops Research, vol. 180, pp. 37-45. https://doi.org/10.1016/j.fcr.2015.05.008
» https://doi.org/10.1016/j.fcr.2015.05.008 - YADAV, S. and SURESH, B.G., 2018. Path coefficient analysis for yield and yield components in diverse rice genotypes. International Journal of Current Microbiology and Applied Sciences, vol. 6, no. 9, pp. 998-1004.
-
YADAV, S.P.S., BHANDARI, S., GHIMIRE, N.P., MEHATA, D.K., MAJHI, S.K., BHATTARAI, S. and BHUJEL, S., 2024. Genetic variability, character association, path coefficient, and diversity analysis of rice (Oryza sativa L.) genotypes based on agro-morphological traits. International Journal of Agronomy, vol. 2024, no. 1, pp. 9946332. https://doi.org/10.1155/2024/9946332
» https://doi.org/10.1155/2024/9946332 - ZELEKE, B. and WOREDE, F., 2021. Correlation and path analysis for yield and related traits in upland rice (Oryza sativa L.) varieties. Black Sea Journal of Agriculture, vol. 4, no. 1, pp. 18-24.
-
ZULFIQAR, U., HUSSAIN, S., ISHFAQ, M., ALI, N., YASIN, M.U. and ALI, M.A., 2021. Foliar manganese supply enhances crop productivity, net benefits, and grain manganese accumulation in direct-seeded and puddled transplanted rice. Journal of Plant Growth Regulation, vol. 40, no. 5, pp. 1539-1556. https://doi.org/10.1007/s00344-020-10209-x
» https://doi.org/10.1007/s00344-020-10209-x
*
e-mail: fuad.anshori@unhas.ac.idEditor:

