
 Application of point clouds for the monitoring of cracks in controlled environment
Abstract:
Pathological manifestations in civil structures represent one of the main problems that compromise the useful life of constructions, among the most common are cracks or fissures. In this research, the feasibility of using point clouds in the determination and measurement of cracks was investigated. The experiment was carried out in a controlled environment comparing the values obtained by point clouds using photogrammetry with the reference values obtained by laser interferometer (our reference). The results indicated that point clouds generated from a scanner that uses structured light for modeling exhibited high consistency with reference values, with differences of less than a millimeter. Conversely, portable scanning equipment with lower resolution demonstrated limited performance, unable to accurately define crack dimensions below one centimeter. These findings highlight that the applicability of point clouds for crack monitoring is strongly dependent on the scanning technology employed. The research confirms the potential of structured-light 3D scanning as a reliable and cost-effective approach for structural health monitoring and early damage assessment.
Keywords:
Point Cloud; Cracks; Structural Health Monitoring; Portable Scanner
Introduction
Considering that safety is a fundamental factor in civil construction, from the planning and design stage, continuing throughout its useful life, Martins and Junior (2011) state that there is an increasing concern with the occurrence of pathological manifestations, especially after the beginning of use, which has led to the development of new forms of inspection in concrete structures.
Most of the pathological manifestations in concrete structures are cracks, which can signify the warning of a possible collapse in the structure. They can arise through underserved projects, erroneous executions, lack of proper maintenance, or failures in execution that may take time to manifest themselves (Ferreira 2020). Once identified in construction, it is essential that its state, growth activity, and nature of deformation are identified and monitored (Krakhmal’ny, Evtushenko and Krakhmal’naya 2016). To diagnose and treat the existing pathological manifestations, it is necessary to carry out a characteristic and in-depth study of their causes (Bento and Parreira 2021). According to Noronha (Noronha 2018), the wrong diagnosis of a pathology, in addition to not solving the problem, leads to more expenses, discomfort and the risk to the physical integrity of the users of the structure.
In this sense, the monitoring of structures, especially the branch of monitoring that studies the conditions of a structure, called Structural Health Monitoring, is one of the main concerns when working with large civil structures, as they need continuous surveys to certify their stability since they are subject to displacements and deformations (Han, Guo and Jiang 2013). Therefore, structural monitoring should be foreseen as one of the premises, being implemented from the beginning of the work (Bueno 2007).
For Geodetic Sciences, monitoring techniques are divided into non-geodetic (so-called physical) and geodetic techniques. Non- geodetic monitoring uses sensors attached to the structural object, such as inclinometers, piezometers, pendulums, mechanical and electrical extensometers, and others. Geodetic monitoring, on the other hand, uses classic concepts of triangulation, trilateration, inclination sensors, precision geometric leveling, and satellite positioning. In recent years, there has been a growing interest in the application of point clouds in monitoring, whether obtained by laser scanning or photogrammetric techniques.
Geodetic techniques, unlike non- geodetic ones, which provide localized and unreferenced information, provide the overall state of the structure in addition to versatility and suitability for any system and operating situation (Chrzanowski 1992).
According to Bueno (2007), in the last fifty years there has been a great development in Geodesy and associated technologies, directly related to engineering works, adding new methods to the monitoring of structures. This prominence is due to technological advances in topographic and geodetic instruments, measurement techniques, processing methods and computational resources (Erol 2010). In view of these advances, the use of point clouds has gained prominence since they have a high point density and spatial resolution and are acquired in a short period of time.
Some studies addressing the use of point clouds obtained by terrestrial laser scanning systems in the monitoring of structures are found in the literature. Silva Neto et al. (2010), for example, were able to integrate data from multivariate statistics and information visualization to analyze the structural data of the Itaipu dam (Brazil). Lenartovicz (2013) evaluated the potential of using Terrestrial Scanner Laser, using as a case study the dam of the Mauá Hydroelectric Power Plant, where scans were made before and after the formation of the reservoir. Sánchez-Rodríguez et al. (2018) proposed an algorithm to automate the detection and decomposition of mobile laser scanning railway tunnels. Punko, Suman and Rebolj (2018) were able to automate continuous monitoring of construction progress by utilizing multiple real-time 3D scans on the job site. Helming et al. (2010), were able to measure the deformation of a wind turbine tower using terrestrial laser scanning. Laefer et al. (2014), provides a mathematical basis for using TLS to detect cracking in unit-block masonry.
Despite the growing number of studies using point clouds for structural monitoring, most of the existing research relies on terrestrial laser scanners. Although these systems offer high accuracy and reliability, they are associated with high acquisition, operation, and maintenance costs, which include not only the price of the equipment itself but also specialized software and trained personnel. As a result, their application is often restricted to large-scale projects or structures of high economic or strategic value. Furthermore, the pursuit of higher precision generally leads to increased equipment costs, which limits the practical dissemination of these techniques in routine inspections and preventive maintenance programs. Consequently, relatively few studies have focused on the use of portable or low-cost scanning systems for structural monitoring, particularly with respect to the detection and evaluation of pathological manifestations such as fissures and cracks.
This study is derived from the master’s dissertation of Pereira (2023) and investigates the application of scanning technique using a portable and low-cost device based on the structured light principle for pathology and civil structured health monitoring in controlled environments.
2. State of the art on the crack monitoring
The research carried out by Bento and Parreira (2021) monitored cracks in two single-story residences built with sealing masonry to identify and carry out the evaluation of the type of crack in the building to propose appropriate solutions. For this purpose, a fissurometer and plaster platelets were used. These instruments are commonly employed due to their ease of use. Since it has low resistance and is a fragile material, any movement of the crack will cause seal rupture. Despite the ease of application, it does not allow automation in the process, requiring continuous face-to-face monitoring, which makes it impossible to use in hard-to-reach places, in addition to not being able to be used outdoors due to the great reactivity of the plaster with water.
Da Silva, Da Silva Junior and Benatto (2015) present in their study the evaluation of cracks in basement beams in three buildings that are under construction, all of which are made of reinforced concrete. For the measurement, a photographic report was made and a fissurometer was used.
According to Alonso (1991), the control with the fissurometer is performed by tracing a system of orthogonal axes that overcomes the fissure in both directions with the aid of a pencil. This procedure should be repeated periodically, noting the date, the horizontal and vertical distances from the origin of the shaft to the crack, and then measuring its opening. The crack meter is a ruler made of acrylic, with a millimeter graduation of 0.05 mm to 1.5 mm, with dimensions of approximately 12.5 cm x 4 cm and 1 mm thick. To use it, it must be positioned in the crack found, so that the corresponding scale of the ruler is identified with the width of the pathology according to NBR 6118 - Design of concrete structures procedure, by Brazilian Association of Technical Standards (2017). The research focused on the quantification of cracks with the crack meter and on the photographic record for the analysis of the causative factors.
Another conventional measuring instrument described in the research by Martins, Pizolato Junior and Belini (2013) is the use of the slide calibrator. These blades have thicknesses ranging from 0.1 mm to 2.0 mm, for their use it is necessary to insert the metal blade into the crack opening. However, this instrument can compromise the process of inspecting the cracks, since the constant insertion of the blades can lead to degradation of the region.
The work done by Lima (2019) uses the digital caliper to classify the openings of the cracks present in a residential building in Mossoró (Brazil). The digital caliper, which is a conventional dimensional instrument with a better resolution, where there is a need to perform manual positioning on the crack and which presents the readings of the respective openings directly on the instrument display. For this work, a Digimess digital caliper with a resolution of 0.01 mm was used, with this equipment openings ranging from 1.33 mm to 6.24 mm were found, and it was possible to determine that the openings were in an advanced stage, being classified as fissures and cracks.
Another widely used instrument is the tri-orthogonal joint gauge. This equipment is used to monitor cracks or contraction joints between pile caps, measuring the relative displacements between two adjacent pile caps of a dam according to three directions orthogonal to each other (Veloso et al. 2007). According to Frazão (2002), the tri-orthogonal meters consist of two metal rods with a base system of readings, installed in different blocks, the displacements between the rods are measured by means of dial indicators or micrometers. The dial indicator used must have a reading field of around 10 mm and a sensitivity of 0.001 mm, which means, if well operated, an accuracy of around ± 0.01 mm (Silveira 2003).
The work carried out by Ribeiro et al. (2020) proposes a methodology to inspect cracks and other pathological manifestations detected in reinforced concrete by photogrammetric techniques using an unmanned aerial vehicle with a camera attached. The research was carried out following four steps: the reconnaissance and preparation of the area, the collection of images using UAVs (Unmanned Aerial Vehicle), the processing of the images and the integration with BIM (Building Information Modeling). The model used was the DJI Matrice 600 Pro. The site studied was a tower in the city of Porto in Portugal, where about 3,650 photos were collected manually with a minimum overlap of 60% at intervals of 1m in height, and the distance between the UAV and the tower shaft varying from 5 m to 10 m. At the same time, a topographic survey of the control points was carried out by means of a total station.
Recent advances in crack detection have focused on integrating photogrammetry and deep learning for three-dimensional reconstruction. Majidi et al. (2023) proposed a framework combining DeepLabv3+ and Structure-from-Motion (SfM) to generate dense and scaled point clouds, enabling accurate 3D representation of cracks. The results demonstrate improved detection reliability and geometric accuracy, achieving sub-millimetric precision when supported by ground control points and scale bars.
Recent studies have also explored multi-scale and robotic approaches to improve crack detection and measurement. Alamdari and Ebrahimkhanlou (2024) developed a robotic framework integrating computer vision, laser scanning, and LiDAR-based point clouds. Their method uses convolutional neural networks to identify regions of interest, followed by high-resolution scanning for detailed crack characterization. This multi-resolution approach enables the creation of accurate digital models, enhancing structural assessment while optimizing data acquisition.
In summary, the techniques presented in the literature review share the common objective of identifying, quantifying, and monitoring cracks in different types of civil structures. Most of these approaches are based on conventional, contact-based instruments or manual visual inspections, which require continuous monitoring, and significant human intervention. Such characteristics limit automation and reduce repeatability. In this context, the proposed method advances crack detection by adopting a non-contact and automated approach, based on point cloud acquisition and processing, enabling non-contact inspections with greater spatial coverage and safety. Additionally, the method allows systematic data storage, accurate quantification, and temporal comparison of crack evolution, thereby improving efficiency, reliability, and objectivity when compared to traditional inspection techniques.
3. Materials
3.1 Printer 3D Creality CR-10 V2
It uses FDM (Fused Deposition Modeling) technology, manufacturing the parts from fusion modeling and layer-by-layer deposition, usually using thermoplastic material as raw material. Its maximum print volume is 300 mm x 300 mm x 400 mm and its resolution ranges from 0.4 mm to 0.1 mm. It consists of a heated table that can reach up to 100°C, an extruder that can reach 250°C and a triangular structure that has a traction arm that ensures the stability of the Z axis (Creality 2020).
3.2 Laser Interferometer HP10766A
It works similarly to the Michelson interferometer, built in 1880 with the principle of optical interference, in which they are used to determine short distances with high precision, and can also be used to define the meter (Faggion 1993). This interferometric system works with two frequencies and is used to perform displacement measurements. Its technical specifications are: Laser beam characteristics: helium-neon type, wavelength in a vacuum of 632.991 nanometers, warm-up time of less than 10 minutes, and laser beam diameter of 6 mm; Environmental conditions: operating temperature from 0°C to 40°C and relative humidity from 0% to 95%; Maximum travel speed: 18,000 mm/min; Temperature influence: for temperatures of 20°C ± 0.5 the error in the distance measured by the interferometer is ± 0.1 ppm.
3.3 Scanner EinScan-SE
Its system consists of two stereo cameras (right and left) and a white light projector (LED - Light-Emitting Diode). The device projects structured white light patterns onto the target surface and uses the two cameras to capture the reflected patterns, enabling depth calculation and the generation of a three-dimensional point cloud of the scanned surface.
The EinScan-SE scanner operates in fixed and automatic scanning modes, with alignment performed either through object geometry (for complex details), via a rotary table, or manually. The cameras have a resolution of 1.3 megapixels and the recommended working distance ranges from 290 mm to 480 mm. The equipment presents a single-shot accuracy of up to ±0.1 mm and a point spacing ranging from 0.17 mm to 0.2 mm. The minimum scanning volume is 30 mm × 30 mm × 30 mm, while the maximum scanning volume reaches 700 mm × 700 mm × 700 mm in fixed mode and 200 mm × 200 mm × 200 mm in automatic mode. A single capture covers an area of approximately 200 mm × 150 mm. Data acquisition time is less than 8 seconds per scan in fixed mode and under 2 minutes in automatic mode. (Shining 3D 2019).

3.4 3D Scanner Pro 1.0
This system consists of two cameras (right and left) and an infrared projector. Using the principle of stereo perception employs the two cameras to calculate the depth of the object, while projecting an infrared light and using the principle of machine learning to reconstruct the object in 3D and create a point cloud. The scanner uses an Intel RealSense module with image resolution of 640 × 480 pixels at 30 frames per second (30 fps), which determines the data acquisition rate during scanning. It has four scanning modes, namely: object (600 mm x 600 mm x 300 mm), head (800 mm x 500 mm x 800 mm), body (1000 mm x 1000 mm x 2000 mm), and face (around the size of the human face). In general, with a minimum volume of 50 mm x 50 mm x 50 mm and a maximum volume of 1000 mm x 1000 mm x 2000 mm. And its operating range of 30 cm to 50 cm from the object to be scanned, depending on mode and object size. (XYZPrinting 2019).

4. Methodology
4.1 Construction of the prototypes for testing
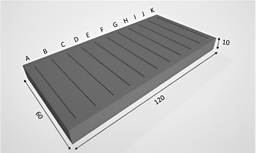
To carry out this experiment, the first step was the creation of the prototypes in the free software Tinkercad from the Autodesk company and exported to STL (Standard Tessellation Language) format. Five prototypes were created, where the first one aims to simulate cracks of different thicknesses and depths (Figure 3), in Table 1 the values of the thicknesses and depths of the cracks in the project are presented.

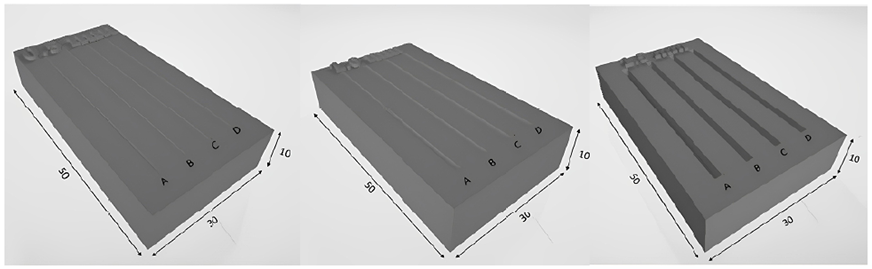
Prototypes 2, 3 and 4 aim to evaluate the behavior of the scanners in relation to cracks of the same thickness, but with different depths (Figure 4). In Table 2 are the values of the thickness and depths of the cracks.

Prototype 5 aimed to simulate cracks closer to reality with a random layout and different thicknesses, although it presents several cracks, five were chosen to be measured. Figure 5 shows in millimeters the dimensions of the design of prototype 5, while Table 3 shows the values of the thickness and depths of the cracks in the project.

Then, the prototypes were printed on the Creality CR-10 V2 3D printer, in the thermoplastic material PLA (Polylactic Acid), considered the most sustainable filament, because it is non-toxic and biodegradable, but it is not recommended for parts with exposure to temperatures around 60°C or that require mechanical resistance (Besko, Bilyk and Sieben 2017). The printing was carried out with the extruder at 200°C and the flatbed at 50°C, with 30% filling of the Cubic type.
After the impressions, central lines were drawn on all the prototypes so that during the next stages the same points would be used as references for the execution of the measurements.
4.2 Calibration of the prototypes
The nominal values of crack thickness and depth defined in the design stage were considered as initial reference parameters. However, due to possible dimensional variations introduced during the 3D printing process, these values were subsequently verified through calibration using a laser interferometer, which was adopted as the reference standard for accuracy assessment.
Following this, the prototypes were calibrated using the HP 10766 A laser interferometer, to determinate the actual thickness after printing, according to the procedure described below.
The experiments were conducted on two different days, on the first day the calibration of prototype 1 was performed and on the second day the other ones. Firstly, the room was acclimatized, where the temperature in which the environment was measured by means of a thermometer present at the time of the measurements, the temperature was 21.6°C on the first day and 20.5°C on the second.
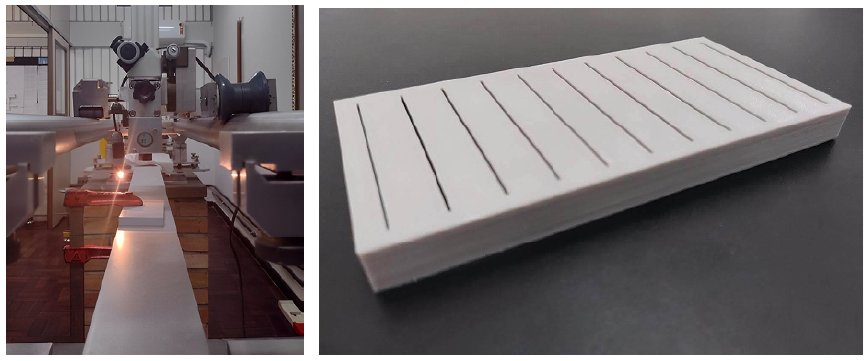
To start the process, the prototypes were positioned one by one horizontally on the aluminum hollow bar that serves as support for the objects to be measured, where they were adjusted and attached to the support by means of a table clamp, as can be seen in Figure 6 below.

Then the interferometer and the lighting were turned on, and the equipment was configured so that the display would show the value with a precision of a hundredth of a millimeter. In addition, the height of the bezel was adjusted so that the maximum focusing capacity was reached for reading. The focus of the spotting scope is the region where light waves meet to form a precise and clear image. In an aiming system, adjusting focus involves adjusting the wavelength of the light and the alignment of the beams so that they intersect at a specific point. This is important to ensure that the image formed is sharp and allows for accurate measurement. As the accuracy of aiming using a scope is directly related to the quality of the focus, it is important to ensure that it is always set correctly before taking a measurement.
4.3 Point cloud acquisition
To carry out the measurements, the trolley located on the rail slowly moved on its surface until the first crack is visible in the bezel. From there, the aim of the bezel was adjusted to ensure a clear and accurate view of the fissure. Then, the vertical wire of the reticles touches the right of the crack, and the reading is performed. Subsequently, the trolley is moved until the vertical wire of the reticle touches the crack on the left side. With this information obtained from the display of the interferometric system and the values obtained were recorded. The process was carried out by means of three series of readings for all cracks in the specimen. Next, the average of the crack thickness values of the specimens were calculated. Thus, the calibrated measurements obtained from the interferometer were used as the reference values for evaluating the accuracy of the scanning systems.
For the last step, the acquisition of the point cloud was performed using the EinScan-SE and the 3D Scanner Pro 1.0, following the steps described below with each of the scanners, respectively.
Since the filament used to print the prototype is thermosensitive, both tests were conducted on the same day. Room temperature was monitored using a thermometer, and the temperature variation during the tests remained below 0.3 °C.
For the EinScan-SE, before starting the process, the instrument was calibrated and the white balance test was performed, and then the prototypes were positioned on the support for the calibration panel in the center of the digitizer’s turntable. For scanning, the automatic mode with texture capture was used, with the HDR (High Dynamic Range) function turned on and with 10 steps.
After the end of the process, the point cloud was saved in STL format, this format describes the surfaces of the object through the vertices that compose each of its faces, without representation of color, texture or attribute, usually using triangles. The result of the point cloud of prototype 1 can be seen in Figure 7 below.

For the 3D Scanner Pro 1.0, the same process described above was performed, where the prototypes were positioned on the support for the calibration panel in the center of the digitizer turntable, to be under the same conditions. The head function was chosen, and the scanner was connected to the notebook, where the scanning process was started, as these are small specimens the scan lasted less than 1 minute.
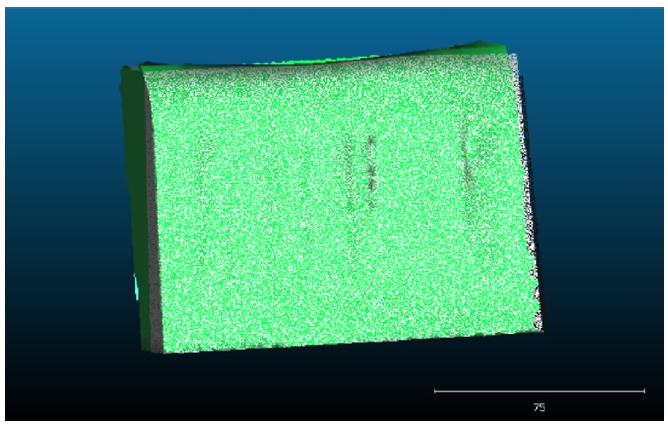
Once processing was completed, the point cloud was saved in PLY (Polygon File Format), in this format the files are described by a collection of vertices and faces, along with properties such as color and normal direction. The result of the point cloud of prototype 1 can be seen in Figure 8 below.

To determine the thicknesses obtained by the point cloud by both scanners, the files in STL format were opened in the free software CloudCompare, which allows the manipulation of point clouds. However, it was not possible to perform these measurements for the 3D Scanner Pro 1.0, as the cracks could not be clearly identified in the resulting data.
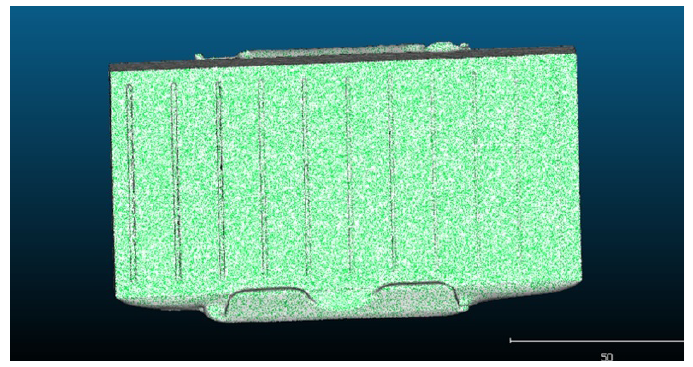
For the EinScan-SE, the process began by identifying the horizontal line drawn on the object, serving as reference to facilitate data collection and obtain the thickness measurement at the same point. With the select 2 points function of CloudCompare’s pick point tool, a point was selected at each end of the crack, and the distance was automatically calculated (Figure 9). All measurements were rounded to a hundredth of a millimeter.

5. Results
The comparative analysis of the data obtained from the two three-dimensional scanning systems revealed significant differences in their ability to extract reliable metric information. It was verified that the 3D Scanner Pro 1.0 did not provide sufficient spatial resolution or point density to enable the clear identification of cracks in the analyzed prototypes. As a result, the extraction of quantitative measurements from the point clouds generated by this device was not feasible, rendering it unsuitable for the metrological objectives of this study.
Consequently, only the point clouds acquired using the EinScan-SE scanner were considered for dimensional and metrological analyses. These point clouds exhibited high geometric definition, allowing accurate identification of crack edges and direct measurement of crack widths using CloudCompare software.
Regarding point cloud density, a marked disparity was observed between the two scanning systems, with the EinScan-SE achieving an average density of approximately 40 points per mm², while the 3D Scanner Pro 1.0 produced only about 0.17 points per mm². This pronounced disparity explains the inability of the portable scanner to represent cracks with openings smaller than 10 mm and highlights the superior performance of the structured-light technology employed by the EinScan-SE for high-resolution applications.
The values obtained from the EinScan-SE point clouds were subsequently compared with the reference measures acquired using the laser interferometer, enabling the assessment of the accuracy and consistency of the proposed method.
To this end, the differences in absolute value found between the two readings were calculated, as shown in Table 4, Table 5, Table 6, Table 7 and Table 8, respectively.
6. Discussion
In the experiment, point clouds of 3D-printed crack specimens with predefined geometries and calibrated dimensions were acquired under controlled laboratory conditions, which minimized the variation of environmental factors such as temperature variation, texture, illumination, angle of incidence of the object and scanning speed. This controlled setup allowed the evaluation to focus primarily on the intrinsic capabilities of each scanning technology, reducing external sources of uncertainty commonly reported in field-based studies.
The results obtained in this study demonstrate that the effectiveness of point cloud-based crack monitoring is strongly dependent on the scanning technology employed, particularly in terms of spatial resolution and point density. The structured-light scanner (EinScan-SE) consistently produced high-density point clouds, enabling precise identification of crack edges and reliable measurement of crack widths when compared to the reference values obtained with a laser interferometer.
In contrast, the performance limitations observed in the portable low-cost scanner (3D Scanner Pro 1.0) corroborate findings reported in earlier research, where reduced point density and lower spatial resolution were identified as critical constraints for detecting small-scale defects. These limitations become particularly significant in the context of early-stage crack detection, where sub-millimetric features must be resolved. Therefore, the results reinforce the consensus in the literature that the selection of scanning technology must be aligned with the required level of geometric detail.
7. Conclusions
A clear pattern emerged regarding the relationship between crack thickness and scanner performance. Cracks with openings as small as approximately 0.5 mm were successfully detected and measured using the structured-light scanner, whereas the portable low-cost scanner (3D Scanner Pro 1.0) failed to adequately represent cracks with widths below approximately 10 mm. This limitation is directly associated with the significantly lower point density generated by the portable scanner, which proved insufficient to capture fine geometric discontinuities. These findings reinforce that crack thickness plays a critical role in detectability and that high-resolution data acquisition is essential for early-stage crack identification.
The comparison between the two scanning systems highlights an important trade-off between portability, cost, and measurement capability. While portable scanners may be attractive due to their lower cost and ease of use, their limited spatial resolution restricts their applicability for metrological analysis of cracks. In contrast, structured-light scanning technology offers a balanced solution, providing high accuracy at a lower cost and operational complexity than terrestrial laser scanning systems, thus expanding its potential for routine inspections and preventive maintenance programs.
Another relevant observation concerns the stability of measurements across different crack depths. The results indicate that, for a given crack thickness, variations in depth did not significantly affect the measurement accuracy obtained from the point clouds. This suggests that crack width, rather than depth, is the dominant geometric parameter influencing measurement reliability when using surface-based scanning techniques.
From a methodological perspective, the use of 3D-printed prototypes with known dimensions, calibrated by a laser interferometer, proved to be an effective strategy for evaluating scanner performance under controlled conditions. This approach allowed a robust assessment of measurement accuracy and provided a reliable framework for comparing different scanning technologies.
Overall, the findings confirm the feasibility of using structured-light point cloud acquisition as a non-contact, automated, and accurate method for crack monitoring in controlled environments. The results also emphasize that the selection of scanning equipment must be guided by the required level of detail and the minimum crack width of interest. Future research should investigate the performance of structured-light scanners under field conditions, including variable lighting, surface roughness, and material properties, as well as explore the integration of point cloud-based crack monitoring with automated detection algorithms and long-term structural health monitoring systems.
As a recommendation for future work, it is suggested to explore the use of photogrammetric point clouds generated from smartphone images and to apply the proposed methodology in real-world scenarios using UAV platforms equipped with LiDAR sensors and/or image-based data. Further studies should also evaluate the performance of these approaches under varying environmental conditions and their integration with automated crack detection algorithms and structural health monitoring systems.
ACKNOWLEDGEMENT
We extend our thanks for the financial support from the Coordination of Improvement of Higher Education Personnel - Brazil (CAPES) - Finance Code 88887.600891/2021-00.
REFERENCES
- ALAMDARI, Ali Ghadimzadeh; EBRAHIMKHANLOU, Arvin. Multi-scale robotic scanning of surface cracks in concrete structures. In:Nondestructive Characterization and Monitoring of Advanced Materials, Aerospace, Civil Infrastructure, and Transportation XVIII SPIE, 2024. p. 197-203.
- Alonso, UR (1991) Previsão e Controle das Fundações São Paulo: Edgard Blucher.
- Associação Brasileira de Normas Técnicas (2017) NBR 13755: Revestimentos cerâmicos e paredes externas com utilização de argamassa de fachada colante - Desempenho
- Bento M, Parreira M. (2021) Monitoramento e identificação de causas de fissuras, trincas e rachaduras em alvenaria [Final term paper, Centro Universitário UNA de Catalão.
- Besko M, Bilyk C, Sieben PG (2017) Aspectos técnicos e nocivos dos principais filamentos usados em impressão 3D. Gestão, Tecnologia e Inovação, 1,3:9-18
-
Bueno RFA (2007) Monitoração, por GPS, de deslocamentos em estruturas com carga dinâmica Thesis, Universidade de São Paulo. https://doi.org/10.11606/T.3.2007.tde-08012008-144719
» https://doi.org/10.11606/T.3.2007.tde-08012008-144719 - Chrzanowski A, Avella S, Yong-Qi J, Secord JM (1992) Report on existing resources, standards, and procedures for precise monitoring and analysis of structural deformation United States Army Topographic Engineering Center.
-
Creality (2020) Impressora 3D Creality CR- 10. Products Shenzhen. Available at: <Available at: https://www.creality.com/pages/products?collection=CR+Series&spm=..index.header_1.1 > [Accessed 15 June 2024].
» https://www.creality.com/pages/products?collection=CR+Series&spm=..index.header_1.1 - Da Silva JA, Da Silva Junior LC, Benatto PR (2015) Fissuras em vigas de concreto armado em subsolos de edifícios na cidade de Maringá. Encontro Internacional de Produção Cientifica da Unicesumar
-
Erol B (2010) Evaluation of high-precision sensors in structural monitoring. Sensors https://doi.org/10.3390/s101210803.
» https://doi.org/https://doi.org/10.3390/s101210803 -
Faggion PL (1993) Contribuição para implementação de um sistema de aferição de miras na UFPR [Matership Dissertation, Universidade Federal do Paraná.] Acervo Digital da UFPR. https://acervodigital.ufpr.br/handle/1884/34658
» https://acervodigital.ufpr.br/handle/1884/34658 -
Ferreira GH (2020) Fissuras em edificações de concreto armado: revisão e estudo de caso [Final term paper, Universidade Federal de Ouro Preto.] Biblioteca Digital da UFOP https://monografias.ufop.br/handle/35400000/2706
» https://monografias.ufop.br/handle/35400000/2706 - Frazão SM (2002) Avaliação de instrumentos para auscultação de barragem de concreto. Estudo de caso: deformímetros e tensômetros para concreto na barragem de Itaipu [Mastership Dissertation, Universidade Federal do Paraná.]
-
Han J, Guo J, Jiang Y (2013) Monitoring tunnel deformations by means of multi- epoch dispersed 3D LiDAR point clouds: An improved approach. Tunnelling and Underground Space Technology https://doi.org/10.1016/j.tust.2013.07.022
» https://doi.org/https://doi.org/10.1016/j.tust.2013.07.022 -
Helming P, Von Freyberg A, Sorg M, Fischer A (2010) Wind Turbines Tower Deformation Measurement Using Terrestrial Laser Scanning on a 3.4 MW Wind Turbine. Energies https://doi.org/10.3390/en14113255
» https://doi.org/https://doi.org/10.3390/en14113255 -
Krakhmal’ny TA, Evtushenko SI, Krakhmal’naya MP (2016) New System of Monitoring of a Condition of Cracks of Small Reinforced Concrete Bridge Constructions. Procedia Engineering https://doi.org/10.1016/j.proeng.2016.07.322
» https://doi.org/https://doi.org/10.1016/j.proeng.2016.07.322 - LAEFER, Debra F. et al. Crack detection limits in unit based masonry with terrestrial laser scanning. Ndt & E International, v. 62, p. 66-76, 2014.
-
Lenartovicz IR (2013) Avaliação da potencialidade do laser scanner terrestre no monitoramento de estruturas: estudo de caso UHE Mauá [Mastership Dissertation, Universidade Federal do Paraná]. Acervo Digital da UFPR. https://acervodigital.ufpr.br/handle/1884/32099
» https://acervodigital.ufpr.br/handle/1884/32099 -
Lima MGH (2019) Diagnóstico de incidências de manifestações patológicas com a utilização de metodologia matriz gut- estudo de caso [Final term paper, Universidade Federal Rural do Semiárido.] Biblioteca Digital da UFERSA. https://repositorio.ufersa.edu.br/handle/prefix/4693
» https://repositorio.ufersa.edu.br/handle/prefix/4693 - MAJIDI, S.; OMIDALIZARANDI, M.; SHARIFI, M. A. Intelligent 3D crack reconstruction using close range photogrammetry imagery. ISPRS Annals of the Photogrammetry, Remote Sensing and Spatial Information Sciences, v. 10, p. 443-450, 2023.
-
Martins AP, Pizolato Junior JC, Belini VL (2013) Método com base em imagem para o monitoramento da abertura de fissura em alvenaria e concreto usando plataforma móvel. Revista IBRACON de Estruturas e Materiais https://doi.org/10.1590/S1983-41952013000300006
» https://doi.org/https://doi.org/10.1590/S1983-41952013000300006 - Martins PA, Junior CP (2011) Inspeção de fissuras em alvenaria utilizando visão computacional. Conferência Brasileira de Dinâmica, Controle e Aplicações
-
Noronha JG (2018) Estudo multicaso de manifestações patológicas em reservatórios de concreto armado na cidade de Tabuleiro do Norte-CE [Final term paper, Universidade Federal Rural do Semiárido.] Biblioteca Digital da UFERSA https://repositorio.ufersa.edu.br/server/api/core/bitstreams/7cfe84f0-c846-414c-91ee-0ac339c6f9e8/content
» https://repositorio.ufersa.edu.br/server/api/core/bitstreams/7cfe84f0-c846-414c-91ee-0ac339c6f9e8/content -
PEREIRA, IS (2023) Aplicação de Nuvens de pontos para o monitoramento de fissuras e trincas em estruturas antrópicas. [Mastership Dissertation, Universidade Federal do Paraná]. Acervo Digital da UFPR. https://acervodigital.ufpr.br/handle/1884/82999
» https://acervodigital.ufpr.br/handle/1884/82999 -
Punko Z, Suman N, Rebolj D (2018) Automated continuousconstruction progress monitoring using multiple workplace real time 3D scans. Advanced Engineering https://doi.org/10.1016/j.aei.2018.06.001
» https://doi.org/https://doi.org/10.1016/j.aei.2018.06.001 -
Ribeiro D, Santos R, Shibasaki A, Montenegro P, Carvalho H, Calçada R (2020) Remote inspection of RC structures using unmanned aerial vehicles and heuristic image processing. Engineering Failure Analysis https://doi.org/10.1016/j.engfailanal.2020.104813
» https://doi.org/https://doi.org/10.1016/j.engfailanal.2020.104813 -
Sánchez-Rodríguez A, Riveiro B, Soilán M, González-de Santos LM (2018) Automated detection and decomposition of railway tunnels from Mobile Laser Scanning Datasets. Automation in Construction https://doi.org/10.1016/j.autcon.2018.09.014
» https://doi.org/https://doi.org/10.1016/j.autcon.2018.09.014 -
Shining 3D (2019) EinScan-SE. 3D Desktop Scanner Available at: <Available at: https://www.einscan.com/desktop-3d-scanners/einscan-se/ > [Accessed 15 June 2024].
» https://www.einscan.com/desktop-3d-scanners/einscan-se/ -
Silva Neto MA, Villwock R, Scheer S, Steiner MTA, Dyminski AS (2010) Técnicas de mineração visual de dados aplicados aos dados de instrumentação da barragem de Itaipu. Gestão & Produção https://doi.org/10.1590/S0104-530X2010000400007
» https://doi.org/https://doi.org/10.1590/S0104-530X2010000400007 - Silveira JFA (2003) Instrumentação e comportamento de fundações de barragens de concreto Oficina de Textos.
- Veloso LACM, Souza RM, Oliveira DRC, Bichara JWB, Luz GM (2007) Alternativas para a automação dos medidores tri ortogonais de junta de barragens de concreto da UHE Tucuruí. Congresso Brasileiro do Concreto
-
XYZPrinting (2019) 3D Scanner Pro 1.0 Available at: <Available at: https://www.bhphotovideo.com/c/product/1331445-REG/xyzprinting_3sh1axus00k_handheld_3d_scanner_1_0.html/overview > [Accessed 17 September 2024].
» https://www.bhphotovideo.com/c/product/1331445-REG/xyzprinting_3sh1axus00k_handheld_3d_scanner_1_0.html/overview

 Source:
  Source:
  Source: The authors.
 Source: The authors.
 Source: The authors.
 Source: The authors.
 Source: The authors.
 Source: The authors.
 Source: The authors.