
 Hierarchical multistep remote sensing classification enhances land use mapping accuracy in anthropogenically modified landscapes
Abstract:
This study addresses the challenge of accurately classifying land use and land cover (LULC) changes in landscapes influenced by anthropogenic activities. By leveraging multi-temporal satellite imagery and a hierarchical multistep classification approach, we enhance the differentiation of LULC transitions, improving model accuracy and environmental monitoring. This study presents an enhanced LULC classification framework that uses multi-temporal satellite imagery and hierarchical, multistep analysis to improve the accuracy of class detection in landscapes. We compare three supervised, pixel-based classification approaches - Single-step, Sequential Binary, and Accuracy-based Binary Classification - across a case study in the Furnas Reservoir Watershed, Southeast Brazil. The Accuracy-based Binary Classification method achieved the highest overall accuracy (87.37%), outperforming the other approaches by prioritizing classes with higher classification accuracy. Seasonal composite imagery and feature-engineering, such as spectral indices and quality mosaics, improved classification precision, particularly in heterogeneous and seasonally variable landscapes. The findings underscore the importance of integrating temporal dynamics in LULC mapping to inform sustainable land management in regions undergoing rapid environmental change.
Keywords:
Remote sensing; spectral indices; landscape monitoring; classification accuracy
1. Introduction
Remote sensing enables the acquisition of spatial information that would be challenging to obtain by other means. This technology allows researchers to visualize, classify, and analyze natural environments, often integrating this data with Geographic Information Systems (GIS) for advanced spatial analyses (Read and Torrado 2009). Sensors capable of capturing multispectral data have proven invaluable for detecting variations across different parts of the electromagnetic spectrum, improving the identification of target objects (Mather and Koch, 2011). Over the past decades, remote sensing data has been extensively used to create land use and land cover (LULC) maps and monitor changes over time (Chang et al., 2018), particularly since the launch of Landsat Satellite 1 in 1972
Accurate classification of LULC is essential for understanding landscape transformation and guiding sustainable development (Dapke et al. 2025). Monitoring LULC dynamics over time is particularly relevant in regions experiencing rapid land cover changes due to human activities such as agricultural intensification, urban growth, and deforestation (Oyedotun, 2019). A reliable LULC classification framework requires integrating historical characteristics of land cover types with spectral and temporal responses from satellite imagery combined with machine-learning methods (Shimabukuro et al., 2023; Zhong et al., 2018). In this sense, incorporating multi-temporal satellite data enhances the ability to distinguish among dynamic land cover classes, thereby improving classification accuracy.
Enhanced LULC classification demands the incorporation of a myriad of informative and discriminative features of local and neighboring intrinsic characteristics hidden within the spectral data to improve model performance, especially when temporal dynamics of LULC are most driven by anthropogenic factors (Heidarianbaei, Kanyamahanga and Dorozynski, 2024; Raj, Rawat and Tripathi, 2024). For example, remote sensing indices such as the Normalized Difference Vegetation Index - NDVI (Tucker, 1979), Normalized Difference Built-up Index - NDBI (Zha, Gao and Ni, 2003), and Modified Normalized Difference Water Index - MNDWI (Xu, 2006) provide targeted information on vegetation health, urbanization, and water bodies, respectively. Additionally, spatial statistics capture local variability, refining the representation of heterogeneous landscapes (Wang et al., 2024).
Seasonal composites, which aggregate multi-temporal satellite imagery into defined periods aligned with a region’s wet and dry seasons, are particularly effective in capturing temporal variations and phenological patterns. This approach is crucial for distinguishing dynamic land cover types such as agricultural fields, forests, and water bodies that can present changes within a period of time (Griffiths, Nendel and Hostert, 2019). When combined with climate data, feature engineering, which allows for manipulations and transformations of seasonal composites, climate correlations, and spatial statistics, can reveal unexpected patterns that deviate from typical seasonal trends. For instance, correlating precipitation data with NDVI enables the differentiation between rainfed and irrigated agriculture, as irrigated fields maintain higher vegetation activity during dry seasons (Ozelkan, Chen and Ustundag, 2016). However, incorporating ancillary data such as climate time series into LULC frameworks requires greater computing capacity.
In this sense, cloud computing platforms, such as Google Earth Engine (GEE), have revolutionized remote sensing by providing scalable infrastructure for processing and analyzing large geospatial datasets (Xu et al., 2022). These platforms facilitate systematic image selection, allowing users to extract the most representative data for each class. For example, prioritizing peak vegetation growth periods in agricultural areas improves the distinction between different crop types or management practices (Ghosh, Nanda and Sarkar, 2022). Similarly, in urban regions, selecting images with maximum reflectance in the NDBI effectively delineates built-up zones while minimizing interference from mixed pixels or shadows (Zhang et al., 2020). This target selection helps reduce classification noise, ensuring higher reliability in complex landscapes.
Building on these advancements, this study develops an enhanced LULC classification framework that leverages multi-temporal satellite imagery with feature-engineered data in a hierarchical multistep analysis. Previous research has demonstrated the benefits of hierarchical classification systems for stratifying landscapes into zones (Ojwang et al., 2024) and systematically selecting images based on the spectral and temporal characteristics of LULC classes, prioritizing simpler classes before addressing more complex ones (Shimabukuro et al., 2023).
We introduce and apply a case study for this analysis approach, which involves breaking down the classification process into multiple levels or steps, each focusing on different aspects or scales of the data. This is particularly useful in complex landscapes where gradual transitions between LULC categories occur. The hierarchical method allows for detailed, accurate, and consistent classification by integrating various data sources and classification techniques. Here, we would first prioritize the most accurate classes to reduce error propagation in subsequent classifications. This is based on the premise that feature-engineered data specifically targeted to class-level classification can overcome the general approach of classifying all classes in one model. The approach will support identifying and understanding seasonal land cover changes, contributing to more informed and effective environmental management practices.
2. Materials and Methods
2.1 Study Area
The Furnas Reservoir Watershed covers approximately 52,000 km² and extends across the states of Minas Gerais (MG) and São Paulo (SP) in Southeast Brazil (Figure 1). It is part of the Grande River Basin, one of the main tributaries of the Parana River (Mello et al., 2021). Institutionally, there is a Water Resources Planning and Management Unit consisting of the Furnas surface surrounding municipalities (IGAM, 2012). However, considering all the reservoir drainage areas, the Furnas Reservoir Watershed encompasses, fully or partially, over 160 municipalities with an estimated population of almost 3 million people (IBGE, 2023). According to the Köppen classification, the predominant climates are Cwb (temperate with dry winters and warm summers) and Cwa (temperate with dry winters and hot summers) (Kottek et al., 2006).
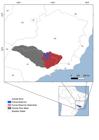
This watershed is an important area primarily because of hydroelectric production from the Furnas Hydropower Plant, which accounts for a significant portion of Brazil’s energy sources. Despite this stable supply, it is characterized by its highly dynamic and heterogeneous environment. The diversity of terrain physiographical aspects and dense drainage network contribute to the complexity of land uses, with rainforest areas, pastures, and agricultural areas in proximity. Although primarily used for hydropower generation, the reservoir also supports agricultural activities, which are highly reliant on irrigation (Dias et al., 2018). In addition to that, tourism around Furnas Lake is another significant economic driver, attracting visitors to the region’s natural and recreational resources (Melo et al., 2022).
The diverse land uses, coupled with ongoing changes driven by human activities, pose significant challenges for land management and environmental conservation. The region experiences pressure from expanding agricultural frontiers, particularly coffee culture and livestock grazing, which drive landscape changes (Leite et al., 2022; Compri et al., 2016). These dynamics make the Furnas Reservoir Watershed a key area for implementing remote sensing techniques and LULC classification models, enabling the monitoring of landscape changes and supporting sustainable land use stewardship in this sensitive and economically vital region.
2.2 Methods
This study compares three approaches to LULC mapping and evaluates their effectiveness within a defined area of interest. We also applied feature engineering to derive new data from Sentinel-2 multispectral bands to improve LULC classification tasks. The approaches are as follows: 1) a single-step classification of all LULC classes (Single-step Classification); 2) a binary classification method (Sequential Binary Classification) as proposed by Shimabukuro et al. (2023); and 3) a hierarchical approach considering class-specific classification accuracy (Accuracy-based Binary Classification) (Figure 2).
2.2.1 Data Preprocessing
The primary data sources for this study are harmonized Sentinel-2 imagery (ESA, 2015) and precipitation data from the CHIRPS - Climate Hazards Group InfraRed Precipitation with Station dataset (UCSB, n.d.) from 2023. Sentinel-2 harmonized imagery, available in GEE`s collections, provides high-resolution multispectral data with a spatial resolution of 10 meters and a revisit time of five days. This temporal frequency, combined with its fine spatial detail, enables the capturing and monitoring of environmental dynamics over time (Phiri et al., 2020). The precipitation data from CHIRPS is also available in GEE`s collections and delivers a long-term, quasi-global precipitation record spanning over 35 years and 0.05-degree spatial resolution.
To measure the relationship between rainfall and LULC, we calculated a Pearson correlation coefficient between monthly precipitation data from the CHIRPS dataset and the median NDVI values from the subsequent month for the Sentinel-2 images. The Sentinel-2 imagery was processed to include bands B2, B3, B4, B5, B6, B7, B8, and B11. Several spectral indices were calculated for each image (Table 1).

To account for seasonal LULC variations, we generated seasonal composite images by grouping Sentinel-2 imagery into four distinct three-month periods of 2023: January to March, April to June, July to September, and October to December, getting the median pixel value inside each season. Then, standard spatial statistics were calculated over a 5x5 window pixel neighborhood for each feature to capture local variability in the spectral response. These statistics included the mean, standard deviation, maximum, minimum, and percentiles (25th and 75th) of the spectral data, allowing the model to account for spatial context within each pixel.
Labeled samples were obtained by photo interpretation of high-resolution images available at Google and Esri base maps (Zhao et al., 2014) and Sentinel-2 images. A total of 2,400 sample points equally distributed within eight classes were collected: water, forest, pasture, coffee, eucalyptus forestry, urban areas, agriculture, and natural grasslands.
2.3 Single-step Classification
The single-step classification approach used in this study involved classifying all LULC classes in a single process using a Random Forest (RF) method. Random Forest is a machine learning method that combines multiple decision trees to improve accuracy and reduce overfitting, making it reliable for classification and regression tasks (Salman, Kalakech and Steiti, 2024).
The RF classifier was trained using training (70%) and validation (30%) sample sets randomly selected from the labeled data. A range of values for two key parameters - number of decision trees and bagging fraction - was tested to optimize the model’s performance. The model was evaluated using the validation dataset for each combination of parameters, and the combination that produced the highest accuracy was selected. A median composite was derived from the available features for each season, ensuring that representative data were selected for them.
Once trained, we applied the optimized RF model to classify the entire area of interest. A 5x5 mode filter was used to smooth the classified image, reducing noise and improving the consistency of the classification.
2.4 Mapbiomas project
The MapBiomas Project (https://mapbiomas.org) adopts a single-step classification approach, where all land use and land cover (LULC) classes are classified in a single process using the Random Forest (RF) algorithm. Training samples were collected based on expert knowledge, reference datasets, and existing classifications. The model was trained to distinguish different land cover types by analyzing spectral, temporal, and textural features extracted from the Sentinel-2 images. The classification process is automated using Google Earth Engine (GEE) and post-classification refinements were made to ensure consistency across time and space.
By using this classification approach, the MapBiomas Project enables continuous monitoring of land cover changes at national and regional levels. The resulting data support environmental research, conservation planning, and policy development, contributing to land management and decision-making processes. We used Collection 9 of the MapBiomas project within this study.
2.5 Binary Classification
For each land cover class, binary classifications were performed using user-specified attributes that are particularly relevant to each class. In Google Earth Engine, the qualityMosaic function generates mosaics by selecting the pixel with the highest value for a specified attribute within the image collection. This selection was made within each seasonal composite.
First, the MNDWI was employed to create a quality mosaic for water bodies class, leveraging its high sensitivity to water and its capacity to reduce interference from built-up areas. Quality mosaics are built in GEE by retrieving pixel data from an image within a collection of images based on the maximum occurrence of a user-specified attribute; in this case, the MNDWI index. Next, we used the NDVI to construct quality mosaics for vegetation classes, including eucalyptus, forest, agriculture, pasture, natural grasslands, and coffee, as it effectively highlights variations in vegetation health and density. Lastly, the NDBI was used to construct high-quality mosaics and to classify urban areas, emphasizing built-up regions and facilitating their differentiation from other land cover types.
2.5.1 Sequential Binary Classification
The second approach follows the methodology outlined by Shimabukuro et al. (2023). This method employs a sequential binary classification process where each LULC class is classified individually, one at a time. This approach trains a specific binary classifier for each land cover class, distinguishing it from the rest of the dataset. After each binary classification, the correctly classified pixels are masked out from the remaining dataset, allowing the subsequent classifiers to work only on the unresolved classes.
2.5.2 Accuracy-based Binary Classification
The third approach, so-called hierarchical, modifies the sequential binary classification by reordering the classification sequence based on the accuracy of each LULC class. The classes were ranked according to the accuracy of the RF classifier trained for each class. Classes with the highest accuracy were classified first, with subsequent classifications proceeding in descending order of accuracy. By prioritizing classes with higher classification confidence, this approach aimed to minimize the propagation of classification errors in later stages.
2.6 Validation and Accuracy Assessment
Firstly, it is worth considering the calculation of the sample size (n), based on more recent works, such as the articles by See et al. (2017), Martínez et al. (2025), and Reinosch et al. (2025), where these authors apply the following equation (1). based on the Cochran statistical method (Foody, 2009; Stehman, 2009; Congalton and Green, 2019; Stehman and Foody, 2019).
Where: = normal function with confidence level α/2;
p = probability of success;
q = probability of error;
E = error
In this research, the following parameters were applied, considering that the criteria for producing thematic cartography were very rigorous. Therefore, the following values were applied:
= 1,96 (confidence level of 95%); p = 0,95; q = 0,05 and E = 0,025, which implies the value of n = 400 samples.
Subsequently, this suggested sample value was distributed proportionally to the areas. We assessed the classification performance for all three approaches with an independent test dataset. AcATaMa Plugin in QGIS (Llano, 2024) was used to create test samples through stratified random sampling, and the classification accuracy was evaluated by calculating the kappa coefficient. In the AcaTaMa plugin, the test sample size by class (ni) was calculated according to Equation 2 for each class stratum (Cochran, 1977; Olofsson et al., 2014; Finegold and Ortmann, 2016).
In which: ni= sample size by class; W i = proportion of the mapped area of class i; S i = standard deviation of stratum i; S(Ô)= expected standard deviation of the overall accuracy (the value of S(Ô)= 0.01 was assumed).
Equation 3 describes how the standard deviation of the stratum (S i ) of each class was calculated according to the user accuracy values (U i ).
3. Results
Below are the results for each approach: the Single-step Classification, Sequential Binary Classification, Accuracy-based Binary, and the Mapbiomas Project evaluation (Figure 3).
3.1 Single-Step Classification
The single-step classification approach yielded an overall accuracy of 0.78. The highest user’s accuracy (1.0) was observed for Water (C1) and Grassland Formation (C7), while Forestry (C2) and Agriculture (C3) had the lowest user’s accuracy of 0.56 and 0.71, respectively. The Producer’s Accuracy varied across classes, with Water (C1) achieving perfect classification (1.0), while Grassland Formation (C7) showed the lowest producer’s accuracy (0.49) (Table 2).

Classification results for: a) Sequential Binary Classification; b) Accuracy-Based Binary Classification; c) Single-Step Classification; d) MapBiomas Product.
3.2 Sequential Binary Classification
The sequential binary classification approach improved the overall accuracy to 0.81. The user’s accuracy for most classes increased, with Water (C1) and Grassland Formation (C7) maintaining perfect user accuracy of 0.92 and 1.0, respectively. The producer’s accuracy improved in Agriculture (C3) (0.80) and Forest (C5) (0.84) compared with the single-step classification. However, Forestry (C2) had a significantly low user’s accuracy (0.24), indicating persistent misclassification (Table 3).
3.3 Accuracy-Based Binary Classification
The accuracy-based binary classification demonstrated the highest overall accuracy (0.87). The user’s accuracy was consistently high for most classes, with Agriculture (C3) achieving 1.0 and Forest (C5) achieving 0.96. The producer’s accuracy improved for Urban Area (C6) (1.0) and Coffee (C8) (0.96), highlighting the effectiveness of this approach in reducing misclassification. The lowest user’s accuracy was observed for Urban Area (C6) (0.43), indicating continued challenges in accurately classifying urban regions (Table 4).
3.4 MapBiomas Product
The MapBiomas classification resulted in an overall accuracy of 0.79. The user’s accuracy was highest for Water (C1) (1.0) and Forest (C5) (0.95), while Mosaic of Uses (C9) (0.59) showed considerable classification challenges. The producer’s accuracy was relatively high for Pasture (C4) (0.95) and Mosaic of Uses (C9) (1.0), but lower for Coffee (C8) (0.42) and Grassland Formation (C7) (0.39), indicating difficulty distinguishing these classes from others (Table 5).
3.5 Classification Performance
Among the four classification approaches, water was consistently mapped with perfect accuracy. Forestry had the lowest user`s accuracy, particularly in Sequential Binary Classification (0.24), where it was often misclassified as pasture or other vegetation, but improved in Accuracy-based Binary Classification (0.58) and MapBiomas (0.75). Agriculture had a user`s accuracy of 0.71 in Single-step Classification but reached 1.0 in Accuracy-based Binary Classification, suggesting that refining classification steps reduced confusion. Pasture had a user`s accuracy above 0.72 in all methods and reached 0.94 in Accuracy-based Binary Classification. Urban areas showed more variation, with users’ accuracy from 0.43 (Accuracy-based) to 0.80 (MapBiomas), indicating challenges in differentiating built-up areas. Grassland formation had a user`s accuracy of 1.0 in Single-step and Sequential Binary Classification, but dropped to 0.79 in MapBiomas, likely due to misclassification as pasture. Coffee classification also varied, with the highest user`s accuracy in Single-step Classification (0.84). Producer’s accuracy followed similar trends, with Accuracy-based Binary Classification improving classification for agriculture (0.75), pasture (0.93), and coffee (0.96).
3.6 Feature importance
For the Single-step Classification, the feature 0_B8_max - which captures the maximum local reflectance in band B8 during the January-to-March period - was identified as the most critical predictor. This was followed by 0_B6_p25 and 1_mndwi_mean, stressing the importance of early seasonal dynamics and specific spectral indices. Moreover, the top twenty features included a diverse set of descriptors, including the precipitation correlation variable, which indicates its relevance across classes (see Figure S1).
In the Accuracy-based Binary Classification, distinct top features were determined for each of the eight land cover classes. For instance, the Forestry class was best characterized by 3_B2_stdDev, the Agriculture class by 0_bsi_p25, and the Urban class by correlation_stdDev (see Figure S2 and Figure S3). Overall, our results demonstrate a broad distribution of important features across various seasons and indices, with a noticeable predominance of information from band B7 and statistical measures such as the 25th percentile and mean. This balanced distribution reinforces the benefit of integrating multi-temporal and multispectral data in capturing the inherent complexity of dynamic landscapes. We highlight seasonal variability (0, 1, 2, 3 or none) in key spectral features, underlining the influence of different time periods on classification. In addition, this analysis shows some potential inter-feature relationships, suggesting redundancy and opportunities for feature optimization.
4. Discussion
This study demonstrated the value of integrating multi-temporal satellite imagery with hierarchical multistep analysis to enhance the accuracy and reliability of LULC classification in dynamic landscapes. By evaluating three distinct classification approaches - single-step classification, sequential binary classification, and accuracy-based binary classification - we revealed key insights into each method’s performance, strengths, and limitations in LULC mapping. Our results show that accuracy-based binary classification outperformed the other approaches. This section presents a comparative performance analysis of the different methodologies: Mapbiomas, Random Forest Classification, and Random Forest Classification with Hierarchy. It is worth noting that these products were compared with ground truth extracted from both Google Maps and Sentinel-2 images, considering data consistency. It is also worth noting that the hierarchical classification strategy proposed here was based on the accuracy of each class. Thus, when grouping the various classes, the class with the highest overall index was used as a prioritization parameter. Furthermore, it is important to emphasize that even using similar input data and classifiers (Sentinel-2 and Random Forest, respectively), it was possible to overcome the limitations of the large-scale product in heterogeneous environments.
The accuracy-based binary classification approach outperformed the other methods, achieving a superior accuracy of 87.37%. This method reorders the classification sequence by prioritizing classes with higher classification accuracy, mitigating the propagation of errors. Classifying the higher-confidence classes first reduces the likelihood of misclassification in subsequent steps, thereby improving precision in complex, spectrally diverse areas. Minimizing error propagation is particularly advantageous in regions with high class overlap, making accuracy-based binary classification highly effective at capturing the intricacies of dynamic land cover change. As shown, the MapBiomas product achieved moderate-to-high accuracy for most classes but showed limitations in distinguishing forestry, coffee, and grassland formation. These results suggest that refined classification strategies, such as stepwise accuracy-based approaches, can enhance classification reliability by minimizing confusion between spectrally similar classes.
In comparison, the single-step classification method, while less computationally intensive and more time-efficient, produced the lowest accuracy among the three approaches. This method’s limitations stem from the simultaneous classification of all land cover classes, which fails to account for each class’s distinct spectral and temporal dynamics. Also, it is not flexible enough to address quality mosaics derived from user-specified attributes that are particularly relevant to each class. Although the single-step method may be suitable for rapid mapping in time-sensitive applications or where computational resources are constrained, it offers less precision in environments where land cover is highly variable or seasonally dynamic.
Shimabukuro et al. (2023) outlined that the sequential binary classification achieved an overall accuracy of 80.51%, representing a significant improvement over the single-step classification approach (78.31%). Sequential binary classification’s strength lies in isolating each land cover class, enabling targeted feature extraction specific to individual classes. This method helps to reduce spectral confusion between classes, but its complexity increases computational demand, as each class must be processed independently. Nonetheless, it offers a more tailored and flexible approach to classifying land cover types in heterogeneous landscapes.
Feature-engineered data, including seasonal composite images, rainfall/NDVI correlation, and spatial statistics, provided new information for the classification task across all methods. Seasonal composites enabled the capture of temporal variability and phenological patterns, particularly for land cover types such as agricultural fields, forests, and water bodies, which exhibit seasonal fluctuations (Nasiri et al., 2022; Kollert et al., 2021). This incorporation of temporal dynamics allowed for more accurate differentiation of land cover types that would otherwise be indistinguishable in single-date imagery, improving the reliability of LULC classification in the study area.
The quality mosaics allowed for more precise identification of each class by maximizing the spectral and spatial representation of land cover features. This approach mitigated issues of spectral confusion, particularly in areas where classes such as vegetation and urban landscapes overlap. By selecting the highest-quality pixels based on spectral indices, the classification process leveraged the most representative data for each land cover type, thereby improving overall classification accuracy.
This research underscores the importance of choosing the appropriate classification methodology for remote sensing-based LULC mapping in dynamic landscapes. While the single-step approach may suffice for basic applications, more sophisticated techniques like sequential and accuracy-based binary classification significantly improve accuracy. These advanced methods are essential for generating accurate LULC maps that inform sustainable land management practices, ecosystem monitoring, and environmental policy development, particularly in regions undergoing rapid land use transformations. The enhanced classification framework presented in this study demonstrates its potential as a valuable tool for understanding and managing land use dynamics in complex and evolving landscapes.
When compared to a well-known LULC product, MapBiomas, we analyzed that it achieved an accuracy of 78.5% (Table 6), inferior to the Accuracy-based Binary Classification, which methodology we propose here, although we acknowledge that this first application, as a case study, is limited in area and period of analysis. In the same sense, MapBiomas faces limitations related to spatial and temporal consistency, as some periods in the time series exhibit inconsistencies that are still to be refined in future collections. While the project provides detailed resolution mapping, gaps remain in annual LULC information across all Brazilian biomes. Additionally, uncertainties in classification persist, requiring continuous methodological improvements and input from local experts to enhance accuracy and coverage, particularly in underrepresented biomes (Souza et al., 2020). In general, the selected product is a user’s decision considering its resources and recognition of those different possibilities, including the Single-step and sequential Binary classifications.
Despite these advances, gaps remain in applying this framework to broader spatial and temporal scales and different environmental conditions. Future research should focus on refining these methods to handle more intricate land cover types and exploring their potential for real-time monitoring in regions experiencing rapid land use changes. Additionally, integrating machine learning techniques to optimize the classification process and exploring the impact of climate variability on LULC patterns are promising avenues for further investigation.
It is worth delving deeper into the accuracy of some classes in some of the applied methods. For example, in Table 4 (see item 3.3), despite the high overall accuracy, classes such as Urban Area (C6, 0.43) and Forestry (C2, 0.58) still exhibit low user accuracy. This may be linked to specific reasons for the persistent spectral confusion, linked to the complexity of the landscape at the Furnas reservoir (land use mosaics, proximity to urban areas, and vegetation).
5. Conclusion
This research demonstrated that accuracy-based binary classification, integrated with multi-temporal data, is the most effective strategy, surpassing the accuracy of traditional methods and establishing a new precision standard for LULC mapping in dynamic tropical landscapes, such as the Furnas reservoir basin. By comparing four classification methods - Single-step, Mapbiomas Project, Sequential Binary, and Accuracy-based Binary Classification - the last one demonstrated superior performance, achieving the highest overall accuracy in capturing complex land heterogeneity. Seasonal composite imagery and feature-engineering, such as using quality mosaics with user-specified attributes targeted to discriminate between specific cover types, further improved the classification accuracy by addressing temporal variability and reducing spectral confusion between classes.
Future work could focus on thematic mapping control, applying other methodologies, not only by evaluating the global index, but also considering other indices, such as the kappa index, QADI (Quantity and Allocation Disagreement Index), and Hellinger distance, among others. It is worth noting that this is not the focus of this work, but the hierarchical overlay method is clearly innovative.
Within this line of control for assessing the thematic quality of maps, it would be important to test the optimal sample size by using simulations against the ground truth. Currently, the methodology is limited to classical sample size statistics. This could address an important gap from a scientific perspective, with inferences to practical issues, potentially better addressing issues related to costs and feasibility.
Finally, it is worth noting that map quality control, in general, is specifically addressed in the work presented here, and it is possible to reflect on and seek new methods that encompass both line and volume elements.
ACKNOWLEDGMENT
This product results from the Innovation and Research Project IBI -UHE FURNAS and & UFMG, which was developed, coordinated, and managed by UFMG, using financial resources provided by ELETROBRAS/AXIA ENERGIA. The University of Colorado Boulder Grand Challenge, Earth Lab, supported C.H.A. DRM was supported by Conselho Nacional de Desenvolvimento Científico e Tecnológico - CNPq (Grant number PQ-311002/2023-4). The work received financial support from the Coordenação de Aperfeiçoamento de Nível Superior - CAPES (Finance code 001).
REFERENCES
-
Chang, Yue, Kang Hou, Xuxiang Li, Yunwei Zhang, and Pei Chen. 2018. “Review of Land Use and Land Cover Change Research Progress.” IOP Conference Series: Earth and Environmental Science 113 (February):012087. https://doi.org/10.1088/1755-1315/113/1/012087.
» https://doi.org/https://doi.org/10.1088/1755-1315/113/1/012087 - Compri, Larissa, Ligiane Aparecida Florentino, Rosane Micaela Veiga, Adriano Bortolotti Silva, and José Messias Miranda. 2016. “Diversidade de microrganismos em frutos do cafeeiro cultivado na proximidade do Lago de Furnas.” Coffee Science - ISSN 1984-3909 11 (2): 285-89.
- Congalton, R. G., & Green, K. 2019. Assessing the accuracy of remotely sensed data: principles and practices. CRC press.
-
Dapke, Pratibha, Syed Ahteshamuddin Quadri, Samadhan M. Nagare, Sagar B. Bandal, and Manasi R. Baheti. 2025. “A Comparative Analysis Machine Learning Techniques for LULC Classification Using Landsat-8 Satellite Imagery.” International Journal of Engineering and Geosciences 10 (1): 84-92. https://doi.org/10.26833/ijeg.1503104.
» https://doi.org/https://doi.org/10.26833/ijeg.1503104 -
Dias, Viviane de Souza, Marta Pereira da Luz, Gabriela M. Medero, Diego Tarley Ferreira Nascimento, Wellington Nunes de Oliveira, and Leonardo Rodrigues de Oliveira Merelles. 2018. “Historical Streamflow Series Analysis Applied to Furnas HPP Reservoir Watershed Using the SWAT Model.” Water 10 (4): 458. https://doi.org/10.3390/w10040458.
» https://doi.org/https://doi.org/10.3390/w10040458 -
ESA - European Space Agency. 2015. “Sentinel-2 User Handbook.” https://sentinels.copernicus.eu/documents/247904/685211/Sentinel-2_User_Handbook
» https://sentinels.copernicus.eu/documents/247904/685211/Sentinel-2_User_Handbook -
Finegold, Y., & Ortmann, A. 2016. “Map accuracy assessment and area estimation: a practical guide”. https://openknowledge.fao.org/items/df0886a8-7aa0-4f46-a7c3-0c87591ad519
» https://openknowledge.fao.org/items/df0886a8-7aa0-4f46-a7c3-0c87591ad519 -
Foody, Giles M. 2009. “Sample Size Determination for Image Classification Accuracy Assessment and Comparison.” International Journal of Remote Sensing 30 (20): 5273-91. doi:10.1080/01431160903130937.
» https://doi.org/10.1080/01431160903130937 -
Ghosh, Argha, Manoj K. Nanda, and Debolina Sarkar. 2022. “Assessing the Spatial Variation of Cropping Intensity Using Multi-Temporal Sentinel-2 Data by Rule-Based Classification.” Environment, Development and Sustainability 24 (9): 10829-51. https://doi.org/10.1007/s10668-021-01885-0.
» https://doi.org/https://doi.org/10.1007/s10668-021-01885-0 -
Griffiths, Patrick, Claas Nendel, and Patrick Hostert. 2019. “Intra-Annual Reflectance Composites from Sentinel-2 and Landsat for National-Scale Crop and Land Cover Mapping.” Remote Sensing of Environment 220 (January):135-51. https://doi.org/10.1016/j.rse.2018.10.031.
» https://doi.org/https://doi.org/10.1016/j.rse.2018.10.031 -
Heidarianbaei, Mohammadreza, Hubert Kanyamahanga, and Mareike Dorozynski. 2024. “Temporal ViT-U-Net Tandem Model: Enhancing Multi-Sensor Land Cover Classification Through Transformer-Based Utilization of Satellite Image Time Series.” ISPRS Annals of the Photogrammetry, Remote Sensing and Spatial Information Sciences X-3-2024 (November):169-77. https://doi.org/10.5194/isprs-annals-X-3-2024-169-2024.
» https://doi.org/https://doi.org/10.5194/isprs-annals-X-3-2024-169-2024 -
IBGE - Brazilian Institute of Geography and Statistics. 2023. “2022 Demographic Census.” https://censo2022.ibge.gov.br/
» https://censo2022.ibge.gov.br/ - IGAM - Minas Gerais Water Management Institute. 2012. “Executive Summary of the Water Resources Master Plan for the Furnas Lake Surrounding Basin.” Belo Horizonte: IGAM.
-
Kollert, A., Bremer, M., Löw, M., & Rutzinger, M. Exploring the potential of land surface phenology and seasonal cloud free composites of one year of Sentinel-2 imagery for tree species mapping in a mountainous region. International Journal of Applied Earth Observation and Geoinformation, v. 94, p. 102208, 2021. https://doi.org/10.1016/j.jag.2020.102208
» https://doi.org/https://doi.org/10.1016/j.jag.2020.102208 -
Kottek, Markus, Jürgen Grieser, Christoph Beck, Bruno Rudolf, and Franz Rubel. 2006. “World Map of the Köppen-Geiger Climate Classification Updated.” Meteorologische Zeitschrift 15 (3): 259-63. https://doi.org/10.1127/0941-2948/2006/0130.
» https://doi.org/https://doi.org/10.1127/0941-2948/2006/0130 -
Landis, J. Richard, and Gary G. Koch. 1977. “The Measurement of Observer Agreement for Categorical Data.” Biometrics 33 (1): 159-74. https://doi.org/10.2307/2529310.
» https://doi.org/https://doi.org/10.2307/2529310 -
Leite, Andrea Coelho, Roberto Célio Valadão, Frederico Azevedo Lopes, and Débora Couto de Assis. 2022. “Evolução temporal e variação sazonal das condições de balneabilidade no Lago de Furnas - Minas Gerais / Brasil.” Revista Geografias 18 (1): 40-62. https://doi.org/10.35699/2237-549X.2022.35754.
» https://doi.org/https://doi.org/10.35699/2237-549X.2022.35754 -
Llano, X. C. 2024. “AcATaMa - QGIS Plugin for Accuracy Assessment of Thematic Maps, Version 24.6.” 2024. https://github.com/SMByC/AcATaMa
» https://github.com/SMByC/AcATaMa -
Martínez, William, Ivan Lizarazo, and André Große-Stoltenberg. 2025. “Integration of InSAR Coherence and SAR Backscatter Increases Accuracy of LULC Mapping in Tropical High-Mountain Ecosystems.” Geocarto International 40 (1): 2451174. doi:10.1080/10106049.2025.2451174.
» https://doi.org/10.1080/10106049.2025.2451174 - Mather, Paul M., and Magaly Koch. 2011. Computer Processing of Remotely-Sensed Images: An Introduction. 4th edition. Wiley.
-
Mello, Carlos R., Nayara P. A. Vieira, Jorge A. Guzman, Marcelo R. Viola, Samuel Beskow, and Lívia A. Alvarenga. 2021. “Climate Change Impacts on Water Resources of the Largest Hydropower Plant Reservoir in Southeast Brazil.” Water 13 (11): 1560. https://doi.org/10.3390/w13111560.
» https://doi.org/https://doi.org/10.3390/w13111560 -
Melo, Edson Santos, Andréia Ferreira Prestes, Francisca Diana Ferreira Viana, and Marcos Junior Marini. 2022. “Regional development and the tourism sector: a study for the Furnas Lake region.” Revista Brasileira de Planejamento e Desenvolvimento 11 (3): 741-66. https://doi.org/10.3895/rbpd.v11n3.14961.
» https://doi.org/https://doi.org/10.3895/rbpd.v11n3.14961 -
Nasiri, V., Deljouei, A., Moradi, F., Sadeghi, S. M. M., & Borz, S. A. Land use and land cover mapping using Sentinel-2, Landsat-8 Satellite Images, and Google Earth Engine: A comparison of two composition methods. Remote sensing, v. 14, n. 9, p. 1977, 2022. https://doi.org/10.3390/rs14091977
» https://doi.org/https://doi.org/10.3390/rs14091977 -
Ojwang, Gordon O., Joseph O. Ogutu, Mohammed Y. Said, Merceline A. Ojwala, Shem C. Kifugo, Francesca Verones, Bente J. Graae, Robert Buitenwerf, and Han Olff. 2024. “An Integrated Hierarchical Classification and Machine Learning Approach for Mapping Land Use and Land Cover in Complex Social-Ecological Systems.” Frontiers in Remote Sensing 4 (March). https://doi.org/10.3389/frsen.2023.1188635
» https://doi.org/10.3389/frsen.2023.1188635 -
Oyedotun, T. D. T. 2019. “Land Use Change and Classification in Chaohu Lake Catchment from Multi-Temporal Remotely Sensed Images.” Geology, Ecology, and Landscapes 3 (1): 37-45. https://doi.org/10.1080/24749508.2018.1481657.
» https://doi.org/https://doi.org/10.1080/24749508.2018.1481657 -
Ozelkan, Emre, Gang Chen, and Burak Berk Ustundag. 2016. “Multiscale Object-Based Drought Monitoring and Comparison in Rainfed and Irrigated Agriculture from Landsat 8 OLI Imagery.” International Journal of Applied Earth Observation and Geoinformation 44 (February):159-70. https://doi.org/10.1016/j.jag.2015.08.003.
» https://doi.org/https://doi.org/10.1016/j.jag.2015.08.003 -
Phiri, Darius, Matamyo Simwanda, Serajis Salekin, Vincent Nyirenda, Yuji Murayama, and Manjula Ranagalage. 2020. “Sentinel-2 Data for Land Cover/Use Mapping: A Review.” Remote Sensing 12 (14): 2291. https://doi.org/10.3390/rs12142291.
» https://doi.org/https://doi.org/10.3390/rs12142291 -
Raj, Saket, Kishan Singh Rawat, and Vinod Kumar Tripathi. 2024. “Multi-Temporal Image Processing for LULC Classification and Change Detection.” Environment and Ecology 42 (3B): 1349-57. https://doi.org/10.60151/envec/RODF5502.
» https://doi.org/https://doi.org/10.60151/envec/RODF5502 -
Read, J. M., and M. Torrado. 2009. “Remote Sensing.” In International Encyclopedia of Human Geography, edited by Rob Kitchin and Nigel Thrift, 335-46. Oxford: Elsevier. https://doi.org/10.1016/B978-008044910-4.00508-3.
» https://doi.org/https://doi.org/10.1016/B978-008044910-4.00508-3 -
Reinosch, Eike, Julian Backa, Petra Adler, Janik Deutscher, Philipp Eisnecker, Karina Hoffmann, Niklas Langner, et al. 2025. “Detailed Validation of Large-Scale Sentinel-2-Based Forest Disturbance Maps across Germany.” Edited by Teja Kattenborn. Forestry: An International Journal of Forest Research 98 (3): 437-53. doi:10.1093/forestry/cpae038.
» https://doi.org/10.1093/forestry/cpae038 -
Salman, Hasan Ahmed, Ali Kalakech, and Amani Steiti. 2024. “Random Forest Algorithm Overview.” Babylonian Journal of Machine Learning 2024 (June):69-79. https://doi.org/10.58496/BJML/2024/007.
» https://doi.org/https://doi.org/10.58496/BJML/2024/007 -
See, Linda, Juan Laso Bayas, Dmitry Schepaschenko, Christoph Perger, Christopher Dresel, Victor Maus, Carl Salk, et al. 2017. “LACO-Wiki: A New Online Land Cover Validation Tool Demonstrated Using GlobeLand30 for Kenya.” Remote Sensing 9 (7): 754. doi:10.3390/rs9070754.
» https://doi.org/10.3390/rs9070754 -
Shimabukuro, Yosio E., Egidio Arai, Gabriel M. da Silva, Tânia B. Hoffmann, Valdete Duarte, Paulo R. Martini, Andeise Cerqueira Dutra, Guilherme Mataveli, Henrique L. G. Cassol, and Marcos Adami. 2023. “Mapping Land Use and Land Cover Classes in São Paulo State, Southeast of Brazil, Using Landsat-8 OLI Multispectral Data and the Derived Spectral Indices and Fraction Images.” Forests 14 (8): 1669. https://doi.org/10.3390/f14081669.
» https://doi.org/https://doi.org/10.3390/f14081669 -
Souza, Carlos M., Julia Z. Shimbo, Marcos R. Rosa, Leandro L. Parente, Ane A. Alencar, Bernardo F. T. Rudorff, Heinrich Hasenack, et al. 2020. “Reconstructing Three Decades of Land Use and Land Cover Changes in Brazilian Biomes with Landsat Archive and Earth Engine.” Remote Sensing 12 (17): 2735. https://doi.org/10.3390/rs12172735.
» https://doi.org/https://doi.org/10.3390/rs12172735 -
Stehman, Stephen V. 2009. Sampling designs for accuracy assessment of land cover. International Journal of Remote Sensing , 30(20), 5243-5272. https://doi.org/10.1080/01431160903131000
» https://doi.org/https://doi.org/10.1080/01431160903131000 -
Stehman, Stephen V., and Giles M. Foody. 2019. “Key Issues in Rigorous Accuracy Assessment of Land Cover Products.” Remote Sensing of Environment 231 (September): 111199. doi:10.1016/j.rse.2019.05.018.
» https://doi.org/10.1016/j.rse.2019.05.018 -
Tucker, Compton J. 1979. “Red and Photographic Infrared Linear Combinations for Monitoring Vegetation.” Remote Sensing of Environment 8 (2): 127-50. https://doi.org/10.1016/0034-4257(79)90013-0.
» https://doi.org/https://doi.org/10.1016/0034-4257(79)90013-0 -
UCSB - UC Santa Barbara. n.d. “CHIRPS: Rainfall Estimates from Rain Gauge and Satellite Observations.” Climate Hazards Center. Accessed January 30, 2023. https://www.chc.ucsb.edu/data/chirps
» https://www.chc.ucsb.edu/data/chirps -
Wang, Jinfeng, Robert Haining, Tonglin Zhang, Chengdong Xu, Maogui Hu, Qian Yin, Lianfa Li, Chenghu Zhou, Guangquan Li, and Hongyan Chen. 2024. “Statistical Modeling of Spatially Stratified Heterogeneous Data.” Annals of the American Association of Geographers 114 (3): 499-519. https://doi.org/10.1080/24694452.2023.2289982.
» https://doi.org/https://doi.org/10.1080/24694452.2023.2289982 -
Xu, Chen, Xiaoping Du, Xiangtao Fan, Gregory Giuliani, Zhongyang Hu, Wei Wang, Jie Liu, et al. 2022. “Cloud-Based Storage and Computing for Remote Sensing Big Data: A Technical Review.” International Journal of Digital Earth 15 (1): 1417-45. https://doi.org/10.1080/17538947.2022.2115567.
» https://doi.org/https://doi.org/10.1080/17538947.2022.2115567 -
Xu, Hanqiu. 2006. “Modification of Normalised Difference Water Index (NDWI) to Enhance Open Water Features in Remotely Sensed Imagery.” International Journal of Remote Sensing 27 (14): 3025-33. https://doi.org/10.1080/01431160600589179.
» https://doi.org/https://doi.org/10.1080/01431160600589179 -
Zha, Y., J. Gao, and S. Ni. 2003. “Use of Normalized Difference Built-up Index in Automatically Mapping Urban Areas from TM Imagery.” International Journal of Remote Sensing 24 (3): 583-94. https://doi.org/10.1080/01431160304987.
» https://doi.org/https://doi.org/10.1080/01431160304987 -
Zhang, Xiao, Liangyun Liu, Changshan Wu, Xidong Chen, Yuan Gao, Shuai Xie, and Bing Zhang. 2020. “Development of a Global 30 m Impervious Surface Map Using Multisource and Multitemporal Remote Sensing Datasets with the Google Earth Engine Platform.” Earth System Science Data 12 (3): 1625-48. https://doi.org/10.5194/essd-12-1625-2020.
» https://doi.org/https://doi.org/10.5194/essd-12-1625-2020 -
Zhao, Yuanyuan, Peng Gong, Le Yu, Luanyun Hu, Xueyan Li, Congcong Li, Haiying Zhang, et al. 2014. “Towards a Common Validation Sample Set for Global Land-Cover Mapping.” International Journal of Remote Sensing 35 (13): 4795-4814. https://doi.org/10.1080/01431161.2014.930202.
» https://doi.org/https://doi.org/10.1080/01431161.2014.930202 -
Zhong, Yanfei, Ailong Ma, Yew Soon Ong, Zexuan Zhu, and Liangpei Zhang. 2018. “Computational Intelligence in Optical Remote Sensing Image Processing.” Applied Soft Computing 64 (March):75-93. https://doi.org/10.1016/j.asoc.2017.11.045.
» https://doi.org/https://doi.org/10.1016/j.asoc.2017.11.045
Supplementary Material - Hierarchical Multistep Remote Sensing Classification Enhances Land Use Mapping Accuracy in Anthropogenically Modified Landscapes
RESULTSThe top important features in Random Forest (RF) were assessed for Single-step Classification (Figure S1) and for each class of Accuracy-based Binary Classification (Figures S2 and S3). Variables names are given in relation to their season (0 for January to March, 1 for April to June, 2 for July to September, and 3 for October to December, or none for the entire year; followed by the Sentinel-2 bands, spectral indices names or precipitation correlation; ended with the spatial statistics.


The datasets generated and/or analyzed during the current study are available from the corresponding author upon reasonable request.

 Source: Organized by authors.
 Source: Organized by authors.
 Source: Organized by authors.


