 Development and Validation of an RP-HPLC/DAD Method for Luteolin Quantification in Novel Hydroxyapatite Nanocomposites
Abstract
Calcium hydroxyapatite (HAp) is widely used in medical and aesthetic fields for bone repair and dermal applications. Luteolin (LUT), a flavonoid with anti-inflammatory and antioxidant properties, may enhance the therapeutic potential of HAp for collagen production into the skin. The main aim of this paper was to develop and validate a simple and reliable RP-HPLC/DAD method for quantifying LUT in HAp nanocomposites. The synthesis of hydroxyapatite nanoparticles (n-HAp) was performed via precipitation method. To obtain the novel nanocomposites, n-HAp was associated with LUT by the wet method using ethanol into a SpeedMixer®, followed by drying into an oven at 35ºC for 48 hours. The RP-HPLC/DAD method was developed for quantifying the LUT incorporation efficiency. The validation parameters assessed included selectivity, linearity, limits of quantification (LOQ) and detection (LOD), precision, accuracy, robustness, and sample stability. The novel nanocomposites n-Hap-LUT were successfully prepared using the proposed method. The incorporation efficiency demonstrated high values of 82.90% and 95.16% for nHAp-LUT samples. Thus, the RP-HPLC/DAD method was appropriate for quantifying LUT in novel dermal aesthetic products for collagen production and may be further used for design and quality control of novel collagen biostimulation technologies.
Keywords:
Antioxidant; Chromatographic analysis; Collagen biostimulator; Nanotechnology; Polyphenol quantification.
HIGHLIGHTS
A rapid and simple analytical method was developed and validated for the luteolin (LUT) determination by chromatography.
The nanocomposites were successfully obtained using the proposed method.
A high incorporation efficiency of LUT was achieved for the LUT-hydroxyapatite nanocomposites.
INTRODUCTION
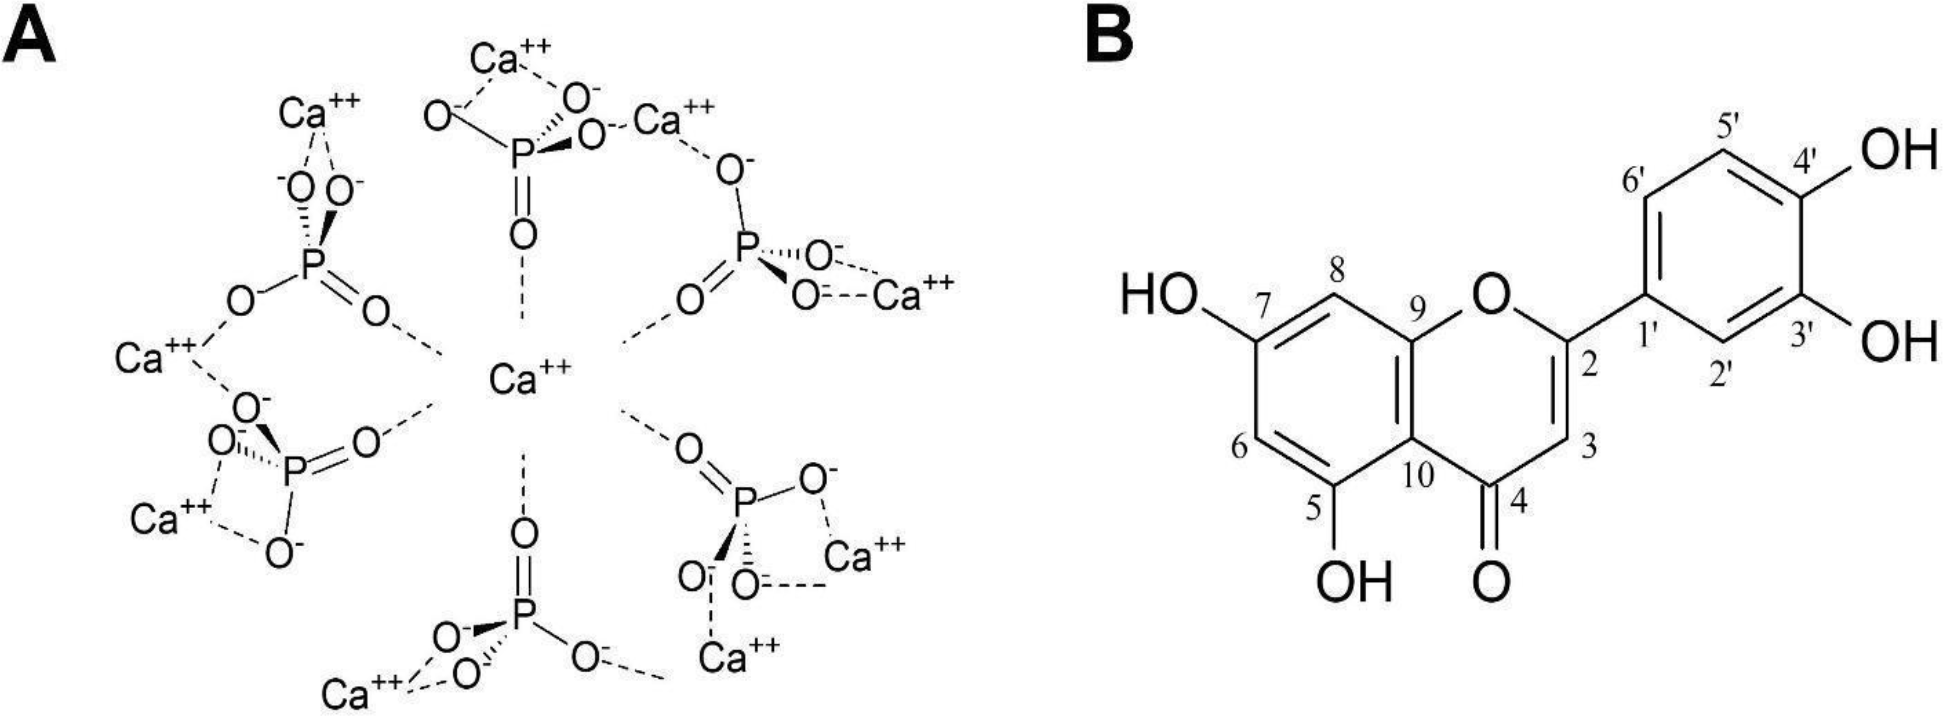
Calcium hydroxyapatite (HAp)(Figure 1A), a biomaterial with the molecular formula Ca10(PO4)6(OH)2, is a synthetic derivative of calcium phosphate and the primary mineral component of human bones and teeth [1-3]. Recognized for its bioactivity, biocompatibility, and bioresorbability, HAp has been extensively used in medical and dental fields, including orthopedic prostheses, dental implants, and bone tissue repair. Its potential for dermal applications was first described when its collagen-stimulating effects were observed in patients with facial bone loss [4-6]. Approved by the FDA in 2006 for aesthetic use, HAp is currently utilized for skin biostimulation, wrinkle correction, and dermal volume restoration [7]. These applications control its capacity to trigger neocollagenesis through a controlled inflammatory response, enhancing skin texture and elasticity [8-10].
Despite its widespread use, HAp’s efficacy in collagen stimulation has some limitations. The material’s degradation profile typically extends to 24 months, and its efficacy depends on factors such as particle size, surface area, and the preparation method [11-13]. Injectable HAp formulations often incorporate microspheres within a carrier gel to facilitate administration, but this configuration presents challenges related to sustained release and long-term stability [14,15]. Additionally, while HAp provides immediate volumization, its gradual resorption limits its ability to maintain prolonged neocollagenesis [16,17]. Enhancing its therapeutic profile through advanced formulations, such as the inclusion of bioactive agents, could overcome these constraints and maximize its potential in aesthetic and therapeutic applications [18].
Luteolin (LUT)(Figure 1B), a naturally occurring flavonoid, is widely recognized for its anti-inflammatory, antioxidant, and anti-carcinogenic properties [19,20]. Found in various plant sources, LUT has demonstrated potent free radical scavenging activity and the ability to modulate oxidative stress [21,22]. These attributes are particularly relevant in dermatological applications, where oxidative stress and inflammation contribute to skin aging and disorders such as psoriasis and atopic dermatitis [23]. LUT also inhibits the activity of matrix metalloproteinases (MMPs), enzymes responsible for collagen degradation, making it a promising candidate for applications aiming to preserve or enhance dermal collagen [22-24].
The physicochemical characteristics of LUT, including its poor water solubility and high hygroscopicity, present challenges for its incorporation into therapeutic formulations [25-27]. However, advances in extraction and techniques have facilitated its use in both pharmaceutical and cosmetic applications [28, 29]. The LUT ability to suppress pro-inflammatory cytokines, such as tumor necrosis factor (TNF) and interleukins (ILs), while enhancing anti-inflammatory mediators like IL-10, further underscores its therapeutic potential [20,30,31]. Moreover, studies have highlighted its neuroprotective, anticancer, and wound-healing properties, suggesting a broader spectrum of applications beyond dermatology [22,23,32].
Some previous papers were devoted to developing and validating analytical methods for the quantification of LUT and related compounds [33-36]. Wu and coauthors [33] and Shi and coauthors [34] used HPLC-MS/MS methods and showed high sensitivity and selectivity for pharmacokinetic studies involving LUT and its metabolites in rat plasma. Zhang and coauthors [35] optimized a gradient HPLC method for the quality control of herbal suppositories and provided precise quantification of active phenolic components including LUT. San Martín and coauthors [36] used a gradient HPLC approach to quantify LUT in peanut shells. Despite these briefly mentioned analytical strategies, the literature lacks in presenting validated methods for quantifying LUT in novel HAp-based nanocomposites. This study hypothesizes that a simple reverse-phase high-performance liquid chromatography (RP-HPLC) method with diode-array detection (DAD) can be developed and validated for this purpose. The null hypothesis assumes that the proposed method will not meet the rigorous criteria for selectivity, sensitivity, precision, and accuracy required for analytical validation.
Taking all these into account, the main aim was to develop and validate a simple, reliable RP-HPLC/DAD method for quantifying LUT in HAp nanocomposites in order to provide further advancements in collagen biostimulation technologies. This paper can contribute to the development of enhanced HAp dermal formulations with integrated antioxidant properties for further aesthetic applications.
MATERIAL AND METHODS
Synthesis of Calcium Hydroxyapatite Nanoparticles
The synthesis of hydroxyapatite nanoparticles (n-HAp) was carried out using the precipitation method based on the stoichiometric Ca/P molar ratio of 1.67, which is essential to produce calcium hydroxyapatite as previously reported [37]. Phase 1 was prepared containing distilled water (228 mL), ammonium hydroxide solution (165 mL, p.a., ~25% NH3 basis), and phosphoric acid (7 mL, p.a., 85%) at 50°C. A second solution (Phase 2) containing distilled water (150 mL) and analytical grade calcium nitrate tetrahydrate (39.9 g) was obtained. Phase 2 was slowly dripped into Phase 1 under vigorous stirring. The reaction was kept in magnetic stirring and the temperature was gradually increased from 50°C to 100°C for 60 minutes. The synthesized samples were frozen in an ultrafreezer at -86°C (Nu9668GC, NuAire) for 48 hours and were then subjected to freeze-drying (LD 1500, Terroni) for 72 hours to obtain n-HAp.
Moisture Content
The moisture content of the synthesized n-HAp samples was evaluated using an infrared moisture analyzer (MOC63u, Shimadzu). This method was performed to calculate the sample proportions for LUT incorporation into the n-HAp.
Preparation of Hap-LUT Nanocomposites
To obtain the nanocomposites, LUT at 1, 10, and 20% (m/m) was added to the previously synthesized n-HAp. Absolute ethanol (99.5%) was mixed, and the samples were homogenized using a SpeedMixer® (DAC 150.1 FV-K, Hauschild SpeedMixer®) at 3,500 rpm for 3 hours [37]. After this procedure, the n-HAp-LUT nanocomposites were dried into an oven at 35°C for 48 hours. For comparative purposes, a non-loaded sample with no LUT (L0) was also prepared. Table 1 summarizes the nanocomposite formulations.
Analytical Quantification
The chromatographic conditions were carefully evaluated and optimized by the authors. This process involved testing different compositions, pH, and flow rates of the mobile phase to achieve optimal separation and peak resolution. Additionally, the column temperature and the detection wavelength were examined to ensure maximum analytical quality. This comprehensive approach allowed for enhanced method performance and reliable quantification of LUT. The HPLC Nexera-i 2040C LC 3D Plus system (Shimadzu) was used for the analytical development and optimization. Pure LUT was firstly dissolved in methanol (CH₃OH, HPLC grade) at a concentration of 1 mg.mL-1. A C18 column (Shim-pack CLC-ODS M, Shimadzu) with a particle size of 5 µm, a length of 150 mm, and an internal diameter of 4.6 mm was used. The wavelength of the diode array detector was set at 254 nm. The flow rate of 1 mL/min and the injection volume of 5 μL were chosen. The oven temperature was maintained at 25°C. The mobile phase consisted of water acidified with 0.1% formic acid (Phase A) and methanol (Phase B) at a 40:60 (v/v) ratio, with a run time of 8 minutes under isocratic conditions.
Analytical Validation
The parameters evaluated for validation included selectivity, linearity, homoscedasticity, limit of quantification (LQ) and detection (LD), precision, accuracy, robustness, and sample stability. The validation was performed according to the guidelines provided by the Brazilian health regulatory agency [38].
Selectivity
Selectivity was examined by comparing the chromatograms of L0 (n-HAp formulation with no LUT) and n-HAp-LUT nanocomposite (containing 10% LUT) to confirm that the formulation did not interfere with the LUT quantification [39].
Linearity
To assess linearity, samples were prepared from a stock solution at a concentration of 1 mg.mL-1. Sample solutions were then prepared at concentrations of 0.2, 0.3, 0.4, 0.5, and 0.6 mg.mL-1. The linear equation and the correlation coefficient (r) were obtained. Linear regression analysis was performed using the least squares method, and the slope was tested by Analysis of Variance (ANOVA) with a significance level of 0.05.
Homoscedasticity
T o evaluate homoscedasticity, a scatter plot was created to depict the relationship between the predicted values on the X-axis and the residual values on the Y-axis [40]. The Breusch-Pagan test was used to test the null hypothesis (H₀) that error variances are equal against the alternative hypothesis (H₁ or HA) that variances have at least one differing mean [40].
Limit of Quantification (LOQ) and Limit of Detection (LOD)
The limit of quantification (LOQ) and the limit of detection (LOD) were calculated using the quotient between the standard deviation (DP) of linear coefficients and the mean of angular coefficients of the curves (S), using the factors suggested by the International Conference on Harmonisation [41], as described in Equations 1 and 2.
Where DP is the standard deviation, and S is the slope of the analytical curve.
Precision
To determine the repeatability of the analytical method, triplicates at the lowest, medium, and highest concentrations (n=9) were separately prepared under identical operating conditions, by the same analyst, using the same equipment, and on the same day. The results were expressed as the coefficient of variation (CV), calculated according to Equation 3, where SD is the standard deviation of the series of measurements, and AMC is the average measured concentration.
Intermediate precision was evaluated using the same nine replicates, which were also prepared individually, on two different days, in the same laboratory, and by different operators. The interday CV was then calculated using Equation 3. Statistical analysis of the results was performed using a t-test with a significance level of 0.05.
Accuracy
For accuracy, the recovery method was used by the analytical determination of a known amount of analyte spiked into the n-HAp-LUT nanocomposite (containing 10% LUT). Accuracy was verified using nine determinations of three replicates at three different levels of the analytical curve: low (0.25 mg.mL-1), medium (0.45 mg.mL-1) and high (0.55 mg.mL-1) concentrations. Accuracy was expressed using Equation 4, where the expected results should range between 95% to 105% [38].
Robustness
For robustness, the samples were subjected to different analytical column temperature conditions and variations in the mobile phase composition. The analytical column temperature was adjusted from 25°C to 22°C and 28°C. The mobile phase composition, initially set at 40:60 (v/v) with 60% Phase B (methanol), was modified to 41:59 and 39:61. The results for the parameters were analyzed using the CV and analyte recovery (%) and compared to the values obtained under standard conditions. Statistical significance of the results was evaluated using ANOVA with Tukey's post hoc test with a significance level of 0.05.
Stability
According to Oliveira and Gaitani [42], stability testing was carried out as part of the robustness by exposing the sample to room temperature for a minimum of 6 hours. The results were compared to those of freshly prepared solutions. For this test, the sample was prepared at a concentration of 0.4 mg.mL-1 and stored for 24 hours at room temperature with no protection from light.
Incorporation Efficiency of HAp-LUT nanocomposites
The incorporation efficiency (IE%) was directly measured after LUT extraction. A known amount of each n-HAp-LUT nanocomposite (L1, L2, and L3) was accurately weighed, dissolved in methanol, and centrifuged at 10,000 rpm for 5 minutes. The sample was then filtered through a 0.22-μm-pore PTFE filter and quantified using the developed and validated method [43,44]. The IE% was obtained using Equation 5.
Statistical Analysis
The results were expressed as mean ± standard deviation. Statistical significance between groups was assessed using one-way analysis of variance (ANOVA) for statistical comparisons with a significance level of 5% (α = 0.05).
RESULTS
Synthesis of Calcium Hydroxyapatite Nanoparticles and Preparation of Hap-LUT Nanocomposites
The synthesis of n-HAp was successfully performed, and the final product showed a flake powder aspect with a white color after freeze-drying. The n-HAp-LUT nanocomposites L1, L2, and L3 exhibited a yellowish color due to the incorporation of LUT.
Analytical Quantification
Figure 2a shows the chromatogram of LUT at a concentration of 0.4 mg.mL-1 with a well-defined chromatographic peak at a retention time of 4.9 minutes.

Chromatographic data of the developed and validated RP-HPLC/DAD method for LUT. (a) LUT chromatographic peak at 0.4 mg.mL-1; (b) chromatogram of L0 (formulation containing no LUT); (c) analytical curve from linearity results at concentrations of 0.2, 0.3, 0.4, 0.5, and 0.6 mg.mL-1; (d) scatter plot demonstrating a random dispersion.
Selectivity
The elution observed for formulation L0 (containing no LUT) showed no absorption peak as indicated in Figure 2b. This result confirms the selectivity of the analytical method since any substance other than LUT did not interfere in the chromatogram.
Linearity
The analytical curve was obtained within the concentration range of 0.2 to 0.6 mg.mL-1 and resulted in the equation y = (19,085,817) x + (-922339.6) and the linear correlation coefficient (R) of 0.995 as depicted in Figure 2c.
Homoscedasticity
The F-test, performed using one-way analysis of variance (ANOVA), resulted in an F-statistic of 0.002072, a p-value of 0.0997, and an R2 value of 0.000345. The scatter plot in Figure 2d shows the points corresponding to values and residuals randomly dispersed around a horizontal line, indicating the presence of homoscedasticity. The Breusch-Pagan statistical test showed a result of 0.6183, suggesting that there is not enough evidence to conclude that there is heteroscedasticity in the residuals of the regression models, thus not rejecting the null hypothesis (H₀) for the datasets.
Limit of Quantification (LOQ) and Limit of Detection (LOD)
Values of 0.15 and 0.05 mg.mL-1 were respectively obtained for LOQ and LOD.
Precision
Table 2 summarizes the results of repeatability and intermediate precision performed at low, medium, and high concentrations (0.2; 0.4; and 0.6 mg.mL-1, respectively). The calculated coefficient of variation (CV) was lower than 5% for all concentrations and indicated that the method is precise.
Coefficients of variation for repeatability and intermediate precision data at concentrations of 0.2; 0.4; and 0.6 mg.mL-1.
Accuracy
The accuracy results are illustrated in Table 3. Values of CV and recovery were lower than 5% and ranged between 95% to 105%, respectively. Thus, the developed method was considered accurate.
Robustness
The robustness data are presented in Table 4. As expected, CV values were lower than 5%, and the recovery percentage was within adequate values between 95% and 105% [35], considering the minimum changes performed in column temperature and mobile phase composition.
Robustness data assessed at 0.4 mg.mL-1 at temperatures of 22°C and 28°C and mobile phase composition of 41:59 and 39:61 (v/v).
Stability
The proposed stability study was carried out at 0.4 mg.mL-1 and resulted in CV and recovery values of 0.40% and 99.30%, respectively. These data were within the acceptable reference values.
Incorporation Efficiency in HAp-LUT nanocomposites
The incorporation efficiencies observed for L1, L2, and L3 formulations are described in Table 5. The Incorporation efficiency in HAp-LUT nanocomposites showed high values, ranging from 82.90% (L3) to 95.16% (L2).
DISCUSSION
The preparation of a novel hydroxyapatite-luteolin (HAp-LUT) nanocomposite was first described in this paper and may be potentially used for aesthetic applications. HAp, known for its bioactivity and biocompatibility, combined with LUT, a flavonoid with potent antioxidant and anti-inflammatory properties, may offer an innovative approach for dermatological treatments [1-3, 19-23]. The nanocomposite may enhance neocollagenesis and improve skin elasticity concerning the prolonged release of LUT, which can inhibit collagen-degrading enzymes and reduce pro-inflammatory cytokines [20, 22, 30, 31]. This interaction could overcome the limitations of pure HAp, such as its degradation profile for the aesthetic effect [11-13, 16-17]. Thus, HAp-LUT nanocomposite can emerge as a promising alternative for advanced aesthetic procedures for providing prolonged action, collagen stimulation, and improved skin quality [7-10, 18, 23].
However, the design of this novel dermal aesthetic product containing HAp-LUT nanocomposite requires an analytical method for its evaluation and quality control. Therefore, this paper reports the development of a simple RP-HPLC/DAD strategy based on an isocratic elution approach for LUT quantification. Despite of gradient elution methods, which are commonly applied by other authors to separate LUT from its metabolites [34] or other co-eluting substances [33,35,36], the isocratic elution is a simplified strategy that makes the method more suitable for quantifying LUT in these aesthetic products where complex separation is not mandatory. In addition, this approach differs from the HPLC-MS/MS methods frequently reported in the literature [33-36], which are usually more complex and expensive. The isocratic elution method developed here eliminates the need for advanced mass spectrometry systems, using only standard HPLC equipment with a photodiode array detector. The developed method ensured practicality, cost-effectiveness, and immediate application in studies focusing on LUT quantification.
The method was carefully validated in accordance with the literature guidelines [41,45]. These requirements include critical parameters as selectivity, linearity, range, homoscedasticity, limit of quantification (LOQ), limit of detection (LOD), precision, accuracy, and robustness [38]. These parameters ensure the reliability of the analytical results and can reduce operational costs by preventing rework and waste. Moreover, validation is crucial for the development of new dermal aesthetic products and real-time quality monitoring [39]. The LUT chromatogram showed a well-defined chromatographic peak with an appropriate retention time for routine analyses. An UPLC-MS/MS method tested chitosan-coated nanoemulsions containing LUT to enhance its bioavailability in tissues such as brain and lungs presented a retention time of 2.21 [45]. Another HPLC-MS/MS method was used to separate LUT from other compounds in red propolis and demonstrated a retention time of 28.40 minutes [46]. A retention time of 26.21 minutes was observed for LUT in nanoencapsulated extracts based on poly (lactic-co-glycolic acid) (PLGA) [47].
The validation parameters were entirely achieved in this study. The selectivity was proven by its ability to identify only the pure LUT in the presence of other components of the formulation [42]. Linearity was evidenced by the correlation coefficient (r) higher than 0.99 [39]. Homoscedasticity was confirmed by the low F value and the p-value higher than 0.05, indicating the absence of statistically significant differences between the groups [48,49]. The method presented adequate LOQ and LOD for quantification in the range between 0.2 and 0.6 mg.mL⁻1 [40]. Precision was demonstrated by coefficients of variation (CV) lower than 5% for repeatability and intermediate precision, while accuracy showed recoveries between 95% and 105% [39]. Robustness was verified by maintaining the results within these limits [41], even with variations in column temperature and mobile phase composition. Stability results indicated no change between the results of fresh solutions and those exposed to ambient temperature for 24 hours, confirming the analyte stability [42]. Therefore, the method can be used for samples available up to 24 hours after their preparation.
The HAp-LUT nanocomposites demonstrated a high incorporation efficiency of LUT. Among the composites, L3 showed a slightly lower incorporation percentage, probably due to the higher LUT concentration used during nanocomposite preparation. Interestingly, no previous study in the literature reported the incorporation of pure LUT into HAp-based formulations, which highlights the innovative nature of this approach. Thereby, the use of the RP-HPLC/DAD method proved to be a simple, fast, and reliable strategy for quantifying LUT in these new dermal aesthetic products. Its accessibility, cost-effectiveness, and operational simplicity make it particularly suitable for routine industrial applications and can reduce the use of more complex and expensive methods such as UPLC or mass spectrometry.
CONCLUSION
In this study, a simple and effective reverse-phase high-performance liquid chromatography method was developed and validated for LUT quantification. The analytical method proved to be selective, linear, precise, accurate, robust, and stable. The HAp-LUT nanocomposites demonstrated high incorporation efficiencies. Therefore, the developed method can be successfully used for quantifying LUT in novel dermal aesthetic products as a practical and rapid approach, and can be used as a quality control strategy for future formulations.
-
Funding:
This study was carried out with the support of the Coordination for the Improvement of Higher Education Personnel - Brazil (CAPES) - Financing Code 001.
Acknowledgments:
The authors are grateful for the technical support of the interdisciplinary laboratory C-LABMU of State University of Ponta Grossa. This study was partially supported by the National Council for Scientific and Technological Development (CNPq) [313704/2019-8] (Brazil; PVF).
REFERENCES
- 1 Amorin MO, Júnior JCCS, Ruiz YL, Andrade JCS. Synthesis and characterization of niobium-doped fish scale-derived hydroxyapatite by physical ultrasound interference. Cerâmica [Ceramic]. 2021;67(381):23-7.
- 2 Nadal JM, Silva KL, Loguercio AD, Novatski A, Pupo YM, Farago PV. [Technological development, characterization and in vitro and in vivo evaluation of hydroxyapatite-capsaicin composite for the in-office dental bleaching] [Postdoctoral project]. Ponta Grossa: State University of Ponta Grossa, Graduate program in pharmaceutical sciences; 2022.
- 3 Ferreira LAQ, Lehman LFC, Diniz MG, Ferreira AJ, Silva RMFC, Silva TA, et al. Biogran grafting in rat tibia defects: a model of high bone metabolism site. Braz. Arch. Biol. Technol. 2024;67:e24230003.
- 4 Novella I, Rupaedah B, Eddy DR, Suryana, Irwansyah FS, Noviyanti AR. The Influence of Polyvinyl Alcohol Porogen Addition on the Nanostructural Characteristics of Hydroxyapatite. Mater. 2023;16(18):6313.
- 5 Hartatiek H, Wuriantika MI, Yudyanto Y, Taufiq A. Effect of Aging Time and Sonication Treatment on Hydroxyapatite Structure from Limestone. Appl. Mech. Mater. 2023;915:3-9.
- 6 Chisini LA, Paganotto GFR, Guergolette R, Conde MCM, Alcázar JCB, Carvalho RV, et al. Hydroxyapatite synthesis and covering of titanium surfaces by dip-coating method. Braz. Arch. Biol. Technol. 2021;64:e21200344.
- 7 Cohen SR, Patton S, Wesson J, Tiryaki KT, Mora A. Radiesse rescue: A preliminary study for a simple and effective technique for the removal of calcium hydroxyapatite-based fillers. Aesthet Surg J. 2023;43(3):365-9.
- 8 Barbosa JN, Vasconcelos DP. Handbook of Biomaterials Biocompatibility - Chapter 3: Macrophage response to biomaterials. Biomaterials. 2020:43-52.
- 9 Corduff N, Chen JF, Chen YH, Choi HS, Goldie K, Lam Y, et al. Pan-Asian Consensus on Calcium Hydroxyapatite for Skin Biostimulation, Contouring, and Combination Treatments. J. Clin. Aesthet. Dermatol. 2021;14(8)-E85.
- 10 Gehrcke M, Sari MHM, Ferreira LM, Barbieri AV, Giuliani LM, Prado VC, et al. Nanocapsules improve indole-3-carbinol photostability and prolong its antinociceptive action in acute pain animal models. Eur. J. Pharm. Sci. 2018;111:133-41.
- 11 Neca CSM, Gondim ACL, Rocha CAS, Silva CAP, Silva FG. [The use of collagen biostimulators with calcium hydroxyapatite]. e-Acadêmica [e-academic] [Internet]. 2022;3(2).
- 12 Haddad S, Galadari H, Patil A, Goldust M, Salam SA, Guida S. Evaluation of the biostimulatory effects and the level of neocollagenesis of dermal fillers: a review. Int. J. Dermatol. 2022;61:1284-8.
- 13 Nowag B, Casabona G, Kippenberger S, Zöller N, Hengl T. Calcium hydroxylapatite microspheres activate fibroblasts through direct contact to stimulate neocollagenesis. J. Cosmet. Dermatol. 2022;22:426-32.
- 14 Liu YC, Tsai MF, Chen YF. Near Complete Recovery of Visual Acuity After Calcium Hydroxylapatite Injection-Related Vision Loss: A Case Report and Literature Review. Ann. Plast. Surg. 2020;84(1).
- 15 Oberg C, Pochapski MT, Farago PV, Granado CJ, Pilatti GL, Santos FA. Evaluation of desensitizing agents on dentin permeability and dentinal tubule occlusion: an in vitro study. Gen. Dent. 2009;57(5):496-501.
- 16 Almeida EPM, Levy FM, Buzalaf MAR. “RichBlend” protocol for full-face filling and collagen biostimulation. Rev. Gaúcha Odontol. 2023;71.
- 17 Eppley BL, Summerlin DJ, Prevel CD, Sadove AM. Effects of a positively charged biomaterial for dermal and subcutaneous augmentation. Aesthet. Plast. Surg. 1994;18:413-6.
- 18 Vilela AP, Rezende M, Terra RMO, Silva KL, Sutil E, Calixto AL, et al. Effect of topical application of nanoencapsulated eugenol on dental sensitivity reduction after in-office dental bleaching: a randomized, triple-blind clinical trial. J Esthet Restor Dent. 2021;33(4):660-7.
- 19 Theoharides TC. Luteolin: the wonder flavonoid. BioFactors. 2021;47:139-40.
- 20 Huang L, Kim MY, Cho JY. Immunopharmacological activities of luteolin in chronic diseases. Int. J. Mol. Sci. 2023;24(3):2136.
- 21 Conti P, Caraffa A, Gallenga CE, Ross R, Kritas SK, Frydas I, et al. Powerful anti-inflammatory action of luteolin: potential increase with IL-38. BioFactors. 2021;47:165-9.
- 22 Rocchetti MT, Bellanti F, Zadorozhna M, Fiocco D, Mangieri D. Multi-faceted role of luteolin in cancer metastasis: EMT, angiogenesis, ECM degradation and apoptosis. Int. J. Mol. Sci. 2023;24(10):8824.
- 23 Gendrisch F, Esser PR, Schempp CM, Wölfle U. Luteolin as a modulator of skin aging and inflammation. BioFactors. 2020;47:170-80.
- 24 Maluf DF, Gonçalves MM, D’Angelo RWO, Girassol AB, Tulio AP, Pupo YM, et al. Cytoprotection of antioxidant biocompounds from grape pomace: Further exfoliant phytoactive ingredients for cosmetic products. Cosmetics. 2018;5(3):46.
-
25 NCBI - National Center for Biotechnology Information. PubChem compound summary for CID 5280445, luteolin. 2024 [cited 2024 Apr 8]. Available from: https://pubchem.ncbi.nlm.nih.gov/compound/Luteolin
» https://pubchem.ncbi.nlm.nih.gov/compound/Luteolin - 26 Wishart DS, Guo AC, Oler E, Wang F, Anjum A, Peters H, et al. HMDB 5.0: the human metabolome database for 2022. Nucleic Acids Res. 2022;52(D1):05800.
- 27 Knox C, Wilson M, Klinger CM, Franklin M, Oler E, Wilson A, et al. DrugBank 6.0: the DrugBank knowledgebase for 2024. Nucleic Acids Res. 2024;52(D1).
- 28 Manzoor MF, Ahmad N, Ahmed Z, Siddique R, Zeng XA, Rahaman A, et al. Novel extraction techniques and pharmaceutical activities of luteolin and its derivatives. J. Food Biochem. 2019;43.
- 29 Justus B, Almeida VP, Gonçalves MM, Assunção DPSF, Borsato DM, Arana AFM, et al. Chemical composition and biological activities of the essential oil and anatomical markers of Lavandula dentata L cultivated in Brazil. Braz. Arch. Biol. Technol. 2018;61:e18180111.
- 30 Bobek VB, Heiden G, Oliveira CF, Almeida VP, Paula JP, Farago PV, et al. Comparative analytical micrographs of “vassouras” (Baccharis, Asteraceae). Rev. Bras. Farmacogn. 2016;26(6):665-72.
- 31 Pupo YM, Farago PV, Nadal JM, Simão LC, Esmerino LA, Gomes OMM, et al. Effect of a novel quaternary ammonium methacrylate polymer (QAMP) on adhesion and antibacterial properties of dental adhesives. Int. J. Mol. Sci. 2014;15(5):8998-9015.
- 32 Ferreira LM, Cervi VF, Sari MHM, Barbieri AV, Ramos AP, Copetti PM, et al. Diphenyl diselenide loaded poly (ɛ-caprolactone) nanocapsules with selective antimelanoma activity: Development and cytotoxic evaluation. Mater. Sci. Eng. C. 2019;91:1-9.
- 33 Wu W, Li K, Zhao C, Ran X, Zhang Y, Zhang T. A rapid HPLC-MS/MS method for the simultaneous determination of luteolin, resveratrol and their metabolites in rat plasma and its application to pharmacokinetic interaction studies. J. Chromatogr. B. 2022;1191:123118.
-
34 Shi F, Pan H, Lu Y, Ding L. An HPLC-MS/MS method for the simultaneous determination of luteolin and its major metabolites in rat plasma and its application to a pharmacokinetic study. J. Sep. Sci. 2018;41(20):4018-26. doi:10.1002/jssc.201800585.
» https://doi.org/10.1002/jssc.201800585. - 35 Zhang Q, Li J, Wang C, Sun W, Zhang Z, Cheng W. A gradient HPLC method for the quality control of chlorogenic acid, linarin and luteolin in Flos Chrysanthemi Indici suppository. J. Pharm. Biomed. Anal. 2007;43(2):753-757.
- 36 San Martín A, Chui G, Romero AS, Acebey R, Blanco E, Flores Y, et al. Luteolin in peanuts’ shells (Arachis hypogaea) in cultivars of Bolivia. Rev. Bol. Quim. 2017;34(3):79-88.
- 37 Silva KL, Hortkoff D, Rezende M, Nadal JM, Loguercio AD, Farago PV. Preparation and Characterization of a Novel Hydroxyapatite-Capsaicin Composite Intended for the In-Office Dental Bleaching Use. Preprints. 2024;2024061197.
-
38 Brasil. Resolution RDC Nº 166, 2017 Jul 24. [cited 2024 Mar 13]. Available from: https://pesquisa.in.gov.br/imprensa/jsp/visualiza/index.jsp?data=25/07/2017&jornal=1&pagina=87&totalArquivos=128 p. 87-90.
» https://pesquisa.in.gov.br/imprensa/jsp/visualiza/index.jsp?data=25/07/2017&jornal=1&pagina=87&totalArquivos=128 - 39 Rudnik LAC, Lyra AM, Barboza FM, Klein T, Kanunfre CC, Farago PV, et al. PEG-PCL nanocapsules containing curcumin: validation of HPLC method for analyzing drug-loading efficiency, stability testing, and cytotoxicity on NIH-3T3 cell line. Braz. Arch. Biol. Technol. 2020;63:e20200234.
- 40 Moreira MS, Rodrigues MP, Ferreira CF, Nienov OT. [Simple and multiple linear regression]. In: Capp E, Nienov OH, editors. Bioestatística quantitativa aplicada [Applied Quantitative Biostatistics]. Porto Alegre: UFRS; 2020. p. 203-4.
- 41 International Council for Harmonisation of Technical Requirements for Pharmaceuticals for Human Use (ICH). Harmonised guideline: validation of analytical procedures Q2(R2). 2023.
- 42 Oliveira ARM, Gaitani CM. Controle de qualidade [Quality Control]. Rio de Janeiro: Atheneu; 2019. v. 11.
- 43 Ding Z, Wang X, Wang L, Zhao Y, Liu M, Liu W, et al. Characterisation of spray dried microencapsules with amorphous lutein nanoparticles: Enhancement of processability, dissolution rate, and storage stability. Food Chem. 2022;383:132200.
- 44 Wang X, Ding Z, Zhao Y, Prakash S, Liu W, Han J, et al. Effects of lutein particle size in embedding emulsions on encapsulation efficiency, storage stability, and dissolution rate of microencapsules through spray drying. Food Sci. Technol. 2021;146:111430.
- 45 Diedrich C. [Preparation, Characterization, Cytotoxicity, and Pharmacokinetics of Chitosan-Coated Nanoemulsion Containing Luteolin for Intranasal Administration in the Treatment of Neuroblastomas] [PhD Dissertation]. Guarapuava: State University of Central-West, Graduate program in chemistry; 2022. 149 p.
- 46 Redondo GP. [Development, characterization and dissolution novel of modified-release polymeric microcapsules of red propolis extract obtained by spray drying] [PhD Dissertation]. Maceió: Federal University of Alagoas, Graduate program in pharmaceutical sciences; 2018. 66 p.
- 47 Santos MNG. [Fruit extracts of Guazuma ulmifolia (mutamba): phytochemical profile,anti-inflammatory evaluation and poly(lactic acid-co-glycolic acid) nanoencapsulation]. [PhD Dissertation]. Brasília: University of Brasília, Graduate program in nanoscience and nanobiotechnology; 2020. 135 p.
- 48 Bernardo AG, Borghi-Pangoni FB, Bruschi ML. Validation and applicability of an HPLC method for analysis of eprinomectin in responsive systems for pour-on administration in cattle. Braz. Arch. Bio.l Technol. 2024;67:e24230344.
- 49 Corbin N, Oliveira R Raynaud Q, Domenicantonio G, Draganski B, Kherif F, et al. Statistical analyses of motion-corrupted MRI relaxometry data computed from multiple scans. J Neurosci. Methods. 2023;398:109950.
-
Editor-in-Chief: Yasmine Mendes Pupo
-
Associate Editor: Najeh Maissar Khalil