 Novel Isocratic HPLC Method for Simultaneous Estimation of Sacubitril and Valsartan in Bulk and Formulation
Abstract
In compliance with ICH requirements, a new selective, precise, and accurate reverse-phase High-Performance Liquid Chromatographic method for valsartan and sacubitril quantification was developed and validated. Eluents were detected at 284 nm. The HPLC method was designed utilizing a C18, (150mm × 4.6mm, 3.5μm) column with 1% Acetic acid in water: Methanol (45:55 v/v) as a mobile phase at a flow rate of 0.8 mL/min. For valsartan and sacubitril, the calibration curves were linear over the concentration range of 10 to 100 ng/mL (R2 = 1) and 20 to 140 ng/mL (R2 = 1), respectively. Valsartan and sacubitril were shown to have average retention times of 5.79 and 7.019 minutes, respectively. Valsartan and sacubitril had average percentage recoveries of 99.83± 0.14 and 100.06± 0.19 percent, respectively. Valsartan and sacubitril had respective LOD values of 0.0958 and 0.1059 ng/mL. The suggested method's intraand inter-day precision values (% RSD) were under 2%. For the simultaneous measurement of valsartan and sacubitril, a straightforward, exact, accurate, linear, and quick RP-HPLC technique was created and verified by ICH recommendations. The findings imply that the devised approach can be used for pharmaceutical formulation and routine bulk measurement of valsartan and sacubitril. The method’s applicability was confirmed through successful analysis of pharmaceutical formulations, indicating its potential utility for routine quality control and stability testing of Sacubitril and Valsartan in combined dosage forms. The choice of gradient elution, despite its complexity, was justified by the need for improved separation and resolution, which are critical for the accurate determination of these therapeutic agents.
Keywords:
Valsartan; Sacubitril; Validation; RP-HPLC; Analytical
HIGHLIGHTS
New HPLC method for measuring valsartan & sacubitril in meds.
Separates &detects both drugs precisely.
Validated according to ICH guidelines (accurate & reliable)
Applicable to routine analysis of pharmaceutical formulations.
INTRODUCTION
Therapies for neurohormonal antagonism, which are traditionally represented by the combination of beta-blockers, mineralocorticoid receptor antagonists (MRA), and angiotensin converting enzyme inhibitors/angiotensin receptor blockers (ACEi/ARB), have significantly improved the course of heart failure with reduced ejection fraction (HFrEF). [1-5] The discovery that sacubitril/valsartan is superior to enalapril in lowering rates of cardiovascular (CV) death or first HF hospitalization (hazard ratio [HR] 0.80, 95% confidence interval [CI] 0.73-0.87), as well as the two single endpoints, represents a recent and significant advancement in medical therapy for HFrEF. This finding led to recommendations to either switch from ACEi/ARB to sacubitril/valsartan in patients with LVEF ≤ 35% who remain symptomatic despite optimal treatment with ACEi, beta-blockers, and MRA (European Society of Cardiology guidelines; class I, level of evidence B) or to switch to sacubitril/valsartan whenever ACEi/ARB are tolerated (American College of Cardiology/American Heart Association guidelines; class I, level of B-Residence BR). [2-7] Vericiguat reduced the important composite endpoint of CV death or HF hospitalization (HR 0.90, 95% CI 0.82-0.98), with a decrease in HF hospitalizations as the main contributing factor. Inducing the synthesis of cyclic guanosine monophosphate, vericiguat is a downstream effector of natriuretic peptides (NPs) including atrial and B-type NP (ANP, BNP), whose circulating levels are enhanced by sacubitril/valsartan together with the various substrates of neurolysin. [9-12] The potent and specific inhibitors dapagliflozin and empagliflozin, which seem to directly affect the heart and vasculature, block the renal sodium-glucose co-transporter SGLT2. [11-14]
Sacubitril (Figure 1) and valsartan (Figure 2), a combination drug used in the treatment of heart failure, have been widely studied for their pharmacological benefits. Various analytical methods have been developed to quantify these drugs in bulk and dosage forms. Among these methods, high performance liquid chromatography (HPLC) has been most commonly employed due to its precision and accuracy. Other methods include ultra-performance liquid chromatography (UPLC), liquid chromatography-tandem mass spectrometry (LC-MS/MS), and spectrophotometric methods. Each technique offers unique advantages in terms of sensitivity, specificity, and applicability to different matrices.


MATERIAL AND METHODS
Chemicals and Reagent: We bought D Sacubitril, Trifluoroacetic Acid, and Valsartan Trisodium Salt Hemi Pentahydrate from TCI Chemicals (India) Pvt. Ltd. in Chennai. Every chemical and reagent that was utilized had at least an analytical grade. Water and methanol of HPLC grade were used in the planned investigation.
Instruments: An HPLC system made by Shimadzu (Japan) was utilized for chromatographic analysis. It had a column oven (CTO-10A (C) vp), pumps (model 2LC-10AD vp), an autosampler (sil-10AD vp), and a UV detector (UV SPD-10A (V) vp). The "Extrapure" water purification system (Lablink) provided HPLC quality waters. An ultrasonicator (PCiAnalyticals) was used to degas the mobile phase. The analytical balance Vibra HT (Essae) was utilized to weigh. Using an X-Bridge Shield, RP18, 150 mm x 4.6 mm, 3.5 µm, at 40 o C, analysis was performed at 254 nm.
Optimization: of RP-HPLC Method To get the best circumstances for the separation of both medications, chromatographic conditions were optimized by infusing standard solutions (20 ng/mL Valsartan and 30 ng/mL Sacubitril) into the HPLC system and allowing them to run in distinct mobile phases.
Preparation of Mobile Phase:
Mobile Phase A
Mixing 0.1 mL of trifluoroacetic acid with 1000 mL of water, the mobile phase is then filtered through a membrane filter (a Millipore Nylon disc filter with a 0.45 μ size). This filtered mobile phase was placed in an ultrasonic bath and sonicated for ten minutes.
Mobile Phase B
Mixing 0.1 mL of trifluoroacetic acid with 1000 mL of acetonitrile, the mobile phase is then filtered through a membrane filter (a Millipore Nylon disc filter with a 0.45 μ opening). This filtered mobile phase was placed in an ultrasonic bath and sonicated for ten minutes.
Preparation of Diluent
Combine Mobile Phases A and B in a 50:50 v/v ratio and allow to degas.
Preparation of standard stock solution
Valsartan (Stock I) and sacubitril (Stock II) stock solutions (10 mg/10 mL) were made independently in diluent and filtered using a 0.45-m nylon membrane syringe filter.
Preparation of standard calibration curve
Stocks I and II were combined and appropriately diluted with methanol to produce seven calibrations standards (CAL STD) that combined sacubitril and valsartan: Calibration standards for sacubitril and valsartan, respectively, representing 10, 15, 20, 40, 60, 80, and 100 ng/mL and 20, 30, 60, 80, 100, 120, and 140 ng/mL l strength. Following the injection of each solution into the HPLC columns, the peak area of each solution was determined. Plotting the peak area Vs concentration (μg) standard calibration curves.
Method Validation
The developed procedure underwent ICH guidelines validation. System appropriateness, linearity, range, LOD, LOQ, accuracy, precision, and stability were among the several analytical technique validation characteristics that were evaluated.
System Suitability The system suitability test was conducted using a freshly made standard working solution that contained 25 ng/mL of sacubitril and 15 ng/mL of valsartan, before the main analysis. Five replicates of the aforementioned solutions were tested, and the retention time, peak area, and theoretical plates were examined. Less than 2% relative standard deviation (RSD) was set for retention duration and peak area, and more than 1500 theoretical plates were required for both sacubitril and valsartan in the system suitability tests. Using the following formula, the resolution (acceptance criteria > 3) was determined.
Where W1 and t1 represent the peak width and retention time at half height of valsartan, and t2 and W2 represent the peak width and retention time at half height of sacubitril.
Validation Parameter:
Linearity
Seven distinct CAL STDs were used to calculate the proposed method's linearity. Following the study of CAL STDs, linear regression analysis was carried out and calibration curves showing concentration vs. peak area were demonstrated.
Accuracy (% Recovery)
Recovery studies were carried out using the usual addition method with drug concentrations at 80%, 100%, and 120% to guarantee the accuracy of the procedure. The amount discovered and the actual amount added were used to compute the percent recovery.
Precision
At three distinct levels-LQC (valsartan 15 ng/mL + sacubitril 25 ng/mL), MQC (valsartan 50 ng/mL + sacubitril 70 ng/mL), and HQC (valsartan 90 ng/mL + sacubitril 130 ng/mL)-the proposed method's precision was assessed. By examining the solutions at various times during the same day and three days in a row, the intra-day and inter-day precision was ascertained.
LOD and LOQ
The CAL STD-1 was examined to determine the ASTM LOD and LOQ. Using the HPLC software setting "Annotations," the CAL STD-1 chromatogram was processed. The results were given as LOD and LOQ for sacubitril and valsartan.
Estimation of Valsartan and Sacubitril in pharmaceutical formulation
Place 16 whole tablets, or 800 mg of Valsartan Sacubitril, into a 250 mL volumetric flask. Next, add 170 ml of diluent, and sonicate for 20 to 25 minutes while shaking occasionally. Finally, top up the volume with a diluent and thoroughly mix. This solution should be filtered using a 0.45 µm Teflon filter. Three pre-optimized HPLC settings were used to examine a predetermined volume of solution. The pharmaceutical formulation's contents were determined by comparing the sample's mean peak area to the standards.
RESULTS
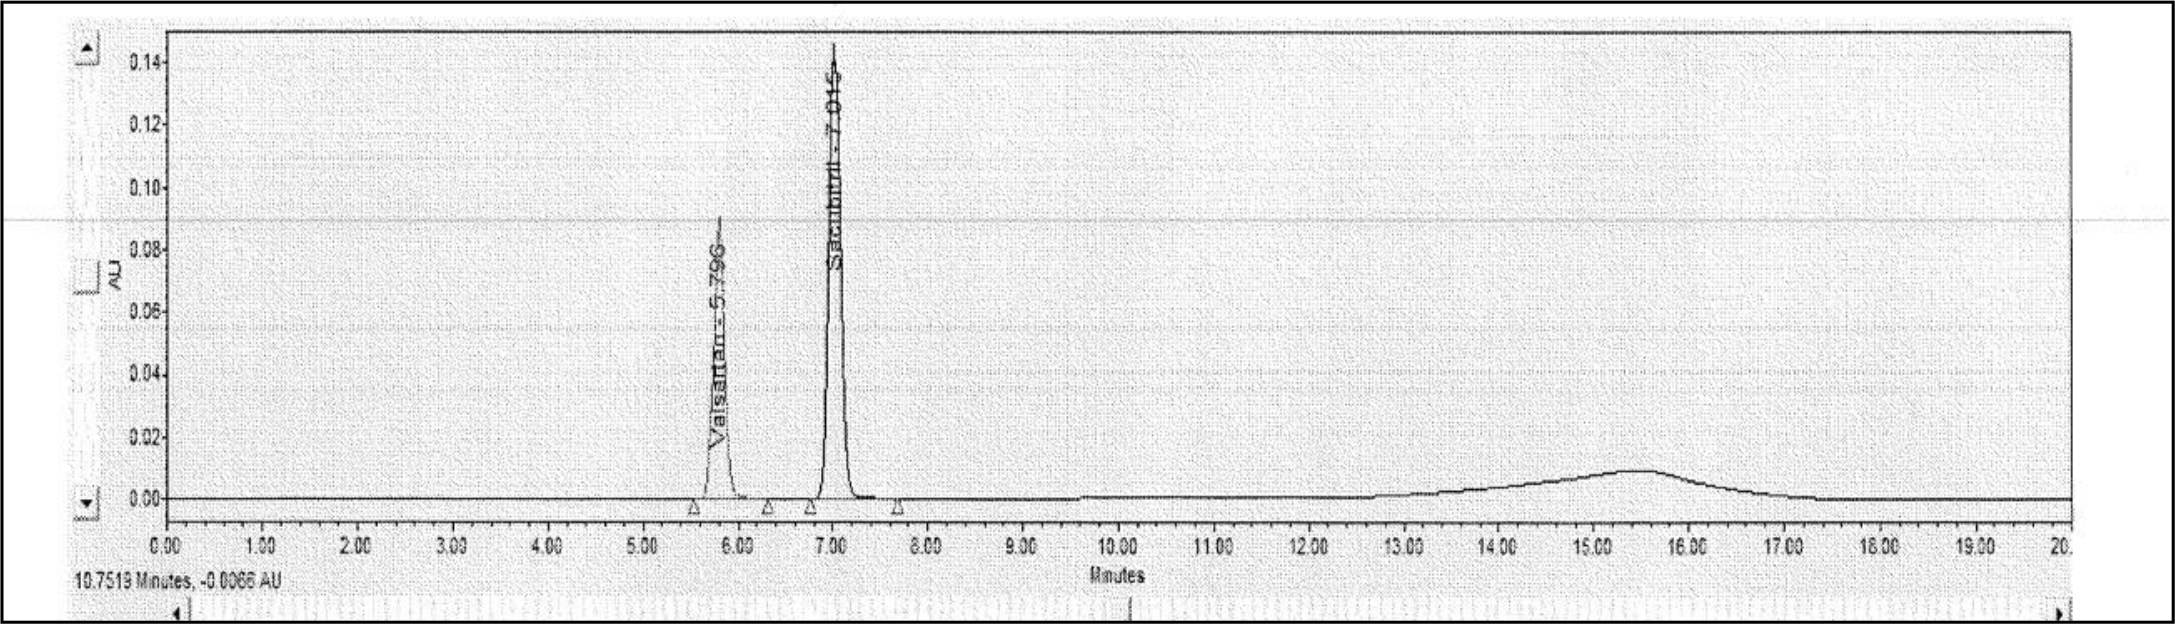
Implementing a satisfactory resolution between the two chemicals was deemed to be the method's most crucial criterions, or resolution. The solubility and pKa of both compounds were used to determine the optimal mobile phase composition. The resulting optimized chromatographic conditions are listed in Table 1 and yield the best resolution. Valsartan and sacubitril had retention times of 5.79 and 7.05 minutes, respectively, under these circumstances (Figure 3)

System suitability
RSD of every parameter was computed during the system suitability test to assess the suggested method's applicability. Based on the findings, it was discovered that there were more than 2000 theoretical plates and that the percentage RSD for both peak area and retention duration was less than 2. (Table 2).
Method Validation:
Linearity and Range:
The two key analytical technique parameters that show the bounds within which the planned approach should be applied for the best results are linearity and range. A seven-point calibration curve for valsartan (10-100 ng/mL) and sacubitril (20-140 ng/mL) was created, taking into account the critical necessity of linearity and range. Table 3 shows various concentrations and peak area values. The equation y = 10053x + 108.42 for valsartan and y = 10656x + 26.27 for sacubitril, with correlation coefficients of 1 and 1, respectively, was obtained from the calibration curve using least square regression analysis (Figure 4 and 5). The results of the linearity analysis showed that the response and medication concentration were linearly correlated in the range of 10-100 ng/mL for valsartan and 20-140 ng/mL for sacubitril


Accuracy (% Recovery)
Accuracy can be defined as how closely test results match the true value found using the suggested procedures. An analytical method's correctness should be determined throughout its calibration range to ensure that the results are accurate at every stage of the determination process. Accuracy for sacubitril and valsartan was assessed by recovery trials. Valsartan and sacubitril were shown to have mean recovery rates of 99.98 and 100.18%, respectively, at 80, 100, and 120% standard addition. It was discovered that the relative standard deviation (% RSD) was less than 2 (Table 4). It was determined from the accuracy studies' findings that the analytical method demonstrated good accuracy.
Precision
By analyzing LQC, MQC, and HQC STDs containing both medications at concentrations spanning the whole calibration range, precision was investigated. The findings for the intraand inter-day precision research, are presented in percentage RSD (Tables 5 and 6). For valsartan and sacubitril, the percent RSD values of the intra-day precision study were 0.1858 and 0.9851, respectively, while the inter-day precision values were 0.1505 and 1.081, respectively. The analytical method was shown to have good repeatability.
LOD and LOQ
Limitation of detection LOD (limit of quantification) and signal-to-noise ratio of three Based on the signal-to-noise ratios, the LOQ (signal-to-noise ratio of 10) was calculated. The values for sacubitril were 0.1059 and 0.5097 ng/mL, while the values for valsartan were 0.0958 and 0.4587 ng/mL, respectively.
Estimation of Valsartan and Sacubitril in Pharmaceutical Formulation
Valsartan and sacubitril in pharmaceutical formulations were successfully determined using the suggested validated analytical approach. Typical HPLC chromatograms produced by analyzing pharmaceutical formulations are shown in Figure 3. Assay findings (n = 5) showed that 99.76% of sacubitril and 99.58% of valsartan were obtained. The assay's findings show that the excipients don't interfere with the method's abilities to analyze valsartan and sacubitril.
CONCLUSION
A straightforward, sensitive, exact, and accurate RP-HPLC method was created and proven to be effective for simultaneously measuring sacubitril and valsartan. Additionally, it was discovered that the devised methods could be applied to the regular examination of pharmaceutical compositions that contained sacubitril and valsartan.
Concluding Remarks and Future Perspectives
The newly developed RP-HPLC method has demonstrated high sensitivity, precision, and accuracy for the simultaneous quantification of sacubitril and valsartan. This method holds significant promise for routine analysis in pharmaceutical formulations, ensuring consistent quality control and reliable results.
Future Perspectives:
-
Wider Applications: The validated method could be further explored for use with other drug combinations or in different pharmaceutical matrices.
-
Automation and Integration: Future research could focus on automating this0method forhigh-throughput screening, enhancing efficiency in pharmaceutical labs.
-
Regulatory Acceptance: Efforts should be directed towards obtaining regulatory validation and acceptance, ensuring the method meets international standards.
-
Environmental Impact: Considering green chemistry approaches to minimize the environmental footprint of the analytical process
-
Funding:
This research was self-funded.
Acknowledgement:
The authors express their gratitude to the Department of Pharmaceutical Sciences, School of Health Sciences and Technology, Dr. Vishwanath Karad MIT World Peace University for providing the necessary infrastructure and research facilities for this study. We would also like to pay gratitude to Dr. Alka Karnik for their support.
Data availability statement:
Research data are available in the body of the manuscript.
REFERENCES
- 1 Eissa MS, Abou Al Alamein AM. Innovative spectrophotometric methods for simultaneous estimation of the novel two-drug combination: sacubitril/valsartan through two manipulation approaches and a comparative statistical study. Spectrochim Acta A Mol Biomol Spectrosc. 2018;193:365-74.
- 2 Voors AA, Dorhout B, Van Der Meer P. The potential role of valsartan+AHU377 (LCZ696) in the treatment of heart failure. Expert Opin Investig Drugs. 2013;22(8):1041-7.
- 3 Patel KH, Luhar SV, Narkhede SB. Simultaneous estimation of sacubitril and valsartan in synthetic mixture by RP-HPLC method. J Pharm Sci Biosci Res. 2016;6(3):262-9.
- 4 Parambi DT, Mathew M, Ganesan V. A validated stability indicating HPLC method for the determination of valsartan in tablet dosage forms. J Appl Pharm Sci. 2011;1(4):97-9.
- 5 Kharoaf M, Malkieh N, Alhasan AM, Shubitah R, Jaradat N, Zaid AN. Tablet formulation and development of a validated stability indicating HPLC method for quantification of valsartan and hydrochlorothiazide combination. Int J Pharm Pharm Sci. 2012;4(5):683-7.
- 6 Tatar S, Saglik S. Comparison of UV- and second derivative-spectrophotometric and LC methods for the determination of valsartan in pharmaceutical formulation. J Pharm Biomed Anal. 2002;30(2):371-5.
- 7 Koseki N, Kawashita H, Hara H, Niina M, Tanaka M, Kawai R, et al. Development and validation of a method for quantitative determination of valsartan in human plasma by liquid chromatography-tandem mass spectrometry. J Pharm Biomed Anal. 2007;43(5):1769-74.
- 8 Vercruysse J, Charlier J, Van Dijk J, Morgan ER, Geary T, Samson-Himmelstjerna GV, et al. Control of helminth ruminant infections by 2030. Parasitology. 2018;145(13):1655-64.
- 9 Avci B, Filazi A. The effects of heat applications on macrocyclic lactone-structured antiparasitic drug residues in cows' milk. Food Addit Contam Part A Chem Anal Control Expo Risk Assess. 2020;37(7):1145-55.
- 10 Chunduri RHB, Dannana GS. Development and validation of a reliable and rapid LC-MS/MS method for simultaneous quantification of sacubitril and valsartan in rat plasma and its application to a pharmacokinetic study. Biomed Chromatogr. 2016;30(9):1467-75.
- 11 International Conference on Harmonisation. Validation of analytical procedures: text and methodology Q2(R1). Geneva: ICH; 2005.
- 12 Satana E, Altinay S, Goger NG, Ozkan SA, Sentürk Z. Simultaneous determination of valsartan and hydrochlorothiazide in tablets by first-derivative ultraviolet spectrophotometry and LC. J Pharm Biomed Anal. 2001;25(5-6):1009-13.
- 13 Mishra S, Patel CJ, Patel MM. Development and validation of a stability-indicating chromatographic method for simultaneous estimation of sacubitril and valsartan in pharmaceutical dosage form. Int J Appl Pharm. 2017; 9(5):1-8.
-
14 Ramachandran S, Mandal BK, Navalgund SG. Stability-indicating HPLC method for the simultaneous determination of valsartan and ezetimibe in pharmaceuticals. Trop J Pharm Res. 2014;13(5):809-817. doi:10.4314/tjpr.v13i5.19
» https://doi.org/10.4314/tjpr.v13i5.19 - 15 Budavari S, editor. The Merck index. 14th ed. Whitehouse Station, NJ: Merck and Co. Press; 2006.
- 16 The United States Pharmacopoeia. Vol. 2. Rockville, MD: US Pharmacopoeia Convention, INC; 2008. p. 3496-8.
- 17 Reddy YK, Nousheen G. Formulation and evaluation of oxcarbazepine sustained release matrix tablets. Asian J Res Pharm Sci. 2020;10(3):161-4.
- 18 Patil P, Rao SB, Kulkarni SV, Surpur BC, Ammanage A. Formulation and in vitro evaluation of floating matrix tablets of ofloxacin. Asian J Res Pharm Sci. 2011;1(1):17-22.
- 19 Neeraj SV, Rohini RP, Virendra GK, Prajakta RG, Subhash LB, Avinash AH. Central nervous system activity of Argyreia speciosa. J Pharm Res. 2009;8(3):152-8.
- 20 Vanshiv SD, Formulation and development of gastro-retentive dipyridamole microspheres: proof of concept by in vitro-in vivo assessment. Indian J Pharm Sci. 2018;80(1):181-91.
- 21 Lee W, Yoo H, Ku SK, Kim JA, Bae JS. Anticoagulant activities of piperlonguminine in vitro and in vivo. BMB Rep. 2013;46(10):484-9.
- 22 Félix-Silva J, Souza T, Camara RBBG. In vitro anticoagulant and antioxidant activities of Jatropha gossypiifolia L. (Euphorbiaceae) leaves aiming therapeutical applications. BMC Complement Altern Med. 2014;14:405.
- 23 Khalid AM. In-vitro comparative study on blood clotting time of some plants extracts and heparin when infected with snakebite. Res J Pharm Technol. 2021;14(6):2915-8.
- 24 Badgujar SB, Mahajan RT, Chopda MZ. Wound healing activity of latex of Euphorbia nivulia Buch.-Ham. in mice. Res J Pharmacol Pharmacodyn. 2009;1(2):90-2.
- 25 Prabakaran L, Hydrophilic polymers matrix systems of nifedipine sustained release matrix tablets: formulation optimization by response surface method (Box-Behnken technique). Der Pharm Sin. 2010;1(1):147-65.
- 26 Songire PR, Aher SS, Saudagar RB. Recent research on matrix tablets for controlled release - a review. Asian J Pharm Tech. 2015;5(4):214-21.
- 27 Komarala EP, Das N, Swain SK, Banik N, Das HK. Studies on drug release kinetics and antibacterial activity against drug-resistant bacteria of cefotaxime sodium loaded layered double hydroxide-fenugreek nano-hybrid. New J Chem. 2018;42(1):129-36.
- 28 Huiming J, Formulation and evaluation of gastro-retentive floating drug delivery system of dipyridamole. Drug Dev Pharm Ind. 2014;Early Online:1-7.
- 29 Naga MG, Development of highly porous gastro-retentive dipyridamole tablets using a sublimation method. Indo Am J Pharm Sci. 2016;3(6):662-71.
- 30 Yoshiki K, Kondo S, Okudaira N. Improved dissolution of dipyridamole with the combination of pH-modifier and solid dispersion technology. Chem Pharm Bull. 2017;65(5):426-31.
- 31 Wójcik-Pastuszka D, Krzak J, Macikowski B, Berkowski R, Osiński B, Musiał W. Evaluation of the release kinetics of a pharmacologically active substance from model intra-articular implants replacing the cruciate ligaments of the knee. Materials. 2019;12(1):1.Brown DG, Eric CW, Elliot WL. A review of traditional and novel oral anticoagulant and antiplatelet therapy for dermatologists and dermatologic surgeons. J Am Acad Dermatol. 2015;72(3):524-34.
- 32 Mohamed AA, Ali SI, Sameeh MY, Abd El-Razik TM. Effect of solvents extraction on HPLC profile of phenolic compounds, antioxidant and anticoagulant properties of Origanum vulgare. Res J Pharm Technol. 2016;9(11):2009-16.
- 33 Gogoi D, Arora N, Kalita B, Sarma R. Anticoagulant mechanism, pharmacological activity, and assessment of preclinical safety of a novel fibrin(ogen)olytic serine protease from leaves of Leucas indica. Sci Rep. 2018;8:6210.
-
Editor-in-Chief:
Paulo Vitor Farago
-
Associate Editor:
Paulo Vitor Farago