 Optimization of DNA Extraction and RAPD Protocols for Dry Capsicum Seeds
Abstract
Genetic analyses through molecular markers always depend on efficient protocols for DNA extraction and standardized PCR conditions. Random Amplified Polymorphic DNA (RAPD) is an inexpensive protocol that can provide information about the genetic diversity among Capsicum accessions within a germplasm bank, but it is highly sensitive to reaction conditions and manipulation. This work presents an optimized protocol for DNA isolation from dry Capsicum seeds, and a standardization of five conditions for PCR using RAPD primers. The RAPD protocol was optimized for the following parameters: 50 ng of DNA template per mix, 2.5 mM MgCl2, 200 µM dNTP's, 25 ng of primer per mix, and 45 thermal cycles, resulting in reproducible and clear amplified fragments. Good quality products were presented in the extractions and amplifications carried out; therefore, the optimized protocols are sufficient to be used in future work with RAPD.
Keywords:
DNA isolation; Molecular analysis; PCR; Primer; Pepper
HIGHLIGHTS
Protocol for inexpensive and quick DNA isolation from dry Capsicum seeds.
Optimization of PCR conditions for non-fresh plant tissue DNA.
Standardized protocol for molecular analysis of Capsicum diversity through RAPD.
INTRODUCTION
Capsicum plants, popularly known as peppers and bell peppers, are native to Central and South America [1]. They are cultivated in different regions of the world and are present in the cuisine of numerous nations [2,3]. Peppers are known for their wide phenotypic and taxonomic diversity, which confers a high versatility to this crop, having several applications in food, industry or pharmacology [4]. The Capsicum genus comprises 35 species, most of which are wild, and only five (C. annuum, C. frutescens, C. chinense, C. baccatum and C. pubescens) are domesticated and cultivated [5,6].
Because of the social and economic potential of these plants, several studies on the genetic diversity of the genus have been carried out. The most recent works, cluster the main species into three large clades (Annuum, Baccatum and Pubescens) [5]. However, the evolutionary relation among wild and domesticated species is not so clear. For example, the classification of C. chacoense is still debated ; while some authors classify it as close to the Annuum complex [7], others place it closer to C. baccatum [5], or even C. pubescens [6]. C. praetermissum has already been identified as a variety of C. baccatum - C. baccatum var. praetermissum [8,9], while other authors highlight that there is sufficient evidence to separate them as two distinct species [10]. In this scenario, molecular markers are a useful tool to obtain data on the genotypes of these plants, and elucidate taxonomic questions [11].
The Random Amplified Polymorphic DNA (RAPD) technique emerged in 1990, using short primers with a random sequence, thus eliminating any need for prior information about the genome of the species to be studied [12]. RAPD markers are simple, fast and low cost and it can be done with small amount of DNA, as long as genetic material is integrate and impurities are kept in minimum level, the obtained results can be reproducible [13,14].
For such analyses, fresh leaf fragments are commonly used to extract total DNA from plants [15]. However, sometimes only dried seeds are available. Studies indicate that Capsicum seeds have large amounts of fats, proteins, fibers and secondary metabolites, such as polysaccharides and phenolic compounds, including capsaicinoids [16-18], which might interfere with the DNA extraction process and subsequently PCR amplification.
In this scenario, there is a need to obtain a good protocol for DNA extraction from Capsicum seeds, as well as an optimized protocol for sample amplification via PCR-RAPD. This work describes an improved protocol for isolating total genomic DNA from Capsicum seeds, and an optimized process for RAPD amplification.
MATERIAL AND METHODS
Plant Material
The seed accessions used in this study were taken from the working collection of the Laboratory of Plant Biotechnology of the São Paulo State University, Assis. The chosen species were: Capsicum annuum, C. baccatum, C. chacoense, C. chinense, C. flexuosum, C. frutescens and C. praetermissum (Table 1).
DNA Extraction
The total genomic DNA extraction and isolation protocol was based on Doyle and Doyle [19], adding a step to remove polysaccharides at the end of the extraction process as described by Fang, Hammar and Grumet [20].
Approximately 100 mg of seeds were macerated using liquid nitrogen. To the powder was added 1 mL of previously prepared 2X CTAB extraction buffer (1,4 M NaCl; 100 mM Tris-HCl pH 8,0; 20 mM EDTA; 2% CTAB; 2% PVP-40). 50 µL of β-mercaptoethanol and 10 µL of proteinase K (10 mg/mL) were added to this solution. The samples were poured into 2 mL microtubes and placed in a water bath at 60 °C for 45 minutes.
After the water bath, the samples were cooled down until they reached room temperature. A total of 600 µL of chloroform: isoamyl alcohol (24:1) (CIA) were added, and the microtubes shaken to form homogeneous solution. Then, microtubes were centrifuged at 13,000 rpm for 10 minutes at 4 °C. and the supernatant was isolated and used for a subsequent centrifugation in the same conditions. Following this step, the same volume of isopropanol was added to the final supernatants and the samples were incubated at -20 °C overnight.
After overnight DNA precipitation, the microtubes were centrifuged at 13,000 rpm for 10 minutes at 4 °C to form the DNA pellet. This pellet was washed with 70% ethanol three times and resuspended in 100 µL of TE buffer (10 mM Tris-HCl pH 7.5; 1 mM EDTA). This resulted in a thick and opaque resuspension due to polysaccharides that could be cleaned with the addition of 65 µL of 5 M NaCl, followed by the addition of an equal volume of ice-cold isopropanol, centrifugation of the solution at 13,000 rpm for 10 minutes at 4 ºC, and washing with 70% ethanol. The DNA eluted in TE buffer was kept at -20 °C until analysis and amplification.
Assessment of the quality and quantity of extracted DNA
The extracted genomic DNA was qualitatively evaluated through electrophoresis in a 0.8% agarose gel stained with ethidium bromide, in order to observe the presence of contaminants like RNA, polysaccharides and proteins, or degradation. The concentration and purity of the isolation were measured through spectrophotometer at 260 nm and 280 nm.
Optimization of the PCR protocol
To carry out the optimization, 5 samples from 5 different accessions of C. annuum were selected (1002, 1003, 1004, 1006, 1025). The primer OPC-05 - GATGACCGCC was used during amplification experiments to optimize RAPD amplification of study samples.
The parameters optimized during the work were selected based on the optimization made by Padmalatha and Prasad [21]; they are: amount of template DNA, concentration of MgCl2, concentration of dNTPs, primer concentration and number of cycles. The DNA samples were amplified in a thermocycler (Applied Biosystems model 9700 PCR system). Each 13 µL of reaction mix contained about 30 ng of DNA, PCR Buffer 1X, 2.5 mM MgCl2, 15 pmol of primer, 200 µM of each dNTP, and 0.2 U of Taq DNA polymerase. The amplified products were visualized by electrophoresis on a 1.5% agarose gel. The thermocycler was programmed for an initial denaturation at 96°C for 3 min, 45 cycles of 92°C for 2 min, 38°C for 1 min, and 72°C for 2 min, and a final extension at 72°C for 5 min.
After optimizing each parameter, a PCR run was performed with all 24 samples using OPC-05, OPE-01, OPC-08 and OPC-11 primers to ensure the reproducibility of the protocol. In each well of the gel, 13 μL of DNA amplified with 3 μL of dye (0.25% bromophenol blue, 40% sucrose) was applied, and a 1 Kb DNA Ladder molecular weight marker was applied to the last well. The gel was stained with Ethidium Bromide and photographed under UV light. The tested concentrations of each parameter can be found in Table 2.
The evaluation of the results was based on the size, staining intensity and robustness of the amplified band.
Tested PCR parameters, range of variation of the parameters, optimal condition assessed and comments on the observed results.
RESULTS AND DISCUSSION
DNA extraction
DNA extraction can be improved by adjusting a few steps from Doyle and Doyle's original protocol. Initially, a dark color was observed in the eluted DNA, which may indicate the presence of oxidized polyphenols. Khanuja and coauthors [22] reported that higher concentrations of β-mercaptoethanol in the extraction mix help to reduce the level of polyphenols in the samples. A simple solution would be an additional step to rinse the possible contaminants. Wherefore the inversion step with CIA (chloroform: isoamyl alcohol) and centrifugation had to be repeated more than once to ensure that the removed supernatant acquired a clear appearance. The chloroform, a nonpolar solvent, removes lipids and cellular debris leaving the DNA in the aqueous phase, meanwhile the isoamyl alcohol stabilizes the interface between inorganic and organic layers [23].
At the end of the extraction, the presence of polysaccharides was observed in the DNA suspended in TE buffer. Since plants carry polysaccharides, which may be co-extracted during the DNA isolation and may affect PCR efficiency or even inhibit it, mimicking the DNA structure [24,25], polysaccharides were removed by applying the NaCl cleaning described by Fang, Hammar e Grumet (1992).
Leaf protocols generally use RNAse treatment, as the presence of this nucleic acid can impair DNA amplification [21]. The isolated DNA from seeds did not show contamination by RNA, which can be observed through electrophoresis analyzes of genomic DNA (Figure 1). This is probably due to the non-viability of the seeds used in the study.

Electrophoresis of genomic DNA from the used accessions. Accesses are respectively from left to right: (a) 431, 435, PLA 018, PLA 040, PCO 095, CBL, (b) 2013, 2042, 4000-2, 4000-5, 530 (sample 1), 530 (sample 2). * Molecular weight marker.
The DNA quantification showed that protocol could extract large amounts of DNA from the samples (Table 3). Despite the condition and purity of the samples being around 1.2 (far from the ideal of 1.8-2.0), indicating possible protein or solvent presence, these final contaminations were not enough to hinder amplification. It is known that low levels of impurities in extracted DNA do not impair PCR amplification, as long as they don't obstruct or inhibit the DNA polymerase [24].
Optimization of the RAPD-PCR protocol
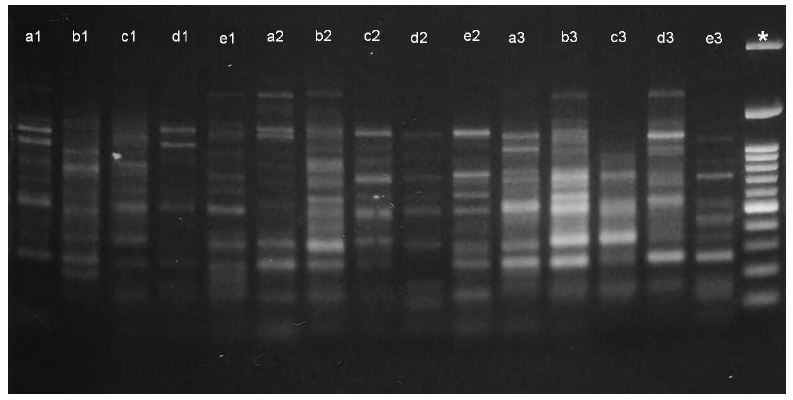
The PCR mix composition, should be optimized for each protocol, since the chose of the primers, dNTPs composition, DNA polymerase etc., may influence the amplification results [26]. The optimized PCR conditions chosen here (template DNA concentration, MgCl2 concentration, primer concentration, dNTPs concentration and number of cycles) showed a difference in obtaining analyzable and reproducible bands (Table 2; Figures 2 to 4).
Although is common to quantify DNA in ng/µL, it should be noted that the ideal is molecules count, circa 104 to 107 molecules to target the PCR. The more target sequences, the more robust results will be [26,27]. The finds here show that the highest volume tested, 30 ng per reaction mix, presented stronger and visible bands (Figure 2).

Electrophoresis resulting from the test with the amount of DNA carried out with the samples 1025 (a), 1006 (b), 1004 (c), 1003 (d), 1002 (e). The first five amplifications were made with 9 ng of DNA (a1-e1), the next five made with 15 ng (a2-e2), and the last five with 30 ng (a3-e3). The result obtained shows better amplification using 30 ng. *Molecular weight marker.
Another important reagent is the divalent cation in amplification mix, usually magnesium is chosen for its binding properties. The Mg²+ reacts to the deoxyribonucleotides triphosphate activating the Taq polymerase and binding the primer to the template. When the concentration is too low, primer cannot anneal properly to the DNA; on the other hand, when the Mg²+ concentration is excessive, the bond formed in the annealing phase is so strong that it cannot denature during the heating phase [28]. Most protocols use between 1.5 and 2.5 mM of magnesium in the reaction however authors had positive results from 0.5, to 6.5 mM [27,29,30].
This work evaluated the common range 1.5, 2.0 and 2.5 mM, the latest exhibiting the best results (Figure 3).

Electrophoresis resulting from the test with quantities of MgCl2 carried out with the samples 1025 (a), 1006 (b), 1004 (c), 1003 (d), 1002 (e). The first five samples were amplified with 1.5 mM MgCl2 (a1-e1), the next five with 2.0 mM (a2-e2), and the last five with 2.5 mM (a3-e3). *Molecular weight marker.
Deoxynucleotide triphosphates (dNTPs) are essential for the assembly of new nucleic acid chains, as they are the monomers used by polymerase during DNA synthesis reaction. However high concentrations of dNTPs in the reaction can saturate the active site of the enzyme, hampering amplification [31]. Concentrations between 20 and 200 µM of each dNTP are recommended.
The concentration here evaluated were 50, 100 and 150 µM of each dNTPs. Best results are observed in Figure 4, in the 50 µM concentration.

Electrophoresis resulting from the test with quantities of dNTPs carried out with the samples 1025 (a), 1006 (b), 1004 (c), 1003 (d), 1002 (e). The first five samples were amplified with 50 µM (a1-e1), the next five with 100 µM (a2-e2), and the last five with 200 µM (a3-e3). *Molecular weight marker.
Primer concentration typically follow the proportion: 1-2 pmol of primer to 10 pg of template; meaning 0.1-0.5 µM in a 50 µL reaction mix. The excess of primer is necessary to increase molecule copies exponentially during the cycles [26]. In our findings the best result occurs with the higher primer concentration, despite the other concentration presenting a visible result of the amplified bands (Figure 5).

Electrophoresis resulting from the test with quantities of primers carried out with the samples 1025 (a), 1006 (b), 1004 (c), 1003 (d), 1002 (e). The first five samples were amplified with 15 pmol (a1-e1), the next five with 20 pmol (a2-e2), and the last five with 25 pmol (a3-e3). *Molecular weight marker.
The choice for the number of cycles, depends on the copies of the DNA template. Most works suggest 25 to 30 cycles, but others reached 50 cycles [28,32]. In theory, only 50 molecules of DNA are enough in the beginning of the reaction to produce visible bands after 40 cycles. If the number of templates is unknown, a “plateau phase” will be reached in about 50 cycles [26].
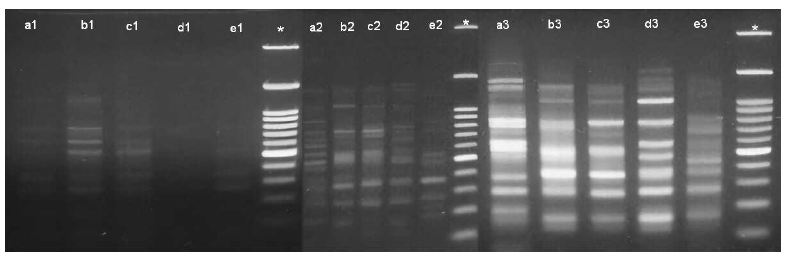
We observed that with 40 cycles, it was possible to obtain lighter bands, while the tests with 45 cycles, bands were thicker and brighter (Figure 6).

Electrophoresis resulting from the test with different number of cycles with the samples 1025 (a), 1006 (b), 1004 (c), 1003 (d), 1002 (e). The first five amplifications were made with the thermocycler programmed for 35 cycles, the next five with 40 cycles, and the last five with 45 cycles. *Molecular weight marker.
As a final test to ensure the reproducibility of the protocol, it was carried out an amplification using all of the 24 accessions. As showed in Figures 7 to 10, the results obtained from optimized RAPD-PCR protocol generated clear bands with information about the genetic variability of the accessions.

Amplification of all samples using the OPC-05 primer. Accesses are respectively from left to right: 1025, 1006, 1004, 1003, 1002, 1018, 2001, 2013, 2042, 4000-2, 4000-5, 530, 431, 435, PLA 018, PLA 040, PCO 095, CBL, 2014, LL 1967, BGH 6019, BGH 6703, PCO 078, CF 1967. *Molecular weight marker.

Amplification of all samples using the OPE-01 primer. Accesses are respectively from left to right: 1025, 1006, 1004, 1003, 1002, 1018, 2001, 2013, 2042, 4000-2, 4000-5, 530, 431, 435, PLA 018, PLA 040, PCO 095, CBL, 2014, LL 1967, BGH 6019, BGH 6703, PCO 078, CF 1967. *Molecular weight marker.

Amplification of all samples using the OPC-08 primer. Accesses are respectively from left to right: 1025, 1006, 1004, 1003, 1002, 1018, 2001, 2013, 2042, 4000-2, 4000-5, 530, 431, 435, PLA 018, PLA 040, PCO 095, CBL, 2014, LL 1967, BGH 6019, BGH 6703, PCO 078, CF 1967. *Molecular weight marker.

Amplification of all samples using the OPC-11 primer. Accesses are respectively from left to right: 1025, 1006, 1004, 1003, 1002, 1018, 2001, 2013, 2042, 4000-2, 4000-5, 530, 431, 435, PLA 018, PLA 040, PCO 095, CBL, 2014, LL 1967, BGH 6019, BGH 6703, PCO 078, CF 1967. *Molecular weight marker.
CONCLUSION
This worked showed that it is possible to achieve DNA isolation from dry Capsicum seeds, as well as standardize PCR-RAPD reaction. The optimized conditions resulted in reproducible and clear amplified fragments, indicating that they are sufficient to be used in future work with RAPD. Furthermore, molecular analysis by RAPD-PCR will be able to generate information about the genetic diversity among Capsicum accessions within a seed germplasm bank. This study demonstrates the importance of well-established protocols for obtaining reliable results in analyzes of genetic diversity in plants.
Acknowledgments
We acknowledge the infrastructure and technical support of Laboratory of Plant Biotechnology of FCL-Assis.
REFERENCES
- 1 Paran I, Ben-chaim A, Kang BC, Jahn M. Capsicums. In: Kole C, editor. Genome Mapping and Molecular Breeding in Plants, Volume 5 - Vegetables. Springer - Verlag Berlim Heidelberg; 2007;209-26.
- 2 Naegele RP, Mitchell J, Hausbeck MK. Genetic diversity, population structure, and heritability of fruit traits in Capsicum annuum. PLoS One. 2016;11(7):1-17.
- 3 Tripodi P, Kumar S. The Capsicum Crop: An Introduction. In: Ramchiary N, Kole C, editors. The Capsicum Genome. Springer Nature Switzerland; 2019. p. 1-8.
-
4 Ramírez-Meraz M, Méndez-Aguilar R, Zepeda-Vallejo LG, Hernández-Guerrero CJ, Hidalgo-Martínez D. Exploring the chemical diversity of Capsicum chinense cultivars using NMR-based metabolomics and machine learning methods. Food Res Int [Internet]. 2024;113796. Available from: https://doi.org/10.1016/j.foodres.2023.113796
» https://doi.org/10.1016/j.foodres.2023.113796 - 5 Liu F, Zhao J, Sun H, Xiong C, Sun X, Wang X, et al. Genomes of cultivated and wild Capsicum species provide insights into pepper domestication and population differentiation. Nat Commun. 2023;14(1):5487.
- 6 Tripodi P, Rabanus-Wallace MT, Barchi L, Kale S, Esposito S, Acquadro A, et al. Global range expansion history of pepper (Capsicum spp.) revealed by over 10,000 genebank accessions. Proc Natl Acad Sci USA. 2021;118(34):e2104315118.
- 7 Ince AG, Karaca M, Onus AN. Genetic relationships within and between Capsicum species. Biochem Genet. 2010;48(1-2):83-95.
- 8 Albrecht E, Zhang D, Mays AD, Saftner RA, Stommel JR. Genetic diversity in Capsicum baccatum is significantly influenced by its ecogeographical distribution. BMC Genet. 2012;13:1-15.
- 9 Hunziker AT. [Studies on Solanaceae VII. Contribution to the knowledge of Capsicum and allied genera (Witheringia, Acnistus, Athenaea, etc.). Third part]. Kurtziana. 1971;6:241-59.
- 10 Barboza GE, García CC, Bianchetti LB, Romero MV, Scaldaferro M. Monograph of wild and cultivated chili peppers (Capsicum L., Solanaceae). PhytoKeys. 2022;200:1-423.
- 11 Adetula OA. Genetic diversity of Capsicum using Random Amplified Polymorphic DNAs. Afr. J Biotechnol. 2006;5(2):120-2.
- 12 Williams JGK, Kubelik AR, Livak KJ, Rafalski JA, Tingey SV. DNA polymorphisms amplified by arbitrary primers are useful as genetic markers. Nucleic Acids Res. 1990;18(22):6531-5.
- 13 Bhadragoudar MR, Patil CG. Assessment of genetic diversity among Capsicum annuum L. genotypes using RAPD markers. Afr. J Biotechnol. 2011;10(76):17477-83.
-
14 Kumar NS, Gurusubramanian G. Random amplified polymorphic DNA (RAPD) markers and its applications Molecular Phylogeny of Insects View project. Sci Vis [Internet]. 2011;11(3):116-24. Available from: www.usask.ca/.../pawlin/
» www.usask.ca/.../pawlin/ - 15 Semagn K. Leaf tissue sampling and DNA extraction protocols. In: Besse P, editor. Molecular Plant Taxonomy Methods in Molecular Biology. Totowa, NJ: Humana Press; 2014. p. 53-67.
- 16 Antonio AS, Wiedemann LSM, Veiga Junior VF. The genus: Capsicum: a phytochemical review of bioactive secondary metabolites. RSC Adv. 2018;8(45):25767-84.
- 17 Schenk JJ, Becklund LE, Carey SJ, Fabre PP. What is the “modified” CTAB protocol? Characterizing modifications to the CTAB DNA extraction protocol. Appl Plant Sci. 2023;11(3):1-11.
- 18 Zou Y, Ma K, Tian M. Chemical composition and nutritive value of hot pepper seed (Capsicum annuum) grown in Northeast Region of China. Food Sci Technol. 2015;35(4):659-63.
-
19 Doyle JJ, Doyle JL. A rapid DNA isolation procedure for small quanntities of fresh leaf tissue [Internet]. Vol. 19, Phytochemical Bulletin. 1987. p. 11-5. Available from: https://webpages.uncc.edu/~jweller2/pages/BINF8350f2011/BINF8350_Readings/Doyle_plantDNAextractCTAB_1987.pdf
» https://webpages.uncc.edu/~jweller2/pages/BINF8350f2011/BINF8350_Readings/Doyle_plantDNAextractCTAB_1987.pdf - 20 Fang G, Hammar S, Grumet R. A quick and inexpensive method for removing polysaccharides from plant genomic DNA. Biotechniques. 1992;13(1):52-4.
- 21 Padmalatha K, Prasad MNV. Optimization of DNA isolation and PCR protocol for RAPD analysis of selected medicinal and aromatic plants of conservation concern from Peninsular India. Afr J Biotechnol. 2006;5(3):230-4.
- 22 Khanuja SPS, Shasany AK, Darokar MP, Kuman S. Rapid Isolation of DNA from Dry and Fresh Samples of Plants Producing Large Amounts of Secondary Metabolites and Essential Oils. Plant Mol Biol Report. 1999;17:1-7.
-
23 Heikrujam J, Kishor R, Mazumder PB. The Chemistry Behind Plant DNA Isolation Protocols. In: Boldura OM, Balta C, Awwad NS, editors. Biochemical Analysis Tools - Methods for Bio-Molecules Studies [Internet]. IntechOpen; 2020. p. 1-12. Available from: http://dx.doi.org/10.5772/intechopen.82530
» http://dx.doi.org/10.5772/intechopen.82530 - 24 Peist R, Honsel D, Twieling G, Löffert D. PCR inhibitors in plant DNA preparations. Qiagen News. 2001;(3):7-9.
- 25 Schrader C, Schielke A, Ellerbroek L, Johne R. PCR inhibitors - occurrence, properties and removal. J Appl Microbiol. 2012;113(5):1014-26.
- 26 Pelt-Verkuil, Elizabeth van Belkum A van, Hays JP. Principles and Technical Aspects of PCR Amplifi cation. 1st ed. Vol. 91. Springer Dordrecht; 2008. 330 p.
- 27 Lorenz TC. Polymerase chain reaction: Basic protocol plus troubleshooting and optimization strategies. J Vis Exp. 2012;May(63):e3998.
- 28 Green MR, Sambrook J. Polymerase chain reaction. Cold Spring Harb Protoc. 2019;Jun(6):436-56.
- 29 Krawetz SA, Pon RT, Dixon GH. Increased efficiency of the taq polymerase catalyzed polymerase chain reaction. Nucleic Acids Res. 1989;17(2):819.
- 30 Riedel KHJ, Wingfield BD, Britz TJ. Combined influence of magnesium concentration and polymerase chain reaction specificity enhancers. FEMS Microbiol Lett. 1992;92(1):69-72.
- 31 Altshuler ML. PCR Troubleshooting: The Essential Guide. Caister Academic Press; 2006. 84 p.
- 32 Bej AK, Mahbubani MH, Atlas RM, Salkl RK. Amplification of nucleic acids by polymerase chain reaction (PCR) and other methods and their applications. Crit Rev Biochem Mol Biol. 1991;26(3-4):301-34.